R E S E A R C H A R T I C L E
Open Access
A buffered form of creatine does not promote
greater changes in muscle creatine content, body
composition, or training adaptations than
creatine monohydrate
Andrew R Jagim
1, Jonathan M Oliver
1,2, Adam Sanchez
1†, Elfego Galvan
1†, James Fluckey
3†, Steven Riechman
4†,
Michael Greenwood
1†, Katherine Kelly
5†, Cynthia Meininger
5†, Christopher Rasmussen
1†and Richard B Kreider
1*Abstract
Background:Creatine monohydrate (CrM) has been consistently reported to increase muscle creatine content and improve high-intensity exercise capacity. However, a number of different forms of creatine have been purported to be more efficacious than CrM. The purpose of this study was to determine if a buffered creatine monohydrate (KA) that has been purported to promote greater creatine retention and training adaptations with fewer side effects at lower doses is more efficacious than CrM supplementation in resistance-trained individuals.
Methods:In a double-blind manner, 36 resistance-trained participants (20.2 ± 2 years, 181 ± 7 cm, 82.1 ± 12 kg, and 14.7 ± 5% body fat) were randomly assigned to supplement their diet with CrM (CreapureWAlzChem AG, Trostberg, Germany) at normal loading (4 x 5 g/d for 7-days) and maintenance (5 g/d for 21-days) doses; KA (Kre-AlkalynW, All American Pharmaceutical, Billings, MT, USA)at manufacturer’s recommended doses (KA-L, 1.5 g/d for 28-days); or, KA with equivalent loading (4 x 5 g/d for 7-days) and maintenance (5 g/d) doses of CrM (KA-H). Participants were asked to maintain their current training programs and record all workouts. Muscle biopsies from the vastus lateralis, fasting blood samples, body weight, DEXA determined body composition, and Wingate Anaerobic Capacity (WAC) tests were performed at 0, 7, and 28-days while 1RM strength tests were performed at 0 and 28-days. Data were analyzed by a repeated measures multivariate analysis of variance (MANOVA) and are presented as mean ± SD changes from baseline after 7 and 28-days, respectively.
(Continued on next page)
* Correspondence:[email protected] †Equal contributors
1
Department of Health and Kinesiology, Exercise and Sport Nutrition Laboratory, Texas A&M University, College Station, TX 77843-4243, USA Full list of author information is available at the end of the article
(Continued from previous page)
Results:Muscle free creatine content obtained in a subgroup of 25 participants increased in all groups over time (1.4 ± 20.7 and 11.9 ± 24.0 mmol/kg DW, p = 0.03) after 7 and 28-days, respectively, with no significant differences among groups (KA-L−7.9 ± 22.3, 4.7 ± 27.0; KA-H 1.0 ± 12.8, 9.1 ± 23.2; CrM 11.3 ± 23.9, 22.3 ± 21.0 mmol/kg DW, p = 0.46). However, while no overall group differences were observed (p = 0.14), pairwise comparison between the KA-L and CrM groups revealed that changes in muscle creatine content tended to be greater in the CrM group (KA-L−1.1 ± 4.3, CrM 11.2 ± 4.3 mmol/kg DW, p = 0.053 [mean ± SEM]). Although some significant time effects were observed, no significant group x time interactions (p > 0.05) were observed in changes in body mass, fat free mass, fat mass, percent body fat, or total body water; bench press and leg press 1RM strength; WAC mean power, peak power, or total work; serum blood lipids, markers of catabolism and bone status, and serum electrolyte status; or, whole blood makers of lymphocytes and red cells. Serum creatinine levels increased in all groups (p < 0.001) with higher doses of creatine promoting greater increases in serum creatinine (p = 0.03) but the increases observed (0.1 –0.2 mg/dl) were well within normal values for active individuals (i.e., <1.28 ± 0.2 mg/dl). Serum LDL was decreased to a greater degree following ingesting loading doses in the CrM group but returned to baseline during the maintenance phase. No side effects were reported.
Conclusions:Neither manufacturers recommended doses of KA (1.5 g/d) or KA with equivalent loading (20 g/d for 7-days) and maintenance doses (5 g/d for 21-days) of CrM promoted greater changes in muscle creatine content, body composition, strength, or anaerobic capacity than CrM (20 g/d for 7-days, 5 g/d for 21-days). There was no evidence that supplementing the diet with a buffered form of creatine resulted in fewer side effects than CrM. These findings do not support claims that consuming a buffered form of creatine is a more efficacious and/or safer form of creatine to consume than creatine monohydrate.
Keywords:Creatine monohydrate, Kre-Alkalyn, Training adaptations, Health, Safety
Background
Creatine has proven to be one of the most effective and popular dietary supplements for resistance-trained ath-letes [1-3]. The form of creatine that has been most ex-tensively studied has been creatine monohydrate (CrM) [1]. Studies have consistently indicated that creatine sup-plementation increases muscle creatine and phospho-creatine concentrations by approximately 15-40%, enhances anaerobic exercise capacity, and increases training volume leading to greater gains in strength, power, and muscle mass [1-10]. A number of potential therapeutic benefits have also been suggested in various clinical populations [11-17]. Studies have indicated that creatine monohydrate is not degraded during normal di-gestion and that nearly 99% of orally ingested creatine is either taken up by tissues or excreted in urine [18-20]. Further, no medically significant side effects have been reported in the literature [21-27]. Nevertheless, supple-ment manufacturers have continually introduced newer forms of creatine into the marketplace [1]. These newer forms have been purported to have better physical and chemical properties, bioavailability, efficacy, and/or safety profiles than creatine monohydrate [1]. However, there is little to no evidence that any of the newer forms of creatine are more effective and/or a safer form of cre-atine than CrM whether ingested alone and/or in com-bination with other nutrients [1]. In addition, whereas the safety, efficacy, and regulatory status of CrM is clearly defined in almost all global markets; the safety,
efficacy and regulatory status of other forms of creatine present in today’s marketplace as a dietary or food sup-plement is less clear [1].
or “buffered creatine”from the purported study authors or anyone else. One paper that was presented at the International Society of Sports Nutrition annual meeting in 2007 reported that the conversion of creatine to cre-atinine from CrM at a pH of 1.0 and 37°C was less than 1% after 5, 30 and 120 minutes while KA had a 35% greater conversion to creatinine under similar conditions [31]. However, full details of this study have yet to be published.
Our research group has extensive experience in con-ducting clinical research studies on the efficacy and safety of supplementing the diet during training with various forms of creatine [9,25,26,32-39]. As a result, AlzChem AG (Trostberg, Germany), a primary raw ma-terial provider of pure creatine monohydrate, provided a grant to our university to conduct an independent re-search study to compare the effects of supplementing the diet with KA at recommended doses (1.5 g/d for 28-days) and creatine equivalent loading (20 g/d for 7-28-days) and maintenance doses (5 g/d for 21-days) of KA to CrM (20 g/d for 7-days, 5 g/d for 21-days) on muscle creatine retention, body composition, strength, anaer-obic capacity and markers of health status. We also sought to determine whether ingesting the purported buffered form of creatine would be associated with fewer side effects than creatine monohydrate as claimed. The-oretically, if KA is indeed a more efficacious form of cre-atine, the recommended doses of KA (1.5 g/d) would be as effective or more effective than consuming standard loading (20 g/d for 7-day) and maintenance doses (5 g/d for 21-days) of CrM on increasing muscle creatine levels and training adaptations with fewer side effects. Add-itionally, ingesting creatine equivalent loading and main-tenance doses of KA would theoretically promote greater effects with fewer side effects in those ingesting standard loading and maintenance doses of CrM.
Methods
Experimental design
Table 1 presents the general experimental design employed in this study. The study was conducted in a double-blind, randomized controlled manner. The inde-pendent variable was the type of creatine ingested. Dependent variables included muscle creatine content, body composition, one repetition maximum (1RM) bench press and leg press, anaerobic sprint performance capacity, serum and whole blood clinical markers of health, and self-reported side effects. Dietary intake was not controlled but participant’s dietary intake was recorded prior to each testing session and analyzed for energy intake and macronutrient content. Participants were instructed to maintain their normal resistance-training program and maintain resistance-training logs so resistance-training volume could be compared. Subjects who qualified for
the study participated in a familiarization session in which the study was explained to the participants and informed consent was obtained. After the familiarization session, subjects were matched for bodyweight, years of training experience, and age and randomly assigned to one of three groups: 1.) KA at manufacturer’s recom-mended doses (KA-L, 1.5 g/d for 28-days); 2.) KA at cre-atine equivalent loading (4 x 5 g/d for 7-days) and maintenance (5 g/d for 21-days) doses as CrM (KA-H); or, 3.) CrM at normal loading (4 x 5 g/d for 7-days) and maintenance doses (5 g/d for 21-days).
Participants
Apparently healthy resistance-trained males with no self-reported recent history of creatine supplementation were recruited to participate in this study. Participants were not allowed to participate in this study if they had any metabolic disorder including known electrolyte abnor-malities; heart disease, arrhythmias, diabetes, thyroid disease, or hypogonadism; a history of hypertension, hepatorenal, musculoskeletal, autoimmune, or neurologic disease; if they were taking thyroid, anti-hyperlipidemic, hypoglycemic, anti-hypertensive, anti-inflammatory, or androgenic medications; or, if they had taken dietary sup-plements containing creatine within three months prior to the start of the study. Participants were recruited from the student population and from area fitness facilities. Participants completed demographic, health history and exercise history forms. Those who met eligibility criteria were informed of the requirements of the study and signed informed consent statements in compliance with the Human Subjects Guidelines of Texas A&M Univer-sity and the American College of Sports Medicine. Sub-jects participated in a familiarization session that included practicing the Wingate anaerobic capacity test.
Testing sessions
returned to undergo all tests. This allowed for the as-sessment of acute and chronic supplementation proto-cols on muscle creatine levels, body composition, exercise performance, as well as markers of clinical health and safety. Participants were asked to maintain their current training programs and record all workouts. Participants were also asked to report side effects on a weekly basis.
Supplementation protocol
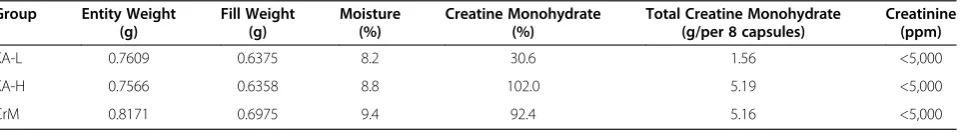
Participants were matched into one of three groups according to body weight, training status/experience, and age. Subjects were then randomly assigned to one of three groups to ingest, in a double blind manner, cap-sules containing CrM (CreapureW AlzChem AG, Trost-berg, Germany, Lot #108631) or KA (Kre-AlkalynW All American Pharmaceutical, Billings, MT, USA, Lot #1067000) at two different dosages. Supplements were provided by the supporting sponsor in red 0.75 gram (00 sized) capsules and placed in generic single-serving packets that were put in labeled containers for double-blind administration on a weekly basis. Creatine content of the capsules was independently verified by Covance Laboratories (Madison, WI). Certificate of analysis results are presented in Table 2. Participants in the CrM
groups ingested 8 capsules per serving containing ap-proximately 5 g of CrM four times daily (20 g/d) for 7-days and once per day (5 g/d) for 21-7-days. A small amount of dextrose (~60 mg per capsule) was added to the CrM capsules to enhance flowability during encapsu-lation. Participants in the KA creatine monohydrate equivalent group (KA-H) ingested 8 capsules per serving containing approximately 5 g of CrM four times daily (20 g/d) for 7-days and once per day (5 g/d) for 21-days. Participants assigned to ingest the manufacturers recom-mended doses of KA (KA-L) ingested 8 capsules con-taining a total of approximately 1.5 g of KA mixed with 3.5 g of dextrose once per day and 8 capsules containing 5 g of dextrose three times per day during the initial 7-day loading period. Thereafter, participants in the KA-L group ingested 8 capsules per day containing 1.5 g/d of KA mixed with 3.5 g of dextrose for 21-days. Participants were instructed to ingest supplements at 8:00 am, 12:00 pm, 4:00 pm, and 8:00 pm during the initial 7-day supplementation period and at 8:00 am during the main-tenance phase. Supplementation compliance was moni-tored by having the subjects return empty containers of the supplements at the end of each week. In addition, subject’s compliance was verified by administering and collecting weekly questionnaires. After completing the
Table 2 Supplement Certificate of Analysis Results
Group Entity Weight (g)
Fill Weight (g)
Moisture (%)
Creatine Monohydrate (%)
Total Creatine Monohydrate (g/per 8 capsules)
Creatinine (ppm)
KA-L 0.7609 0.6375 8.2 30.6 1.56 <5,000
KA-H 0.7566 0.6358 8.8 102.0 5.19 <5,000
CrM 0.8171 0.6975 9.4 92.4 5.16 <5,000
Samples analyzed by Covance Laboratory Inc. (Madison, WI). Sample size was eight capsules. Table 1 Overview of Study Design
Familiarization and Entry Baseline Day 0 Loading Phase Day 7 Maintenance Phase Day 28
Familiarization session 4-Day Diet History 4-Day Diet History 4-Day Diet History
Informed Consent Form Muscle Biopsy Submit Training Log Submit Training Log
Demographic Form Fasting Blood Sample
Body Weight
Muscle Biopsy Muscle Biopsy
Health History Form Body Water (BIA) Fasting Blood Sample Fasting Blood Sample
Exercise History Form DEXA Body Composition Body Weight Body Weight
4-day Dietary History 1 RM Leg Press Body Water (BIA) Body Water (BIA)
General Exam to Determine Qualifications to Participate in Study
1 RM Bench Press DEXA Body Composition DEXA Body Composition
Height and Body Weight Wingate Anaerobic
Capacity Test
Wingate Anaerobic Capacity Test 1 RM Leg Press
Practice Wingate Anaerobic Capacity Test
Loading Phase of Supplementation Begins
Low-Dose Maintenance Phase of Supplementation Begins
1 RM Bench Press
Randomization into one of three groups (CrM, KA-L, KA-H)
Maintain Training Log Wingate Anaerobic Capacity Test
compliance procedures, the subjects were given the required supplements for the next week.
Procedures
Diet and training analysis
Participants were instructed to maintain their current dietary habits and to keep detailed dietary records. Prior to each testing session subjects completed a dietary rec-ord that included 3 weekdays and 1 weekend day. Diet-ary inventories were reviewed by a registered dietitian and analyzed for average energy and macronutrient in-take using the Food Processor Nutrition Analysis Soft-ware Version 9.1.0 (ESHA Nutrition Research, Salem, OR). Participants were also instructed to maintain their current training regimen and record the type and num-ber of sets and repetitions performed on training logs. Training volume was calculated by multiplying the amount of weight lifted times the number of repetitions performed for each set performed. Total training volume during the study was analyzed by summing all lifts (upper and lower body) to determine if there were any differences among groups.
Body composition
Body composition testing occurred on day 0, 7 and 28 of the study. Height and weight were recorded to the near-est 0.02 kg and 0.01 cm, respectively, using a self-calibrating digital scale (Cardinal Detecto Scale Model 8430, Webb City, Missouri). Body composition was determined using a Hologic Discovery W QDR series DEXA system (Hologic Inc., Waltham, MA) equipped with APEX software (APEX Corporation Software version 12.1, Pittsburgh, PA). Quality control calibration proce-dures were performed on a spine phantom (Hologic-X-CLAIBER Model DPA/QDR-1 anthropometric spine phantom) and a density step calibration phantom prior to each testing session. DEXA has been validated as an accurate method for body composition assessment [40]. Mean test-retest reliability studies performed on male athletes in our lab has yielded mean coefficients of vari-ation for total bone mineral content and total fat free/ soft tissue mass of 0.31% to 0.45% with a mean intra-class correlation of 0.985 [41]. Body water was estimated using an ImpediMed DF50 bioelectrical impedance analyzer (ImpediMed, San Diego, CA).
Blood and muscle samples
Subjects donated approximately 10 ml of fasting blood using venipuncture techniques from an antecubital vein in the forearm according to standard sterile procedures. Serum blood samples were sent to Quest Diagnostics (Houston, TX) for comprehensive metabolic panel ana-lysis using an Olympus AAU 5400 Chemistry Immuno Analyzer (Olympus America Inc., Center Valley, PA).
Whole blood samples were analyzed for complete blood counts with platelet differentials using an Abbott Cell Dyn 3500 automated hematology analyzer (Abbott La-boratories, Abbott Park, IL). Reported test to test reli-ability of performing these assays generally range from 2 to 6% for individual assays. Samples were run in dupli-cate to verify results if the observed values were outside control values and/or clinical norms according to stand-ard procedures.
Muscle biopsies were obtained using a modified Berg-strom needle biopsy technique following standard proce-dures [42]. Percutaneous muscle biopsies (50–70 mg) were obtained from the middle portion of the vastus lateralis muscle of the dominant leg at the midpoint be-tween the patella and the greater trochanter of the femur at a depth between 1 and 2 cm into the muscle. For the remaining two biopsies, attempts were made to extract tissue from approximately the same location as the ini-tial biopsy by using the pre-biopsy scar, depth markings on the needle, and successive incisions that were made approximately 2 cm proximal to the former site. After removal, adipose tissue was trimmed from the muscle specimens which were then immediately frozen in liquid nitrogen and then stored at −80°C for later analysis. A total of three muscle samples were obtained (Day 0, 7, & 28). Muscle tissue samples were analyzed spectrophoto-metrically in duplicate for creatine (Cr) using methods developed by Harris and colleagues [7,8,43]. Briefly, ap-proximately 50–70 mg of muscle tissue was cut and placed in a microfuge tube, and then placed in a vacuum centrifuge (Savant ISS110 SpeedVac Concentrator, Thermo Scientific, Milford, MA) and centrifuged for 18– 24 hours. Connective tissue was removed from the dried samples which were then grinded into a powder in a porcelain plate and placed into pre-weighed microfuge tubes. Muscle metabolites were extracted in a 0.5 M per-chloric acid/ 1 mM EDTA solution on ice for 15 minutes, while periodically vortexing. Samples were then centri-fuged at 7,000 rpm for 5 minutes. The supernatant was transferred into a pre-weighed microfuge tube and neu-tralized with 2.1 M KHCO3/0.3 M MOPS solution. The samples were then centrifuged again at 7,000 rpm for 5 minutes and the supernatant was removed and placed into microfuge tubes and frozen at−80°C.
baseline absorbance values. FiveμL of CK (25μ/mg) was added to 1 mL of the above buffer and stabilized using 1 mL of reagent. After 10 minutes the plate was read again for post-reaction absorbance values. Test to test reliability of duplicate muscle creatine assays was 0.22 ± 2.4% (r = 0.90) with a coefficient of variation of 6.8. We also assayed muscle samples for phosphocreatine (PCr) but several values were out of normal ranges, there was large variability in values observed, and overall PCr levels declined over time despite creatine supplementation sug-gesting a lack of validity in this assay. Therefore, these data were not reported.
Performance tests
Maximal strength tests were performed using a standard isotonic Olympic bench press and hip sled/leg press (Nebula Fitness, Versailles, OH) according to standar-dized procedures [44]. Hand positioning on the bench press and foot and seat position on the hip sled/leg press were standardized between trials. Participants followed a standardized warm-up (10 repetitions at 50% of 1RM) prior to beginning 1RM attempts. Rest recovery was standardized between attempts at 2-min and participants typically reached their 1RM within 3–5 attempts after warming up. Participants performed the hip sled/leg press 1RM test, rested for 4 minutes, and then began warming up on the bench press. Bench press 1RM was determined following similar procedures as the hip sled/ leg press 1RM test. Test-to-test reliability of performing these tests in our lab on resistance-trained participants have yielded low day to day mean coefficients of vari-ation and high reliability for the bench press (1.1%, class r = 0.99) and hip sled/leg press (0.7%, intra-class r = 0.91). Subjects rested for about 20-minutes and then warmed up on a bicycle ergometer for 3-minutes (70 rpm @ 1 kg resistance). Participants then performed a 30-second Wingate sprint anaerobic capacity test on a Lode Excalibur Sport 925900 cycle ergometer (Lode BV, Groningen, The Netherlands) at a standardized work rate of 7.5 J/kg/rev. The seat position was standardized be-tween trials and the participant was asked to pedal as fast as possible prior to application of the workload and sprint at all-out maximal capacity during the 30-second test. Test-to-test variability in performing repeated Win-gate anaerobic capacity tests in our laboratory yielded correlation coefficients ofr =0.98 ±15% for mean power. Participants practiced the anaerobic capacity test during the familiarization session to minimize learning effects.
Side effect assessment
Participants were given weekly questionnaires on how well they tolerated the supplement, how well they fol-lowed the supplement protocol, and if they experienced any medical problems/symptoms during the study.
Compliance to the supplementation protocol was moni-tored by turning in empty weekly supplement contain-ers, supplement logs and verbal confirmation. After completing the compliance procedures, subjects were given the required supplements and dosages for the fol-lowing supplementation period.
Data analysis
Participant baseline demographic data were analyzed by one-way Analysis of Variance (ANOVA). Study data were analyzed by Multivariate Analysis of Variance (MAN-OVA) with repeated measures. Overall MANOVA effects were examined using the Wilks’Lamda time and group x time p-levels as well as MANOVA univariate ANOVA group effects. Greenhouse-Geisser univariate tests of within-subjects time and group x time effects and between-subjects univariate group effects were reported for each variable analyzed within the MANOVA model. In some instances, repeated measures ANOVA was run on variables not included in a MANOVA design with univariate group, time, and group x time interaction effects reported. Data were considered statistically sig-nificant when the probability of type I error was 0.05 or less and statistical trends were considered when the probability of error ranged between p > 0.05 to p < 0.10. If a significant group, treatment and/or interaction alpha level was observed, Tukey’s least significant differences (LSD) post-hoc analysis was performed to determine where significance was obtained.A prioripower analysis of the design indicated that an n-size of 12 per group was sufficiently powered to identify previously reported changes in muscle creatine content and training adapta-tions in responses to creatine supplementation (>0.70).
Results
Subject demographics
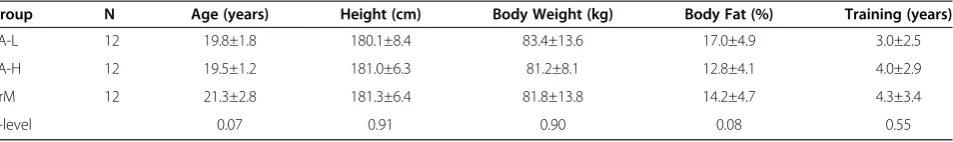
Forty-one participants were initially recruited for the study, completed consent forms and participated in the required familiarization session. Of the original 41 parti-cipants, 36 completed the 28-day research study. Three participants dropped out due to time constraints, one due to an unrelated illness, and one due to apprehension of the muscle biopsy procedure. None of the participants dropped out of the study due to side effects related to the study protocol. Table 3 shows the baseline demo-graphics for the participants. Overall, participants were 20.2 ± 2 years, 181 ± 7 cm, 82.1 ± 12 kg, and 14.7 ± 5% fat with 3.8 ± 3 years of resistance training experience. One-way ANOVA revealed no significant differences among groups in baseline demographic variables.
Compliance, side effects, training, and diet
without experiencing any side effects throughout the duration of the 28-day supplementation protocol. Table 4 shows the total training volumes for upper and lower body lifts. One-way ANOVA revealed that there were no significant differences among groups in total upper body training volume (p = 0.89) or lower body training volume (p = 0.55). Table 5 presents mean energy intake and macronutrient content for each group. MANOVA revealed no overall significant Wilks’ Lambda time (p = 0.39) or group x time (p = 0.56) interaction effects in absolute energy intake (kcal/d), protein intake (g/d), carbohydrate (g/d) or fat intake (g/d). MANOVA uni-variate analysis revealed a significant time effect suggest-ing that energy and protein intake tended to decrease during the study but no significant interactions were observed among groups. Similar results were observed when assessing energy and macronutrient intake when expressed relative to body mass.
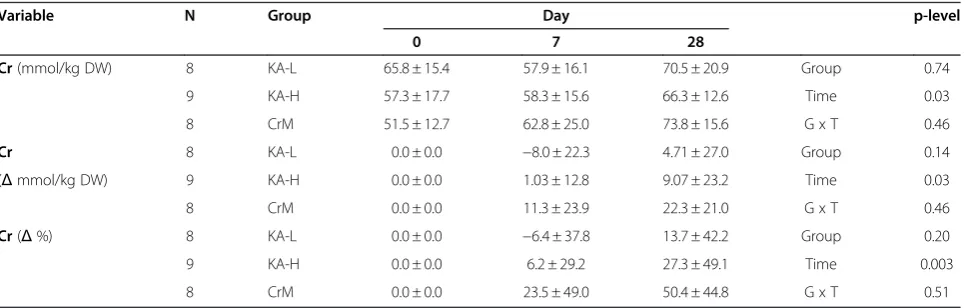
Muscle creatine analysis
Table 6 presents muscle free creatine content data while Figure 1 shows changes in muscle free content. Sufficient muscle samples were obtained to measure baseline and subsequent creatine on 25 participants. Subjects with missing baseline or day-28 data were not included in the analysis. Two day-7 missing creatine values were replaced using the last observed value method. A MANOVA was run on muscle creatine expressed in mmol/kg DW and changes from baseline expressed in mmol/kg DW and percent changes from baseline. An overall MANOVA time effect (Wilks’Lamda p = 0.002) was observed with no sig-nificant overall MANOVA group x time interactions (Wilks’ Lambda p = 0.55). MANOVA univariate analysis revealed significant time effects in muscle free creatine
content expressed in absolute terms (p = 0.03), changes from baseline (p = 0.03), and percent changes from base-line (p = 0.003). No significant groups x time interactions were observed among groups. However, while no overall group differences were observed (p = 0.14), pairwise com-parison between the KA-L and CrM groups revealed that changes in muscle creatine tended to be greater in the CrM group (KA-L −1.1 ± 4.3, CrM 11.2 ± 4.3 mmol/kg DW, p = 0.053 [mean ± SEM]; KA-L 2.4 ± 8.5, CrM 24.6 ± 8.5%, p = 0.078 [mean ± SEM]).
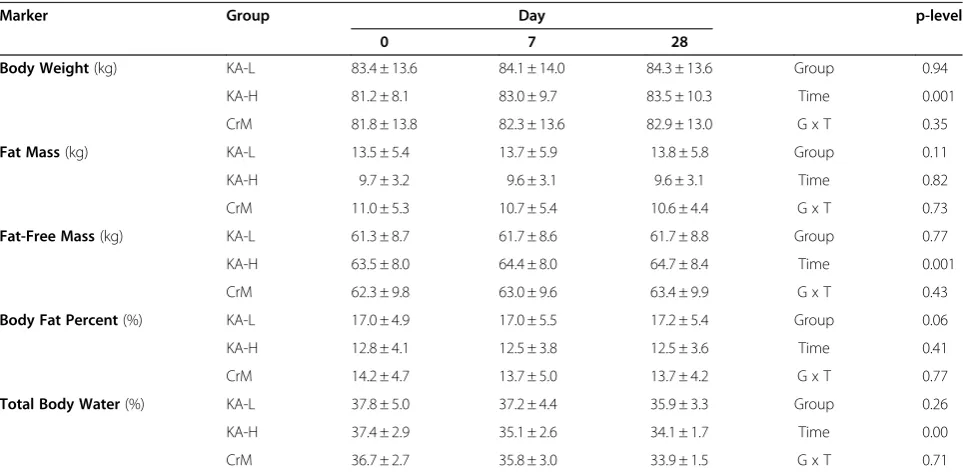
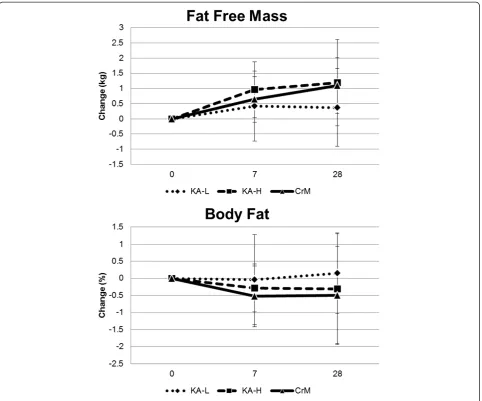
Body composition
Table 7 presents body composition results observed dur-ing the study while Figure 2 shows the changes observed over time in fat free mass and percent body fat. Overall MANOVA revealed significant time effects (Wilks’ Lambda p = 0.001) with no significant group x time interactions observed (Wilks’ Lambda p = 0.90) in body composition variables. Bodyweight increased in all groups over time (1.0 ± 1.9, 1.42 ± 2.5 kg, p < 0.001) with no significant group x time interaction effects observed among groups after 7 and 28-days, respectively, of sup-plementation (KA-L 0.7 ± 0.83, 0.9 ± 1.6; KA-H 1.7 ± 2.9, 2.3 ± 3.7; CrM 0.6 ± 1.1, 1.1 ± 1.4 kg, p = 0.35). Fat-free mass significantly increased over time for all groups (0.67 ± 1.0, 0.89 ± 1.2 kg, p < 0.001) with no significant group x time interaction effects observed among groups (KA-L 0.42 ± 1.2, 0.37 ± 1.3; KA-H 0.96 ± 0.9, 1.2 ± 1.4; CrM 0.6 ± 0.8, 1.1 ± 0.9 kg, p = 0.43). Body fat percent was not significantly decreased over time for all groups (−0.28 ± 1.0, -0.22 ± 1.4%, p = 0.41) and no significant group x time interactions were observed among groups (KA-L −0.04 ± 1.3, 0.15 ± 1.2; KA-H −0.28 ± 0.7, -0.31 ± 1.6; CrM −0.53 ± 0.9, -0.50 ± 1.4%, p = 0.77). Total body water expressed as a percentage of bodyweight sig-nificantly decreased over time for all groups (−1.25 ± 3.7, -2.68 ± 3.4%, p < 0.001) with no significant group x time interaction effects observed among groups (KA-L
−0.58 ± 4.1, -1.95 ± 4.4; KA-H −2.25 ± 2.0, -3.28 ± 3.1; CrM−0.92 ± 4.6, -2.82 ± 2.6%, p = 0.71).
Training adaptations
Table 8 shows upper and lower body 1RM strength data observed for each group while Figure 3 shows the Table 3 Participant Demographics
Group N Age (years) Height (cm) Body Weight (kg) Body Fat (%) Training (years)
KA-L 12 19.8±1.8 180.1±8.4 83.4±13.6 17.0±4.9 3.0±2.5
KA-H 12 19.5±1.2 181.0±6.3 81.2±8.1 12.8±4.1 4.0±2.9
CrM 12 21.3±2.8 181.3±6.4 81.8±13.8 14.2±4.7 4.3±3.4
p-level 0.07 0.91 0.90 0.08 0.55
Values are means ± standard deviations. Data were analyzed by one-way ANOVA.
Table 4 Training Volume
Group Upper Body (kg) Lower Body (kg)
KA-L 65,006 ± 35,543 40,631 ± 20,641
KA-H 74,445 ± 42,340 32,930 ± 20,258
CrM 69,227 ± 62,251 32,665 ± 19,471
p-level 0.89 0.55
Training logs were obtained on all participants (n = 36 or 12 per group). Values are means ± standard deviations.
changes in 1RM bench press. There was a significant in-crease in 1RM for bench press in all groups over time (97.6 ± 22.3 to 101.3 ± 22.6 kg, p < 0.001) with no
significant group x time interactions observed among groups in changes in bench press 1RM (KA-L 3.22 ± 1.5, KA-H 3.3 ± 6.8, CrM 4.5 ± 3.7 kg, p = 0.73). There was Table 5 Dietary Caloric and Macronutrient Intake
Variable Group Day p-level
0 7 28
Calories(kcal/day) KA-L 2,167 ± 900 2,202 ± 653 1,998 ± 444 Group 0.29
KA-H 2,506 ± 645 2,604 ± 670 2,321 ± 677 Time 0.08
CrM 2,511 ± 582 2,372 ± 735 2,312 ± 394 G x T 0.81
Protein(g/d) KA-L 126.3 ± 76 126.2 ± 58 112.4 ± 46 Group 0.65
KA-H 139.4 ± 46 143.2 ± 54 132.5 ± 60 Time 0.05
CrM 127.8 ± 28 131.2 ± 40 114.1 ± 35 G x T 0.97
Carbohydrate(g/d) KA-L 219.1 ± 73 203.9 ± 79 181.7 ± 53 Group 0.53
KA-H 221.9 ± 74 216.0 ± 91 206.1 ± 86 Time 0.40
CrM 231.0 ± 72 226.1 ± 93 242.6 ± 66 G x T 0.38
Fat(g/d) KA-L 78.6 ± 38 84.7 ± 27 71.6 ± 16 Group 0.20
KA-H 99.2 ± 40 105.7 ± 47 94.5 ± 35 Time 0.19
CrM 91.3 ± 32 81.3 ± 30 83.0 ± 20 G x T 0.47
Calories KA-L 26.2 ± 10.0 26.6 ± 7.9 24.4 ± 7.2 Group 0.29
(kcal/kg/d) KA-H 31.4 ± 9.5 32.1 ± 10.5 28.3 ± 9.4 Time 0.06
CrM 31.2 ± 7.5 29.0 ± 8.8 28.4 ± 5.8 G x T 0.73
Protein KA-L 1.50 ± 0.8 1.52 ± 0.7 1.36 ± 0.6 Group 0.58
(g/kg/d) KA-H 1.75 ± 0.7 1.76 ± 0.8 1.61 ± 0.8 Time 0.04
CrM 1.59 ± 0.4 1.61 ± 46 1.41 ± 0.4 G x T 0.99
Carbohydrate KA-L 2.69 ± 1.0 2.48 ± 0.9 2.21 ± 0.7 Group 0.50
(g/kg/d) KA-H 2.75 ± 0.9 2.65 ± 1.2 2.46 ± 1.0 Time 0.24
CrM 2.87 ± 0.9 2.76 ± 1.1 2.99 ± 0.9 G x T 0.34
Fat KA-L 0.96 ± 0.4 1.02 ± 0.3 0.87 ± 0.2 Group 0.23
(g/kg/d) KA-H 1.24 ± 0.6 1.31 ± 0.7 1.16 ± 0.5 Time 0.14
CrM 1.14 ± 0.4 1.0 ± 0.4 1.01 ± 0.3 G x T 0.44
Nutritional records were analyzed on all participants (n = 36 or 12 per group). Values are means ± standard deviations. Absolute and relative nutritional data were analyzed by MANOVA. Greenhouse-Geisser time and group x time (G x T) interaction p-levels are reported with univariate group p-levels.
Table 6 Muscle Creatine Levels
Variable N Group Day p-level
0 7 28
Cr(mmol/kg DW) 8 KA-L 65.8 ± 15.4 57.9 ± 16.1 70.5 ± 20.9 Group 0.74
9 KA-H 57.3 ± 17.7 58.3 ± 15.6 66.3 ± 12.6 Time 0.03
8 CrM 51.5 ± 12.7 62.8 ± 25.0 73.8 ± 15.6 G x T 0.46
Cr 8 KA-L 0.0 ± 0.0 −8.0 ± 22.3 4.71 ± 27.0 Group 0.14
(Δmmol/kg DW) 9 KA-H 0.0 ± 0.0 1.03 ± 12.8 9.07 ± 23.2 Time 0.03
8 CrM 0.0 ± 0.0 11.3 ± 23.9 22.3 ± 21.0 G x T 0.46
Cr(Δ%) 8 KA-L 0.0 ± 0.0 −6.4 ± 37.8 13.7 ± 42.2 Group 0.20
9 KA-H 0.0 ± 0.0 6.2 ± 29.2 27.3 ± 49.1 Time 0.003
8 CrM 0.0 ± 0.0 23.5 ± 49.0 50.4 ± 44.8 G x T 0.51
no significant difference observed in hip sled/leg press 1RM over time (449.5 ± 162, 471.1 ± 167, p = 0.33) or interactions observed among groups in changes in hip sled/leg press 1RM (KA-L 8.7 ± 111, KA-H 68.8 ± 96, CrM −13.3 ± 185 kg, p = 0.33) Table 9 shows results for the anaerobic capacity test while Figure 4 presents changes in total work observed for each group. MAN-OVA analysis revealed an overall time effect (Wilks’ Lambda p = 0.001) with no significant overall group x
time effects (Wilks’ Lambda p = 0.47) in anaerobic cap-acity variables. Univariate MANOVA analysis revealed that average power (p = 0.005), peak power (p = 0.003), and total work (p = 0.005) increased in all groups over time with no significant group x time interactions observed among groups. Total work performed on the anaerobic capacity sprint test increased in all groups over time (−69 ± 1,030, 552 ± 1,361 J, p = 0.02) with no significant group x time effects observed among groups
Figure 1Changes in muscle free creatine content from baseline.
Table 7 Body Composition
Marker Group Day p-level
0 7 28
Body Weight(kg) KA-L 83.4 ± 13.6 84.1 ± 14.0 84.3 ± 13.6 Group 0.94
KA-H 81.2 ± 8.1 83.0 ± 9.7 83.5 ± 10.3 Time 0.001
CrM 81.8 ± 13.8 82.3 ± 13.6 82.9 ± 13.0 G x T 0.35
Fat Mass(kg) KA-L 13.5 ± 5.4 13.7 ± 5.9 13.8 ± 5.8 Group 0.11
KA-H 9.7 ± 3.2 9.6 ± 3.1 9.6 ± 3.1 Time 0.82
CrM 11.0 ± 5.3 10.7 ± 5.4 10.6 ± 4.4 G x T 0.73
Fat-Free Mass(kg) KA-L 61.3 ± 8.7 61.7 ± 8.6 61.7 ± 8.8 Group 0.77
KA-H 63.5 ± 8.0 64.4 ± 8.0 64.7 ± 8.4 Time 0.001
CrM 62.3 ± 9.8 63.0 ± 9.6 63.4 ± 9.9 G x T 0.43
Body Fat Percent(%) KA-L 17.0 ± 4.9 17.0 ± 5.5 17.2 ± 5.4 Group 0.06
KA-H 12.8 ± 4.1 12.5 ± 3.8 12.5 ± 3.6 Time 0.41
CrM 14.2 ± 4.7 13.7 ± 5.0 13.7 ± 4.2 G x T 0.77
Total Body Water(%) KA-L 37.8 ± 5.0 37.2 ± 4.4 35.9 ± 3.3 Group 0.26
KA-H 37.4 ± 2.9 35.1 ± 2.6 34.1 ± 1.7 Time 0.00
CrM 36.7 ± 2.7 35.8 ± 3.0 33.9 ± 1.5 G x T 0.71
(KA-L −278 ± 676, 64 ± 1,216; KA-H 412 ± 1,041, 842 ± 1,369; CrM−301 ± 1,224, 775 ± 1,463 J, p = 0.32).
Clinical chemistry panels
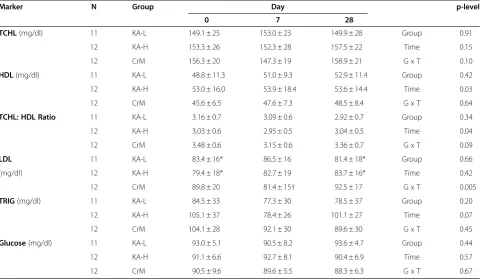
Table 10 presents blood lipid data observed throughout the study Overall MANOVA revealed no time (Wilks’
Lambda p = 0.17) or groups x time effects (Wilks’ Lambda 0.15) in blood lipids. Univariate MANOVA also found no group x time interactions in total cholesterol (TCHL, p = 0.10), high-density lipoprotein (HDL, p = 0.64), the ratio of TCHL to HDL (p = 0.09), and tri-glycerides (TRIG, p = 0.45). Some group x time effects
Figure 2Changes in fat free mass and body fat from baseline.
Table 8 One Repetition Maximum Strength
Variable N Group Day p-level
0 28
Upper Body(kg) 12 KA-L 95.3 ± 25.4 98.6 ± 24.7 Group 0.89
11 KA-H 98.4 ± 18.2 101.7 ± 17.3 Time 0.001
12 CrM 99.12 ± 24.0 103.7 ± 26.1 G x T 0.73
Lower Body(kg) 12 KA-L 445.3 ± 182 454.1 ± 155 Group 0.52
12 KA-H 465.4 ± 117 539.0 ± 163 Time 0.35
12 CrM 439.1 ± 189 425.8 ± 175 G x T 0.31
were observed among groups in low-density lipoprotein (LDL) levels (p = 0.005) with LDL levels significantly de-creasing after the loading phase in the CrM group. How-ever, values remained low and near baseline. Univariate ANOVA revealed no significant differences among groups in blood glucose (p = 0.67).
Table 11 shows markers of catabolism and bone status. Overall MANOVA revealed significant time (Wilks’ Lambda p < 0.001) effects with no significant group x time effects (Wilks’Lambda p = 0.19) in markers of catabolism. Univariate MANOVA found no significant group x time interactions in blood urea nitrogen (BUN, p = 0.75), BUN to creatinine ratio (p = 0.24), aspartate aminotransferase (AST, p = 0.68), alanine aminotransferase (ALT, p = 0.48), total protein (p = 0.84), and total bilirubin (TBIL, p = 0.26). Serum creatinine levels increased in all groups (p < 0.001) over time with a significant group x time interaction dem-onstrating higher doses of creatine in the CrM and KA-H
groups promoting significantly greater increases in serum creatinine (p = 0.03) than the KA-L group. However, cre-atinine levels in the CrM and KA-H groups were only 0.1 – 0.2 mg/dL greater than the KA-L group, well within normal values for active individuals, and of no clinical sig-nificance. MANOVA analysis of bone related markers found no significant time (Wilks’ Lambda p = 0.83) or group x time effects (Wilks’ Lambda p = 0.78). Likewise, univariate MANOVA analysis revealed no significant interactions among groups in bone mineral content (p = 0.66), albumin (ALB, p = 0.89), globulin (GLOB, p = 0.42), the ratio of ALB to GLOB (p = 0.45), calcium (p = 0.76), or alkaline phosphatase (ALK, p = 0.65).
Table 12 presents serum electrolyte data. Overall MAN-OVA analysis revealed a significant time effect (Wilks’ Lambda p = 0.02) with no significant overall interaction (Wilks’ Lambda p = 0.26). Univariate MANOVA analysis revealed some small time effects in chloride levels
Figure 3Changes in bench press 1RM strength from baseline.
Table 9 Wingate Anaerobic Sprint Capacity
Variable N Group Day p-level
0 7 28
Mean Power(W) 12 KA-L 658 ± 136 651 ± 134 660 ± 138 Group 0.61
11 KA-H 689 ± 99 703 ± 113 717 ± 114 Time 0.005
12 CrM 660 ± 119 652 ± 108 688 ± 105 G x T 0.21
Peak Power(W) 12 KA-L 1,274 ± 259 1,393 ± 286 1,585 ± 526 Group 0.50
11 KA-H 1,329 ± 285 1,538 ± 389 1,616 ± 378 Time 0.003
12 CrM 1,478 ± 376 1,626 ± 281 1,571 ± 409 G x T 0.48
Total Work(J) 12 KA-L 19,728 ± 4,076 19,450 ± 3,910 19,792 ± 4,153 Group 0.59
11 KA-H 20,681 ± 2,968 21,093 ± 3,387 21,523 ± 3,432 Time 0.005
12 CrM 19,799 ± 3,564 19,497 ± 3,210 20,573 ± 3,128 G x T 0.22
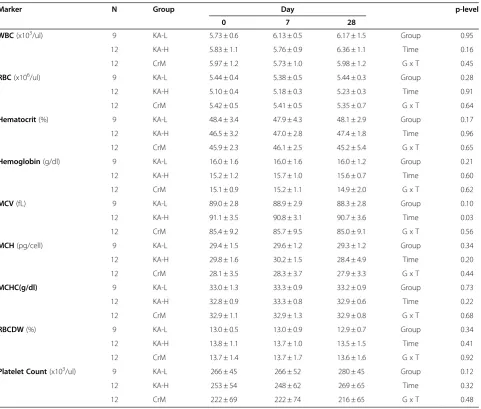
(p = 0.008) and a trend toward an interaction in potassium levels (p = 0.08) but the small changes observed would have no clinical significance. Finally, Table 12 shows whole blood markers assessed throughout the study. Overall MANOVA revealed no significant time (Wilks’ Lambda p = 0.25) or group x time effects (Wilks’Lambda p = 0.78). Likewise, no significant interactions were observed among
groups in white blood cell count (WBC, p = 0.45), red blood cell count (RBC, p = 0.64), hematocrit (p = 0.65), hemoglobin (p = 0.59), mean corpuscular volume (MCV, p = 0.56), mean corpuscular hemoglobin (MCH, p = 0.44), mean corpuscular hemoglobin concentration (MCHC, p = 0.68), red blood cell distribution width (RBCDW, p = 0.92), or platelet count (p = 0.48).
Figure 4Changes in cycling anaerobic work capacity from baseline.
Table 10 Serum lipids and glucose
Marker N Group Day p-level
0 7 28
TCHL(mg/dl) 11 KA-L 149.1 ± 25 153.0 ± 23 149.9 ± 28 Group 0.91
12 KA-H 153.3 ± 26 152.3 ± 28 157.5 ± 22 Time 0.15
12 CrM 156.3 ± 20 147.3 ± 19 158.9 ± 21 G x T 0.10
HDL(mg/dl) 11 KA-L 48.8 ± 11.3 51.0 ± 9.3 52.9 ± 11.4 Group 0.42
12 KA-H 53.0 ± 16.0 53.9 ± 18.4 53.6 ± 14.4 Time 0.03
12 CrM 45.6 ± 6.5 47.6 ± 7.3 48.5 ± 8.4 G x T 0.64
TCHL: HDL Ratio 11 KA-L 3.16 ± 0.7 3.09 ± 0.6 2.92 ± 0.7 Group 0.34
12 KA-H 3.03 ± 0.6 2.95 ± 0.5 3.04 ± 0.5 Time 0.04
12 CrM 3.48 ± 0.6 3.15 ± 0.6 3.36 ± 0.7 G x T 0.09
LDL 11 KA-L 83.4 ± 16* 86.5 ± 16 81.4 ± 18* Group 0.66
(mg/dl) 12 KA-H 79.4 ± 18* 82.7 ± 19 83.7 ± 16* Time 0.42
12 CrM 89.8 ± 20 81.4 ± 15† 92.5 ± 17 G x T 0.005
TRIG(mg/dl) 11 KA-L 84.5 ± 33 77.3 ± 30 78.5 ± 37 Group 0.20
12 KA-H 105.1 ± 37 78.4 ± 26 101.1 ± 27 Time 0.07
12 CrM 104.1 ± 28 92.1 ± 30 89.6 ± 30 G x T 0.45
Glucose(mg/dl) 11 KA-L 93.0 ± 5.1 90.5 ± 8.2 93.6 ± 4.7 Group 0.44
12 KA-H 91.1 ± 6.6 92.7 ± 8.1 90.4 ± 6.9 Time 0.57
12 CrM 90.5 ± 9.6 89.6 ± 5.5 88.3 ± 6.3 G x T 0.67
Discussion
The purpose of this study was to determine if supple-menting the diet with recommended (1.5 g/d for
28-days) or creatine equivalent loading and maintenance doses of a purported buffered form of creatine (20 g/d for 7-days and 5 g/d for 21-days) was more effective in Table 11 Markers of catabolism and bone status
Marker N Group Day p-level
0 7 28
BUN(mg/dl) 11 KA-L 16.0 ± 5.3 15.3 ± 4.9 15.6 ± 5.1 Group 0.89
12 KA-H 16.1 ± 3.3 16.6 ± 3.9 16.6 ± 3.6 Time 0.70
12 CrM 16.4 ± 3.2 15.7 ± 2.7 16.1 ± 4.7 G x T 0.75
Creatinine 11 KA-L 1.04 ± 0.08 1.08 ± 0.11 1.13 ± 0.10† Group 0.07
(mg/dl) 12 KA-H 1.07 ± 0.14 1.23 ± 0.18†* 1.26 ± 0.13†* Time 0.001
12 CrM 1.11 ± 0.19 1.28 ± 0.20†* 1.23 ± 0.15†* G x T 0.03
BUN:CRN Ratio 11 KA-L 15.5 ± 5.1 14.5 ± 5.6 14.1 ± 5.6 Group 0.83
12 KA-H 15.1 ± 3.4 13.7 ± 3.4 13.3 ± 3.4 Time 0.001
12 CrM 15.2 ± 3.7 12.4 ± 2.6 13.2 ± 3.8 G x T 0.24
AST(U/L) 11 KA-L 25.4 ± 9.6 26.5 ± 8.4 29.5 ± 12.9 Group 0.62
12 KA-H 27.3 ± 10.5 25.6 ± 8.3 32.0 ± 12.0 Time 0.02
12 CrM 24.9 ± 7.9 23.8 ± 7.5 26.3 ± 7.8 G x T 0.70
ALT(U/L) 11 KA-L 21.5 ± 11.2 23.5 ± 14.2 28.7 ± 19.4 Group 0.50
12 KA-H 24.1 ± 15.6 22.3 ± 12.2 27.3 ± 9.1 Time 0.05
12 CrM 21.3 ± 7.34 18.0 ± 4.2 21.3 ± 5.5 G x T 0.48
Total Protein(g/dl) 11 KA-L 7.4 ± 0.6 7.4 ± 0.4 7.4 ± 0.4 Group 0.87
12 KA-H 7.3 ± 0.3 7.3 ± 0.3 7.3 ± 0.2 Time 0.88
12 CrM 7.3 ± 0.2 7.3 ± 0.2 7.4 ± 0.3 G x T 0.84
TBIL(mg/dl) 11 KA-L 0.84 ± 0.7 0.75 ± 0.3 0.76 ± 0.3 Group 0.60
12 KA-H 0.88 ± 0.5 0.89 ± 0.5 0.77 ± 0.4 Time 0.90
12 CrM 0.63 ± 0.2 0.71 ± 0.2 0.77 ± 0.2 G x T 0.26
Bone Mineral 11 KA-L 2,517 ± 404 2,503 ± 409 2,505 ± 398 Group 0.59
Content(g) 12 KA-H 2,632 ± 457 2,604 ± 466 2,615 ± 456 Time 0.49
12 CrM 2,446 ± 344 2,456 ± 0.2 2,441 ± 351 G x T 0.66
Albumin(g/dl) 11 KA-L 4.80 ± 0.3 4.81 ± 0.4 4.81 ± 0.2 Group 0.95
12 KA-H 4.83 ± 0.2 4.74 ± 0.2 4.78 ± 0.1 Time 0.73
12 CrM 4.82 ± 0.2 4.80 ± 364 4.79 ± 0.2 G x T 0.89
Globulin(g/dl) 11 KA-L 2.60 ± 0.4 2.63 ± 0.3 2.55 ± 0.3 Group 0.90
12 KA-H 2.56 ± 0.3 2.58 ± 0.2 2.52 ± 0.3 Time 0.85
12 CrM 2.55 ± 0.3 2.54 ± 0.2 2.62 ± 0.3 G x T 0.42
Alb:Glob Ratio 11 KA-L 1.88 ± 0.3 1.85 ± 0.2 1.90 ± 0.2 Group 0.98
12 KA-H 1.90 ± 0.1 1.86 ± 0.2 1.91 ± 0.1 Time 0.70
12 CrM 1.88 ± 0.2 1.90 ± 0.2 1.84 ± 0.2 G x T 0.45
Calcium(mg/dl) 11 KA-L 9.87 ± 0.5 9.85 ± 0.5 9.76 ± 0.4 Group 0.42
12 KA-H 9.83 ± 0.2 9.81 ± 0.4 9.84 ± 0.2 Time 0.51
12 CrM 9.77 ± 0.3 9.63 ± 0.4 9.67 ± 0.3 G x T 0.76
ALK(U/L) 11 KA-L 82.0 ± 16.4 84.1 ± 20.5 83.9 ± 17.0 Group 0.88
12 KA-H 81.1 ± 29.7 83.8 ± 30.3 87.1 ± 27.6 Time 0.29
12 CrM 78.9 ± 20.7 80.6 ± 26.4 78.8 ± 23.1 G x T 0.65
Table 12 Serum electrolyte status
Marker N Group Day p-level
0 7 28
Sodium(mmol/L) 11 KA-L 140.1 ± 2.3 139.9 ± 1.1 140.0 ± 1.3 Group 0.98
12 KA-H 139.9 ± 2.3 139.7 ± 2.4 140.3 ± 2.1 Time 0.28
12 CrM 140.8 ± 2.1 139.3 ± 1.4 139.7 ± 1.6 G x T 0.57
Potassium(mmol/L) 11 KA-L 4.54 ± 0.3 4.86 ± 0.4 4.82 ± 0.3 Group 0.65
12 KA-H 4.89 ± 0.5 4.71 ± 0.6 5.00 ± 0.3 Time 0.11
12 CrM 4.74 ± 0.4 4.93 ± 0.4 4.81 ± 0.4 G x T 0.08
Chloride(mmol/L) 11 KA-L 103.3 ± 2.2 103.0 ± 2.4 103.8 ± 1.9 Group 0.21
12 KA-H 102.4 ± 2.2 101.5 ± 2.2 102.6 ± 2.4 Time 0.008
12 CrM 104.3 ± 2.2 102.3 ± 1.7 103.1 ± 1.8 G x T 0.21
Values are means ± standard deviations. Data were analyzed by MANOVA with repeated measures. Greenhouse-Geisser time and group x time (G x T) interaction p-levels are reported with univariate group p-levels.
Table 13 Whole blood markers
Marker N Group Day p-level
0 7 28
WBC(x103/ul) 9 KA-L 5.73 ± 0.6 6.13 ± 0.5 6.17 ± 1.5 Group 0.95
12 KA-H 5.83 ± 1.1 5.76 ± 0.9 6.36 ± 1.1 Time 0.16
12 CrM 5.97 ± 1.2 5.73 ± 1.0 5.98 ± 1.2 G x T 0.45
RBC(x106/ul) 9 KA-L 5.44 ± 0.4 5.38 ± 0.5 5.44 ± 0.3 Group 0.28
12 KA-H 5.10 ± 0.4 5.18 ± 0.3 5.23 ± 0.3 Time 0.91
12 CrM 5.42 ± 0.5 5.41 ± 0.5 5.35 ± 0.7 G x T 0.64
Hematocrit(%) 9 KA-L 48.4 ± 3.4 47.9 ± 4.3 48.1 ± 2.9 Group 0.17
12 KA-H 46.5 ± 3.2 47.0 ± 2.8 47.4 ± 1.8 Time 0.96
12 CrM 45.9 ± 2.3 46.1 ± 2.5 45.2 ± 5.4 G x T 0.65
Hemoglobin(g/dl) 9 KA-L 16.0 ± 1.6 16.0 ± 1.6 16.0 ± 1.2 Group 0.21
12 KA-H 15.2 ± 1.2 15.7 ± 1.0 15.6 ± 0.7 Time 0.60
12 CrM 15.1 ± 0.9 15.2 ± 1.1 14.9 ± 2.0 G x T 0.62
MCV(fL) 9 KA-L 89.0 ± 2.8 88.9 ± 2.9 88.3 ± 2.8 Group 0.10
12 KA-H 91.1 ± 3.5 90.8 ± 3.1 90.7 ± 3.6 Time 0.03
12 CrM 85.4 ± 9.2 85.7 ± 9.5 85.0 ± 9.1 G x T 0.56
MCH(pg/cell) 9 KA-L 29.4 ± 1.5 29.6 ± 1.2 29.3 ± 1.2 Group 0.34
12 KA-H 29.8 ± 1.6 30.2 ± 1.5 28.4 ± 4.9 Time 0.20
12 CrM 28.1 ± 3.5 28.3 ± 3.7 27.9 ± 3.3 G x T 0.44
MCHC(g/dl) 9 KA-L 33.0 ± 1.3 33.3 ± 0.9 33.2 ± 0.9 Group 0.73
12 KA-H 32.8 ± 0.9 33.3 ± 0.8 32.9 ± 0.6 Time 0.22
12 CrM 32.9 ± 1.1 32.9 ± 1.3 32.9 ± 0.8 G x T 0.68
RBCDW(%) 9 KA-L 13.0 ± 0.5 13.0 ± 0.9 12.9 ± 0.7 Group 0.34
12 KA-H 13.8 ± 1.1 13.7 ± 1.0 13.5 ± 1.5 Time 0.41
12 CrM 13.7 ± 1.4 13.7 ± 1.7 13.6 ± 1.6 G x T 0.92
Platelet Count(x103/ul) 9 KA-L 266 ± 45 266 ± 52 280 ± 45 Group 0.12
12 KA-H 253 ± 54 248 ± 62 269 ± 65 Time 0.32
12 CrM 222 ± 69 222 ± 74 216 ± 65 G x T 0.48
increasing muscle creatine retention, body composition, strength, and/or anaerobic capacity than supplementing the diet with creatine monohydrate (20 g/d for 7-days and 5 g/d for 21-days). Additionally, the study was undertaken to determine whether supplementing the diet with recommended or equivalent creatine doses of a purported buffered form of creatine was associated with fewer side effects in comparison to creatine monohy-drate. Results of the present study clearly show that sup-plementing the diet with a purported buffered form of creatine is not a more efficacious and/or a safer form of creatine to consume than creatine monohydrate.
According to product claims [28,30], KA is“up to ten times more powerful than ordinary Creatine”. The ra-tionale for this contention is based on experiments reported in a patent [29] and/or on the manufacturer’s website [28,30] which indicates that KA has less conver-sion of creatine to creatinine in fluid over time com-pared to creatine monohydrate. This is despite the fact that studies show that creatine monohydrate is not sig-nificantly degraded to creatinine during the normal di-gestive process and nearly 99% of creatine monohydrate that is orally ingested is either taken up by tissue or excreted in the urine [1-3,18,21]. Because of this fact, an accepted method of assessing whole body creatine reten-tion has been to subtract daily urinary creatine excrereten-tion from daily dietary intake of creatine [32,33,45-47]. Add-itionally, while it is true that generally the lower the pH and higher the temperature, the greater conversion of creatine to creatinine, studies show that this process takes several days to occur at significant levels even when creatine is exposed to low pH environments [1,19,48]. As described in a recent review [1], the deg-radation of creatine can be reduced or even halted by ei-ther lowering the pH to under 2.5 or increasing the pH. A very high pH results in the deprotonation of the acid group, thereby slowing down the degradation process by making it more difficult for the intramolecular cyclization of creatine to creatinine. However, a very low pH (as is the case in the stomach) results in the proton-ation of the amide function of the creatine molecule, thereby preventing the intramolecular cyclization of cre-atine to creatinine [1]. This is the reason that the con-version of creatine to creatinine in the gastrointestinal tract has been reported to be minimal regardless of tran-sit time [7,18,20]. Thus, on the surface, the KA manufac-turer’s claims that creatine monohydrate is degraded to creatinine in large amounts after oral ingestion and that a “buffered” or “pH-correct” would significantly reduce this effect once consumed and thereby promote greater uptake of creatine in the muscle is inconsistent with available literature on creatine [1].
Results of the present study do not support claims that a large amount of creatine monohydrate was converted
to creatinine during the digestive process and thereby resulted in less of an increase in muscle creatine than KA. In this regard, while serum creatinine levels increased to a greater degree in the KA-H and CrM groups that ingested larger amounts of creatine, the 0.1 -0.2 mg/dL greater increase observed in creatinine com-pared to the KA-L group was well within normal limits (i.e., <1.28 ± 0.20 mg/dl) particularly for resistance-trained males. Therefore, this small change would be clinically insignificant. Additionally, a significant increase from baseline in serum creatinine was also observed in the KA-L and KA-H groups despite claims that KA completely prevents the conversion of creatine to cre-atinine. These findings do not support contentions that CrM is degraded to creatinine in large amounts or that KA is not converted to creatinine at all.
(KA-H 9.07 ± 23.2; CrM 22.3 ± 21.0 mmol/kg DW). Thus, results of the present study do not support claims that ingesting a purported buffered form of creatine is more effective in increasing muscle creatine content than creatine monohydrate.
While some may argue that since there is generally large variability in measuring muscle phosphagen levels and we were unable to obtain reliable PCr measure-ments, it is difficult to make a definitive conclusion about the effects of KA on muscle creatine content based on measuring muscle free content alone. However, present findings also provide no support for claims that KA supplementation is “up to ten times more powerful than ordinary Creatine.” In this regard, while time effects were observed in training adaptations, supple-menting the diet with KA (at recommended or creatine equivalent loading and maintenance doses) did not pro-mote statistically greater gains in fat free mass, 1 RM strength, or anaerobic sprint performance capacity com-pared to CrM. At best, one can conclude that ingesting recommended and creatine equivalent loading and maintenance amounts of KA resulted in similar training adaptations as creatine monohydrate supplementation at recommended loading and maintenance levels. However, results of the present investigation provide no evidence to support claims that KA is“the world’s most potent cre-atine”[28].
Further, results of the present investigation provided no evidence that KA is a safer form of creatine to con-sume at either lower recommended levels or higher cre-atine equivalent doses compared to normal loading and maintenance doses of creatine monohydrate. In this re-gard, there were no significant differences observed among groups in BIA determined total body water or serum electrolyte status. Likewise, no cramping or other side effects were reported. These findings are consistent with previous studies that have indicated that creatine supplementation does not promote dehydration and/or cramping [9,21-26]. There were also no significant dif-ferences observed among groups in serum lipids (TCHL, HDL, TCHL:HDL ratio, TRIG) or blood glucose. Serum LDL decreased slightly in response to creatine loading in the CrM group but returned to baseline after ingesting maintenance doses of CrM suggesting these changes were transient. Additionally, no significant differences were observed among groups in markers of catabolism (BUN, BUN:CRN, AST, ALT, Total Protein, TBIL), mar-kers of bone status (bone mineral content, ALB, GLOB, ALB:GLOB, calcium, ALK) or whole blood markers (WBC, RBC, Hematocrit, Hemoglobin, MCV, MCH, MCHC, RBCDW, platelet counts). Moreover, values remained within normal levels for active individuals. These findings are consistent with other studies that have examined the safety of creatine supplementation in
active individuals [1,3,21,26,27,38]. Consequently, present findings do not support claims that KA is a safer form of creatine to ingest than creatine monohydrate.
Conclusion
In summary, supplementation of the diet with recom-mended doses of a purported buffered form of creatine (1.5 g/d) for 28-days or equivalent loading (20 g/d for 7-days) and maintenance doses (5 g/d for 21-7-days) of CrM did not promote greater increases in muscle creatine content or training adaptations in comparison to creat-ine monohydrate (20 g/d for 7-days, 5 g/d for 21-days). Additionally, there was no evidence to support claims that the buffered form of creatine was associated with fewer side effects or was a safer form of creatine to con-sume than creatine monohydrate. While it could be argued that supplementing the diet with any form of creatine may provide some health and/or ergogenic ben-efits over time as long as it delivers sufficient amounts of creatine to increase muscle creatine content; present findings do not support claims that KA is a more effica-cious and/or safer form of creatine than creatine mono-hydrate. With this said, some limitations of this study should be noted. For example, this study did not have a control group and depended on participants to self-report side effects. Therefore, while the safety profile of short and long-term creatine monohydrate supplementa-tion has been well established, safety and efficacy could only be compared to ingesting different levels and forms of creatine and not controls. There is also variability in conducting muscle and blood assays as well as variability in conducting performance tests. In some instances, large mean differences among groups were either not statistically significant or only approached significance. It is possible that some of these differences would have been significant if a control group was included in the study design and/or more subjects were studied to in-crease statistical power. Nevertheless, results from the present study do not support claims that KA is a more efficacious and/or safer form of creatine to consume than creatine monohydrate.
Competing interests
AlzChem AG (Trostberg, Germany) provided funding for this study through a research grant to Texas A&M University. All researchers involved
Authors’contributions
ARJ served as the study coordinator, oversaw all testing, and assisted in data analysis and writing of the manuscript. JMO assisted in data collection and statistical analysis. AS assisted with data collection. EG assisted with data collection and reviewed and approved nutritional records as the studies’ registered dietitian. JF and SR supervised the biopsy procedures. MG assisted in experimental design, data analysis, and manuscript preparation. KK supervised muscle assays and CM served as a collaborating scientist. CR served as lab coordinator and oversaw data collection and quality control of the study. RBK served as Principal Investigator and contributed to the design of the study, statistical analysis, manuscript preparation, and procurement of external funding. All authors read and approved the final manuscript.
Funding
Supported by AlzChem AG, Germany.
Acknowledgements
We would like to thank the individuals who participated in this study as well as all of the students and administrative support staff at Texas A&M University that assisted in conducting this study. We would also like thank Dr. John Thaden for clinical chemistry technical support and Dr. J.P. Bramhall for providing medical supervision for this study.“All authors have approved manuscript for submission.”
Author details
1
Department of Health and Kinesiology, Exercise and Sport Nutrition Laboratory, Texas A&M University, College Station, TX 77843-4243, USA.
2
Department of Sports Medicine and Nutrition, Neuromuscular Research Laboratory, University of Pittsburgh, Pittsburgh, PA 15203, Oakland.
3
Department of Health and Kinesiology, Muscle Biology Laboratory, Texas A&M University, College Station, TX 77843-4243, USA.4Department of Health
and Kinesiology, Human Countermeasures Laboratory, Texas A&M University, College Station, TX 77843-4243, USA.5Department of Systems Biology and
Translational Medicine, Texas A&M Health Science Center, College Station, TX 77843-1114, USA.
Received: 3 August 2012 Accepted: 6 September 2012 Published: 13 September 2012
References
1. Jager R, Purpura M, Shao A, Inoue T, Kreider RB:Analysis of the efficacy, safety, and regulatory status of novel forms of creatine.Amino Acids
2011,40:1369–1383.
2. Kreider RB, Wilborn CD, Taylor L, Campbell B, Almada AL, Collins R, Cooke M, Earnest CP, Greenwood M, Kalman DS,et al:ISSN exercise & sport nutrition review: research & recommendations.J Int Soc Sports Nutr2010,
7:7.
3. Kreider RB, Jung YP:Creatine supplementation in exercise, sport, and medicine.Journal of Exercise Nutrition and Biochemistry2011,15:53–69. 4. Greenhaff P, Constantin-Teodosiu D, Casey A, Hultman E:The effect of oral
creatine supplementation on skeletal muscle ATP degradation during repeated bouts of maximal voluntary exercise in man.J Physiol1994,
476:84.
5. Greenhaff PL, Bodin K, Soderlund K, Hultman E:Effect of oral creatine supplementation on skeletal muscle phosphocreatine resynthesis.Am J Physiol1994,266:E725–E730.
6. Greenhaff PL, Casey A, Short AH, Harris R, Soderlund K, Hultman E:Influence of oral creatine supplementation of muscle torque during repeated bouts of maximal voluntary exercise in man.Clin Sci (Lond)1993,
84:565–571.
7. Harris RC, Soderlund K, Hultman E:Elevation of creatine in resting and exercised muscle of normal subjects by creatine supplementation.Clin Sci (Colch)1992,83:367–374.
8. Hultman E, Soderlund K, Timmons JA, Cederblad G, Greenhaff PL:Muscle creatine loading in men.J Appl Physiol1996,81:232–237.
9. Kreider RB, Ferreira M, Wilson M, Grindstaff P, Plisk S, Reinardy J, Cantler E, Almada AL:Effects of creatine supplementation on body composition, strength, and sprint performance.Med Sci Sports Exerc1998,30:73–82. 10. Volek JS, Duncan ND, Mazzetti SA, Staron RS, Putukian M, Gomez AL,
Pearson DR, Fink WJ, Kraemer WJ:Performance and muscle fiber
adaptations to creatine supplementation and heavy resistance training. Med Sci Sports Exerc1999,31:1147–1156.
11. Braissant O, Henry H, Beard E, Uldry J:Creatine deficiency syndromes and the importance of creatine synthesis in the brain.Amino Acids2011,
40:1315–1324.
12. Candow DG:Sarcopenia: current theories and the potential beneficial effect of creatine application strategies.Biogerontology2011,12:273–281. 13. Gualano B, Roschel H, Lancha-Jr AH, Brightbill CE, Rawson ES:In sickness
and in health: the widespread application of creatine supplementation. Amino Acids2011,43:519–229.
14. Klopstock T, Elstner M, Bender A:Creatine in mouse models of neurodegeneration and aging.Amino Acids2011,40:1297–1303. 15. Rawson ES, Venezia AC:Use of creatine in the elderly and evidence for
effects on cognitive function in young and old.Amino Acids2011,
40:1349–1362.
16. Tarnopolsky MA:Creatine as a therapeutic strategy for myopathies. Amino Acids2011,40:1397–1407.
17. Wallimann T, Tokarska-Schlattner M, Schlattner U:The creatine kinase system and pleiotropic effects of creatine.Amino Acids2011,
40:1271–1296.
18. Deldicque L, Decombaz J, Zbinden Foncea H, Vuichoud J, Poortmans JR, Francaux M:Kinetics of creatine ingested as a food ingredient.Eur J Appl Physiol2008,102:133–143.
19. Ganguly S, Jayappa S, Dash AK:Evaluation of the stability of creatine in solution prepared from effervescent creatine formulations.AAPS PharmSciTech2003,4:E25.
20. Persky AM, Brazeau GA, Hochhaus G:Pharmacokinetics of the dietary supplement creatine.Clin Pharmacokinet2003,42:557–574. 21. Buford TW, Kreider RB, Stout JR, Greenwood M, Campbell B, Spano M,
Ziegenfuss T, Lopez H, Landis J, Antonio J:International Society of Sports Nutrition position stand: creatine supplementation and exercise.J Int Soc Sports Nutr2007,4:6.
22. Dalbo VJ, Roberts MD, Stout JR, Kerksick CM:Putting to rest the myth of creatine supplementation leading to muscle cramps and dehydration.Br J Sports Med2008,42:567–573.
23. Greenwood M, Greenwood L, Kreider R, Stahura K:Creatine
supplementation does not increase perceptions of fatigue or adversely affect health status during three a day training.J Athletic Train2002,
37:S82.
24. Greenwood M, Kreider RB, Greenwood L, Byars A:Cramping and Injury Incidence in Collegiate Football Players Are Reduced by Creatine Supplementation.J Athl Train2003,38:216–219.
25. Greenwood M, Kreider RB, Melton C, Rasmussen C, Lancaster S, Cantler E, Milnor P, Almada A:Creatine supplementation during college football training does not increase the incidence of cramping or injury.Mol Cell Biochem2003,244:83–88.
26. Kreider RB, Melton C, Rasmussen C, Greenwood M, Lancaster S, Cantler E, Milnor P, Almada A:Long-term creatine supplementation does not significantly affect clinical markers of health in athletes.Mol Cell Biochem
2003,244:95–104.
27. Kim HJ, Kim CK, Carpentier A, Poortmans JR:Studies on the safety of creatine supplementation.Amino Acids2011,40:1409–1418. 28. All American EFX:Kre-Alkalyn - The World’s Most Potent Creatine. http://
krealkalyn.com/.
29. Golini JM:Oral creatine supplement and method for making same. US: 6,399,661 B1; Issue date, June 4, 2002.
30. All American Pharmaceutical:Kre-Alkalyn Research Booklet. http://krealkalyn. com/images/downloads/kre-alkalyn_research_booklet.pdf.
31. Tallon MJ, Child R:Kre-alkalynWsupplementation has no beneficial effect on creatine-to-creatinine conversion rates. Las Vegas, NV: International Society of Sports Nutrition Annual Conference; 2007.
32. Greenwood M, Kreider R, Earnest C, Rasmussen C, Almada A:Differences in creatine retention among three nutritional formulations of oral creatine supplements.Journal of Exercise Physiology: Online2003,6:37–43. 33. Greenwood M, Kreider RB, Rasmussen C, Almada AL, Earnest CP:D-Pinitol augments whole body creatine retention in man.J Exerc Physiol Online
2001,4:41–47.
34. Grindstaff PD, Kreider R, Bishop R, Wilson M, Wood L, Alexander C, Almada A:Effects of creatine supplementation on repetitive sprint performance and body composition in competitive swimmers.Int J Sport Nutr1997,
35. Kerksick CM, Rasmussen C, Lancaster S, Starks M, Smith P, Melton C, Greenwood M, Almada A, Kreider R:Impact of differing protein sources and a creatine containing nutritional formula after 12 weeks of resistance training.Nutrition2007,23:647–656.
36. Kreider R, Willoughby DS, Greenwood M, Parise G, Payne D, Tarnopolsky M:
Effects of serum creatine supplementation on muscle creatine content. Journal of Exercise Physiology: online2003,6:24–33.
37. Kreider RB, Klesges B, Harmon K, Grindstaff P, Ramsey L, Bullen D, Wood L, Li Y, Almada A:Effects of ingesting supplements designed to promote lean tissue accretion on body composition during resistance training.Int J Sport Nutr1996,6:234–246.
38. Kreider RB, Klesges RC, Lotz D, Davis M, Cantler E, Harmon-Clayton K, Dudley R, Grindstaff P, Ramsey L, Bullen D,et al:Effects of nutritional supplementation during off-season college football training on body composition and strength.Journal of Exercise Physiology Online1999,
2:24–39.
39. Spillane M, Schoch R, Cooke M, Harvey T, Greenwood M, Kreider R, Willoughby DS:The effects of creatine ethyl ester supplementation combined with heavy resistance training on body composition, muscle performance, and serum and muscle creatine levels.J Int Soc Sports Nutr
2009,6:6.
40. Lohman M, Tallroth K, Kettunen JA, Marttinen MT:Reproducibility of dual-energy x-ray absorptiometry total and regional body composition measurements using different scanning positions and definitions of regions.Metabolism2009,58:1663–1668.
41. Almada A, Kreider R, Ransom J, Rasmussen C, Tutko R, Milnor P:
Comparison of the reliability of repeated whole body DEXA scans to repeated spine and hip scans.J Bone Miner Res1999,14:SA243. 42. Evans WJ, Phinney SD, Young VR:Suction applied to a muscle biopsy
maximizes sample size.Med Sci Sports Exerc1982,14:101–102.
43. Harris RC, Hultman E, Nordesjo LO:Glycogen, glycolytic intermediates and high-energy phosphates determined in biopsy samples of musculus quadriceps femoris of man at rest. Methods and variance of values. Scand J Clin Lab Invest1974,33:109–120.
44. Kerksick CM, Wilborn CD, Campbell BI, Roberts MD, Rasmussen CJ, Greenwood M, Kreider RB:Early-phase adaptations to a split-body, linear periodization resistance training program in college-aged and middle-aged men.J Strength Cond Res2009,23:962–971.
45. Oopik V, Paasuke M, Timpmann S, Medijainen L, Ereline J, Gapejeva J:
Effects of creatine supplementation during recovery from rapid body mass reduction on metabolism and muscle performance capacity in well-trained wrestlers.J Sports Med Phys Fitness2002,42:330–339. 46. Steenge GR, Simpson EJ, Greenhaff PL:Protein- and carbohydrate-induced
augmentation of whole body creatine retention in humans.J Appl Physiol
2000,89:1165–1171.
47. Kerksick CM, Wilborn CD, Campbell WI, Harvey TM, Marcello BM, Roberts MD, Parker AG, Byars AG, Greenwood LD, Almada AL,et al:The effects of creatine monohydrate supplementation with and without D-pinitol on resistance training adaptations.J Strength Cond Res2009,23:2673–2682. 48. Dash AK, Sawhney A:A simple LC method with UV detection for the
analysis of creatine and creatinine and its application to several creatine formulations.J Pharm Biomed Anal2002,29:939–945.
doi:10.1186/1550-2783-9-43
Cite this article as:Jagimet al.:A buffered form of creatine does not promote greater changes in muscle creatine content, body composition, or training adaptations than creatine monohydrate. Journal of the International Society of Sports Nutrition20129:43.
Submit your next manuscript to BioMed Central and take full advantage of:
• Convenient online submission
• Thorough peer review
• No space constraints or color figure charges
• Immediate publication on acceptance
• Inclusion in PubMed, CAS, Scopus and Google Scholar
• Research which is freely available for redistribution