94
DEVELOPMENT AND VALIDATION OF RP-HPLC METHOD FOR
SIMULTANEOUS ESTIMATION OF PYRIDOXAMINE
DIHYDROCHLORIDE AND ACETYL CYSTEINE IN TABLET
DOSAGE FORM
Bharathi D*, Saranya D, Sharmila S ,Varsha R, Nandhini P, P.Reddy Saranya
Department of Pharmaceutical Chemistry, Jaya College of Pharmacy, Thiruninravur, Chennai, Tamil Nadu 602024, India.
ABSTRACT
A simple, very selective, linear, precise and accurate RP-HPLC method was developed and validated as per ICH guidelines for assay of Pyridoxamine dihydrochloride and Acetyl cystenine in bulk and in tablet dosage forms. An isocratic elution at a flow rate of 1.0 ml/ min was employed on a C18 (phenomenon, cremini 250*4.6mm, 5 micron) column at room
temperature. The mobile phase consisted of potassium dihydrogen phosphate buffer and methanol in the ratio of 90:10 at pH 2.2 with ortho phosphoric acid. The detection wavelength was 210nm and 20µl of sample was injected. This method obeys Beer’s law and the correlation coefficient value was above 0.999. The method was successfully applied to commercial formulation of this combination and validated as per standard analytical procedures. The proposed method applicable for routine analysis of Pyridoxamine dihydrochloride and Acetyl cystenine in bulk and in tablet dosage forms.
Keywords: Pyridoxamine dihydrochloride, Glycated proteins, Determination, Acetyl cystenine.
INTRODUCTION
Pyridoxamine dihydrochloride [1] is used for diabetic nephropathy which is approved by FDA. Pyridoxamine blocks the formation of Advanced Glycation End products (AGE) which is responsible for the diabetes. It traps the intermediates from glycated proteins. Acetyl cysteine acts as a mucolytic agent [2] which is official in the united states of pharmacopeia. Acetyl cysteine exhibits its action by breaking the disulfide linkages in the mucus to liquefy it. Together with the glutathione binds to the toxic metabolites to protect the liver from acetaminophen poisoning (NAPQI toxicity). There is no RP-HPLC method available for the determination of Pyridoxamine dihydrochloride and Acetyl cystenine in bulk and in tablet dosage forms. Fewer method available for Acetyl cysteine [3], combination of Acetyl cystenine with other drugs [4, 5] and few HPLC method also available for Pyridoxine dihydrochloride [6, 7]. The aim of the present work was to develop and validate a simple and reliable isocratic RP-HPLC method
determination of Pyridoxamine dihydrochloride and Acetyl cystenine in bulk and in tablet dosage forms. The method validated as per ICH guidelines [8, 9].
EXPERIMENTAL MATERIALS
The Reference standards namely pyridoxamine dihydrochloride and acetyl cysteine were kindly provided as gift sample by fourrts (India) laboratories private limited Chennai. A placebo for the validation study was prepared with its declared excipients. All the chemicals used were of HPLC grade.
Equipments
The chromatographic system used to develop this technique, is a HPLC –Agilent 1100 series with chemstation featuring a column oven, a quaternary pump, an automatic injector and PDA detector.
Chromatographic Conditions
Corresponding Author: - Bharathi D Email: [email protected]
International Journal of
Medicinal Chemistry & Analysis
www.ijmca.com
e ISSN 2249 - 7587
95
Chromatographic separation of pyridoxamine dihydrochloride and its related substance was performed using C18 (phenomenon, cremini 250*4.6mm, 5 micron)
made of stainless steel. The mobile phase consists of potassium dihydrogen phosphate buffer and methanol in the ratio of 90:10 at pH 2.2 with ortho phosphoric acid. The mobile phase filtered through a 0.45µm membrane filter and pumped through the column at the flow rate of 1.0ml/min. The injection volume to carry out the chromatography was set at 20µl. The wavelength was fixed at 210nm.
RP-HPLC METHOD VALIDATION Solutions
Mixed standard solution was prepared by dissolving 150mg of acetyl cysteine and 25mg of pyridoxamine dihydrochloride into a 100ml volumetric flask. Add 20ml of mobile phase dissolve and dilute to 100ml. Then dilute 2.5ml of above solution with mobile phase to 50ml.
Stock solution was prepared by mixing average weight of 20 tablets about 350mg into 100ml volumetric flask. Add 20ml of mobile phase and sonicate for 10 minutes and make up the volume to 50ml with mobile phase.
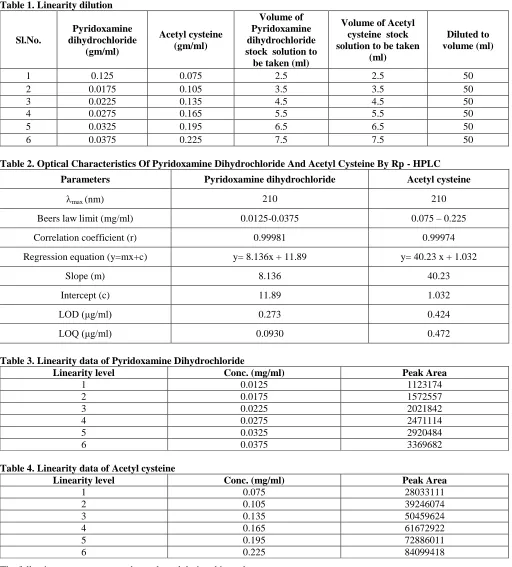
Linearity and Range
Linearity of method was checked using fine different concentrations 0.0125mg/ml to 0.0375mg/ml (Pyridoxamine dihydrochloride) and 0.075mg/ml to 0.225mg/ml (Acetyl cysteine).
Accuracy and Precision
The accuracy of the method was determined by recovery experiment. The recovery studies were carried out at five different levels of 50-150% and the average percentage recovery was observed.
The precision of the method was done by system precision and method precision. The percentage RSD value was found to be within the limit.
Robustness and Ruggedness
Robustness is checked by making slight deliberate change in the experimental procedure. It was determined by carrying out the analysis under the condition during which flow rate, composition ratio, pH was altered and the changes on RT values and peak areas were noted. The ruggedness was also noted.
RESULT AND DISCUSSION Selection of the detection wavelength
The overlain UVspectra of Pyridoxamine dihydrochloride and Acetyl cystenine in the mobile phase consists of potassium dihydrogen phosphate buffer and methanol in the ratio of 90:10 at pH 2.2 with ortho phosphoric acid, scanned in the region of 200 and 400nm,
and 210nm was selected as the detection wavelength.
Optimization of the chromatographic conditions
The selection of the mobile phase depends upon the nature of the sample, molecular weight and solubility of the drug. Among C8 and C18, C18 column was selected. The mobile phase consists of potassium dihydrogen phosphate buffer and methanol in the ratio of 90:10 at pH 2.2 with ortho phosphoric acid to give symmetric peaks with short run time. The optimized chromatogram shown in Figure 2.
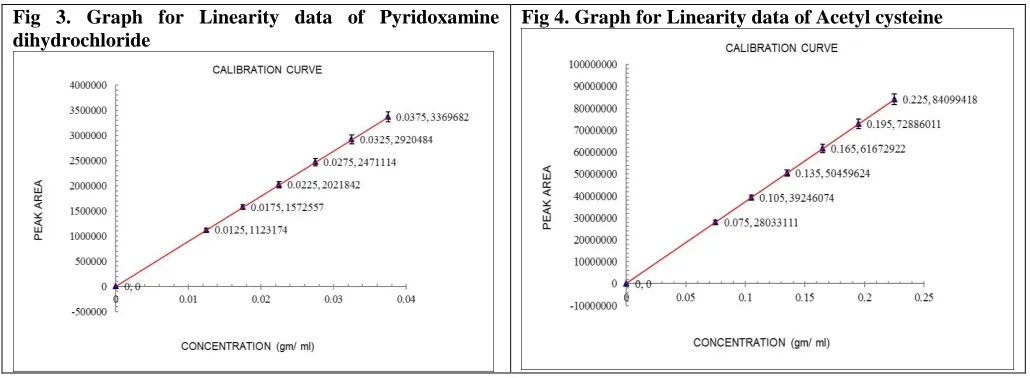
Validation ofmethods Linearity
Six serial dilution concentrations of the drug solutions used for calibration graphs, linear relationships between the ratios of peak area to that of drug concentration were observed, as shown by the results presented in Table 1 - 4. The standard deviations of the slope and intercept values were low. The determination coefficient (r2) exceeded 0.999. The linearity graph were shown in figure 3 – 4.
System suitability
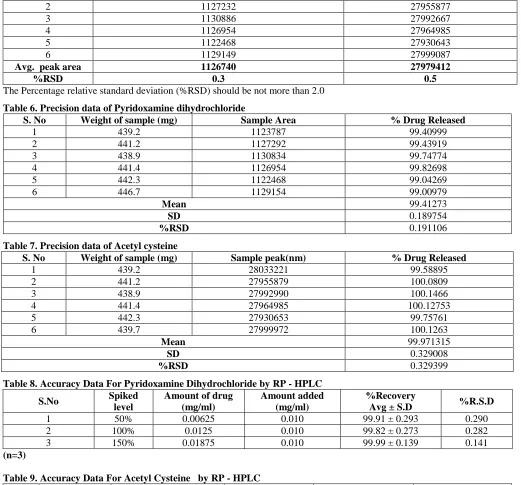
The resolution factor between pyridoxamine dihydrochloride and acetyl cysteine, in the method, was above 2. The system suitability parameters were shown in table 5.
Precision
The repeatability study (n=6) carried out showed in table 6 & 7. The percentage RSD values less than 2 for the peak area ratio of Pyridoxamine dihydrochloride and Acetyl cystenine obtained, thus the results showing that the equipment used for the work. For the intermediate precision a study carried out by the same analyst working on 3 consecutive days (n = 3) indicated a R.S.D. of 0.1911 and 0.329399, and indicated a good method precision.
Accuracy
The accuracy were expressed in terms of percentage recoveries of Pyridoxamine dihydrochloride and Acetyl cystenine. The results were shown in table 8 & 9. The recoveries of Pyridoxamine dihydrochloride and Acetyl cystenine were within the range of 99.82 – 99.99% and 98.41 – 99.94%.
Ruggedness and Robustness
96
Table 1. Linearity dilutionSl.No.
Pyridoxamine dihydrochloride
(gm/ml)
Acetyl cysteine (gm/ml)
Volume of Pyridoxamine dihydrochloride stock solution to
be taken (ml)
Volume of Acetyl cysteine stock solution to be taken
(ml)
Diluted to volume (ml)
1 0.125 0.075 2.5 2.5 50 2 0.0175 0.105 3.5 3.5 50 3 0.0225 0.135 4.5 4.5 50 4 0.0275 0.165 5.5 5.5 50 5 0.0325 0.195 6.5 6.5 50 6 0.0375 0.225 7.5 7.5 50
Table 2. Optical Characteristics Of Pyridoxamine Dihydrochloride And Acetyl Cysteine By Rp - HPLC
Parameters Pyridoxamine dihydrochloride Acetyl cysteine
max (nm) 210 210
Beers law limit (mg/ml) 0.0125-0.0375 0.075 – 0.225 Correlation coefficient (r) 0.99981 0.99974
Regression equation (y=mx+c) y= 8.136x + 11.89 y= 40.23 x + 1.032
Slope (m) 8.136 40.23
Intercept (c) 11.89 1.032 LOD (μg/ml) 0.273 0.424
LOQ (μg/ml) 0.0930 0.472
Table 3. Linearity data of Pyridoxamine Dihydrochloride
Linearity level Conc. (mg/ml) Peak Area
1 0.0125 1123174
2 0.0175 1572557
3 0.0225 2021842
4 0.0275 2471114
5 0.0325 2920484
6 0.0375 3369682
Table 4. Linearity data of Acetyl cysteine
Linearity level Conc. (mg/ml) Peak Area
1 0.075 28033111
2 0.105 39246074
3 0.135 50459624
4 0.165 61672922
5 0.195 72886011
6 0.225 84099418
The following parameters are to be evaluated during this study. (1) System suitability
97
System suitabilityPreparation of Standard solutions
Prepare and analyse standard solutions of Pyridoxamine dihydrochloride and Acetyl cysteine. Calculated the % RSD.
Table 5. System suitability Acceptance criteria
S. No Standard peak Area of Pyridoxamine dihydrochloride Standard peak Area of
Acetyl cysteine
1 1123755 28033210
2 1127232 27955877
3 1130886 27992667
4 1126954 27964985
5 1122468 27930643
6 1129149 27999087
Avg. peak area 1126740 27979412
%RSD 0.3 0.5
The Percentage relative standard deviation (%RSD) should be not more than 2.0
Table 6. Precision data of Pyridoxamine dihydrochloride
S. No Weight of sample (mg) Sample Area % Drug Released
1 439.2 1123787 99.40999 2 441.2 1127292 99.43919 3 438.9 1130834 99.74774 4 441.4 1126954 99.82698 5 442.3 1122468 99.04269 6 446.7 1129154 99.00979
Mean 99.41273
SD 0.189754
%RSD 0.191106
Table 7. Precision data of Acetyl cysteine
S. No Weight of sample (mg) Sample peak(nm) % Drug Released
1 439.2 28033221 99.58895 2 441.2 27955879 100.0809 3 438.9 27992990 100.1466 4 441.4 27964985 100.12753 5 442.3 27930653 99.75761 6 439.7 27999972 100.1263
Mean 99.971315
SD 0.329008
%RSD 0.329399
Table 8. Accuracy Data For Pyridoxamine Dihydrochloride by RP - HPLC
S.No Spiked
level
Amount of drug (mg/ml)
Amount added (mg/ml)
%Recovery
Avg ± S.D %R.S.D
1 50% 0.00625 0.010 99.91 ± 0.293 0.290 2 100% 0.0125 0.010 99.82 ± 0.273 0.282 3 150% 0.01875 0.010 99.99 ± 0.139 0.141
(n=3)
Table 9. Accuracy Data For Acetyl Cysteine by RP - HPLC
S.No Spiked level Amount of drug
(mg/ml)
Amount added (mg/ml)
%Recovery
Avg ± S.D %R.S.D
1 50% 0.0375 0.010 99.94 ± 0.180 0.192 2 100% 0.075 0.010 99.73 ± 0.285 0.292 3 150% 0.1125 0.010 98.41 ± 0.569 0.578
98
Table 10. Ruggedness of Pyridoxamine Dihydrochloride and Acetyl CysteineDrug Analyst 1 (area) Analyst 2 (area) SD %RSD (Limit NMT 2.0%)
Pyridoxamine dihydrochloride 1123792 1123784 0.792 0.091 Acetylcysteine 28033274 28033248 0.484 0.252
Table 11. Robustness ofPyridoxamine Dihydrochloride
S.No 1 2 3
Parameter Rt Area Tailing factor
Initial Escitalopram oxalate 2.610 1123781 1.7 Flow (-0.1ml/min) 2.712 1123854 1.69 Flow (+0.1ml/min) 2.492 1123689 1.83 wavelength(-2nm) 2.613 1123559 1.78 wavelength(+2nm) 2.622 1123872 1.78
S.D 0.153 0.0368
R.S.D 0.183 0.0242
Table 12. Robustness of Acetyl Cysteine
S.No 1 2 3
Parameter Rt Area Tailing factor
Initial clonazepam 9.24 28033221 1.785 Flow (-0.1ml/min) 10.58 28033472 1.348 Flow (+0.1ml/min) 8.16 28033119 1.543 wavelength(-2nm) 9.27 28033864 1.687 wavelength(+2nm) 9.33 28033784 1.147
S.D 0.283 0.0222
R.S.D 0.072 0.0184
Fig 1. Chemical structures of (a): Pyridoxamine dihydrochloride (b): Acetyl cystenine
99
Fig 3. Graph for Linearity data of Pyridoxaminedihydrochloride
Fig 4. Graph for Linearity data of Acetyl cysteine
CONCLUSION
The validated HPLC methods employed here proved to be simple, fact, reliable, selective and sensitive. Since none of the method is reported for simultaneous estimation of pyridoxamine dihydrochloride and acetyl cysteine from combined dosage form. These can be used for routine analysis of two components without prior separation. The proposed method for simultaneous estimation of pyridoxamine dihydrochloride and acetyl cysteine in combined dosage form was validated as per ICH guidelines.
ACKNOWLEDGEMENT
The authors are grateful to fourrts (India) laboratories pvt. Limited, Chennai for providing gift sample of Pyridoxamine dihydrochloride and Acetyl cysteine.
CONFLICT OF INTEREST
The authors declare that they have no conflict of interest.
REFERENCES
1. http.drugbank.com.
2. Goodman, Gilmann. The Pharmacological Basics of Therapeutics, 2007.
3. Shaikh S, Athawale R, Nadkar S, Phadtare P and Naik S. Development and Validation of RP-HPLC Method for the Estimation of N-Acetylcysteine in Wet Cough Syrup. International Journal of Drug Development & Research, 4(2), 2012, 284 -293.
4. Nalluri N and Syed IP. Development and Validation of a New RP-HPLC method for simultaneous estimation of N-Acetylcysteine and L – Arginine in Combined Dosage form. Oriental Journal of Chemistry, 30(3), 2014, 1371 -1378. 5. Ercal N, Oztezcan S, Hammond TC, Matthews RH, Spitz DR. High-performance liquid chromatography assay for
N-acetylcysteine in biological samples following derivatization with N-(1-pyrenyl)maleimide. Journal of Chromatogr B Biomed Appl, 685(2), 1996, 329-34.
6. Bogdan K, Danka O, Dobrina T. Validation of HPLC method for determination of antioxidant Vitamin C and Vitamin B6 in food supplements and drugs. International Journal of Pharmacy and Pharmaceutical Sciences, 2(1), 2012, 300 -304. 7. Dhal SK and Sharma R. Development and Validation of RP-HPLC Method for Simultaneous Determination of
Pyridoxine Hydrochloride, Isoniazid, Pyrazinamide and Rifampicin in pharmaceutical Formulation. Chem. Anal., 54, 2009, 1487-1500.
8. ICH guideline. Q2 (R1) step 4, Validation of Analytical Procedures: Text and Methodology, 2005.