A prognostic scoring system for arm
exercise stress testing
Yan Xie,1Hong Xian,1,2Pooja Chandiramani,3Emily Bainter,4Leping Wan,2 Wade H Martin III5
To cite:Xie Y, Xian H, Chandiramani P,et al. A prognostic scoring system for arm exercise stress testing.Open Heart2016;3: e000333. doi:10.1136/ openhrt-2015-000333
Received 1 September 2015 Revised 29 October 2015 Accepted 3 December 2015
1From the Clinical Epidemiology Center of the St. Louis Veterans Administration Medical Center, College of Public Health and Social Justice, St. Louis University, St. Louis, Missouri, USA 2Department of Biostatistics, College of Public Health and Social Justice, St. Louis University, St. Louis, Missouri, USA 3Department of Epidemiology, College of Public Health and Social Justice, St. Louis University, St. Louis, Missouri, USA 4Department of Internal Medicine, Washington University School of Medicine, St. Louis, Missouri, USA 5Division of Cardiology, Department of Internal Medicine, St. Louis Veterans Administration Medical Center and Washington University School of Medicine, St. Louis, Missouri, USA Correspondence to Dr Wade H Martin III; [email protected]
ABSTRACT
Objective:Arm exercise stress testing may be an
equivalent or better predictor of mortality outcome than pharmacological stress imaging for the≥50% for patients unable to perform leg exercise. Thus, our objective was to develop an arm exercise ECG stress test scoring system, analogous to the Duke Treadmill Score, for predicting outcome in these individuals.
Methods:In this retrospective observational cohort
study, arm exercise ECG stress tests were performed in 443 consecutive veterans aged 64.1 (11.1) years. (mean (SD)) between 1997 and 2002. From multivariate Cox models, arm exercise scores were developed for prediction of 5-year and 12-year all-cause and cardiovascular mortality and 5-year cardiovascular mortality or myocardial infarction (MI).
Results:Arm exercise capacity in resting metabolic
equivalents (METs), 1 min heart rate recovery (HRR) and ST segment depression≥1 mm were the stress test variables independently associated with all-cause and cardiovascular mortality by step-wise Cox analysis (all p<0.01). A score based on the relation HRR (bpm) +7.3×METs−10.5×ST depression (0=no; 1=yes) prognosticated 5-year cardiovascular mortality with a C-statistic of 0.81 before and 0.88 after adjustment for significant demographic and clinical covariates. Arm exercise scores for the other outcome end points yielded C-statistic values of 0.77–0.79 before and 0.82–0.86 after adjustment for significant covariates versus 0.64–0.72 for best fit pharmacological myocardial perfusion imaging models in a cohort of 1730 veterans who were evaluated over the same time period.
Conclusions:Arm exercise scores, analogous to the
Duke Treadmill Score, have good power for prediction of mortality or MI in patients who cannot perform leg exercise.
INTRODUCTION
The Duke Treadmill Score has been well vali-dated and widely used for many years as a powerful prognostic marker in patients being
evaluated for coronary artery disease.1–3
However, in recent years at least 50% of patients referred for stress testing are unable
to perform adequate treadmill exercise
because of lower extremity or other disabil-ities and pharmacological evaluations are
employed as a surrogate form of stress,4 for
which the Duke Treadmill Score is not rele-vant. In addition, the Duke Treadmill Score does not include variables such as heart rate recovery that have been found to be highly
predictive of mortality.5 6 Although
pharma-cological stress tests may yield useful imaging results, they fail to provide powerful prognos-tic information on exercise capacity, symp-tomatic, physiological or ECG responses to the relevant physiological stress of exercise. We have demonstrated that arm exercise stress testing is at least equivalent and possibly a superior alternative to pharmacological
eva-luations7 in patients unable to perform leg
exercise and is predictive of all-cause and
car-diovascular mortality over 5 and 12 years7–9
and myocardial infarction (MI) at 5 years.10
However, a simple scoring system, analogous to the Duke Treadmill Score, is not currently available for arm exercise testing. Thus, the purpose of this investigation was to develop and report a simple scoring system for
pre-dicting outcome, defined in terms of 5-year
and 12-year all-cause mortality, 5-year and 12-year cardiovascular mortality, and 5-year cardiovascular mortality or MI for arm exer-cise ECG stress testing.
KEY QUESTIONS
What is already known about this subject?
▸ No scoring system exists for outcome prediction from arm exercise stress test results in the
≥50% of patients unable to perform leg exercise. What does this study add?
▸ We developed a scoring system, analogous to the Duke Treadmill Score, for arm exercise stress testing.
How might this impact on clinical practice?
▸ With this scoring system, 5-year and 12-year all-cause and cardiovascular mortality or myocardial infarction can be estimated from easily measured arm exercise stress test variables with compar-able accuracy to the Duke Treadmill Score in patients unable to perform leg exercise.
Xie Y, Xian H, Chandiramani P,et al.Open Heart2016;3:e000333. doi:10.1136/openhrt-2015-000333 1
Special populations
on September 13, 2020 by guest. Protected by copyright.
http://openheart.bmj.com/
METHODS
Patient characteristics and covariate information
The arm exercise scores were derived from a patient population of 443 consecutive individuals (434 men, 9 women) aged 64.1 (11.1) years (mean (SD)) who underwent arm ergometer exercise stress tests at the St. Louis Veterans Administration Medical Center (STL VAMC) from 1997 until 2002 and were described in an
earlier publication.7Veterans who were referred by their
VA healthcare providers, were unable to perform tread-mill or leg cycle ergometer exercise because of lower extremity or other disabilities, and who underwent arm exercise testing, were eligible for the study. Those having upper extremity disabilities or medical
contrain-dications to stress testing, identified in a brief history
and physical examination, were excluded. In <3% of tests, arm exercise testing was substituted for pharmaco-logical (dipyridamole) evaluations because of caffein-ated beverage ingestion and a long travel distance to St. Louis. Arm exercise studies were converted to pharmacological evaluations in <2% of participants because of inability to exercise for at least 1 min. Participants were instructed to fast overnight, withhold
β-adrenergic blocking agents, administer ½ of their
usual insulin dose, and take all other regular medica-tions. The study was approved by the Institutional Review Board of the STL VAMC. All patients provided voluntary written informed consent.
Arm exercise protocol
The stress test was conducted in the seated posture with a wall-mounted electronically braked arm cycle ergometer (Angio 2000; Lode BV, Groningen, the Netherlands) at a target cadence of 60 rpm to an end point of fatigue or symptom limitation as described
pre-viously.8 A progressive, multistage protocol designed to
elicit exhaustion or symptoms within 5–12 min was used
with constant work increments of 50–200 kpm,
equiva-lent to 8.2–32.7 W, every 2–3 min, depending on pretest
estimated exercise capacity.11 12 After a brief clinical
evaluation, a 12-lead ECG was recorded at baseline, every minute during and postexercise and continuously at peak effort. Blood pressure was obtained manually at
baseline and every 2–3 min during and postexercise.
Exercise capacity in METs (multiples of resting meta-bolic rate) was determined from the duration of effort at the peak exercise work rate using the standard relation-ship between oxygen uptake and cycle ergometer work rate, with 1 MET equivalent to 3.5 mL/kg/min and
exer-cise METs=((2×kpm)+300)/(weight (kg)×3.5)).8 13 Peak
heart rate and heart rate recovery 1 min postexercise were calculated from the ECG. One minute heart rate recovery in beats/min was determined as the difference between peak heart rate and the heart rate 1 min
postex-ercise.5Standard criteria were used for interpretation of
the exercise ECG with an abnormal tracing defined as
≥1 mm of ST segment depression, measured 80 ms after
the J-point.11
Outcome events
Occurrence and date of death and MI, probable cause of death, demographic, and clinical characteristics of participants, medications prescribed, and coronary revas-cularisation procedures were ascertained by review of VA electronic medical records preceding and following stress testing until 5 November 2012 (10th anniversary of the last participant stress test). This information was sup-plemented by examination of scanned reports of non-VA episodes of care, telephone interviews of next of kin,
and data from death certificates, the Missouri
Department of Health and Senior Services, Social Security Death Index and National Death Index.
Research staff were blinded to stress test findings at the
time of record review. The criteria for MI were elevated creatine kinase-MB or troponin above the 99th centile
in the context of typical ECG findings or symptoms.
Censoring was not performed after MI or coronary revascularisation.
Data analysis
Statistically significant differences between group means
were determined with t tests. χ2 Analyses were used to
examine associations of categorical variables with mortal-ity. Missing data were not imputed and analyses included
only existing values. Differences were considered signifi
-cant at p <0.05. Arm exercise variables identified in
uni-variate analyses to be predictive of 5-year and 12-year all-cause and cardiovascular mortality and 5-year cardio-vascular mortality or MI were incorporated into multi-variate Cox proportional hazards models. After removal
of non-significant variables from these models, scores to
predict outcomes were then developed using remaining arm exercise variables in the respective multivariate
models.1 2Complete arm exercise data were available in
331 participants and arm exercise scores were developed from this cohort. Weights were assigned to each inde-pendently predictive exercise variable, based on their
effect size coefficient for a given outcome model.1 2
Relationships of scores and significant demographic and
clinical variables with the various outcomes were also evaluated with univariate and multivariate Cox propor-tional hazards models. C-statistics were used to evaluate model discrimination of arm exercise scores before and
after adjustment for significant demographic and clinical
variables and to compare the predictive value of arm exercise scores with our recently published
pharmaco-logical MPI results.7Kaplan-Meier curves were generated
to compare rates of survival or MI among patient groups. Score cut points were selected to categorise patients into high and low-risk groups, based on sequen-tial step-wise comparisons of adjacent Kaplan-Meier curve deciles beginning with the worst and most favour-able outcome extremes, based on survival probability. The log rank test for survival analysis was employed to assess differences in Kaplan-Meier curve deciles. The logistic growth model with the smallest sum of squares was used to estimate relationships between arm exercise
Open Heart
on September 13, 2020 by guest. Protected by copyright.
scores and survival. All analyses were performed with
SAS V. 9.4.14
RESULTS Outcome events
There were 256 deaths (57.8%) over mean (SD) and median (IQR) follow-up intervals of 12.0 (1.3) and 11.5 (10.8, 13.1) years, respectively, for survivors and 8.2 (3.4) and 9.5 (4.3, 11.4) years, respectively, for the entire cohort. Of 252 participants for whom probable cause of death could be ascertained (98.4%), 102 were attributed to a cardiovascular aetiology (40.4%). During follow-up, 70 participants (15.8%) experienced MI, 39 underwent coronary artery bypass graft surgery (8.8%) and 78 had percutaneous coronary interventions (17.6%).
Patient characteristics
Demographic and clinical characteristics of this popula-tion and their univariate associapopula-tions with all-cause and cardiovascular mortality at 5 and 12 years are shown in table 1.
Resting ECG abnormalities that may preclude reliable interpretation of the stress ECG included left bundle
branch block (2.0%), ST segment abnormalities≥1 mm
(7.2%), and a ventricular paced rhythm (1.6%) but an abnormal resting ECG was not associated with mortality by multivariate analysis.
Similarly, although cardiovascular medications were prescribed for a high proportion of patients in this cohort, none were related to mortality after adjustment
for covariates. These medications included β adrenergic
blocking agents (40.6%), an ACE inhibitor, receptor blocker or hydralazine (52.8%), statin (36.6%), platelet antagonist (57.1%) and aldosterone antagonist (3.8%).
Arm exercise results
Arm exercise findings with univariate significance are
shown in table 1 above and multivariate analyses of
sig-nificant univariate arm exercise results reported intables
2 and 3 below. Arm exercise capacity in METs, 1 min
heart rate recovery and ST segment depression ≥1 mm
were the only exercise variables independently associated with death or MI by multivariate analysis. For arm exer-cise capacity, the multivariate inverse relationship with 12-year all-cause mortality, expressed per SD of METs, was HR 0.57, 95% CI 0.46 to 0.67; p<0.001 while the corre-sponding relationship with 12-year cardiovascular death was HR 0.51, 95% CI 0.38 to 0.68; p<0.001. For 1 min heart rate recovery, the multivariate inverse relationship with 12-year all-cause mortality, expressed per SD of heart rate recovery, was HR 0.66, 95% CI 0.55 to 0.79; p<0.001 and for 12-year cardiovascular death was HR 0.60, 95% CI 0.45 to 0.82;p<0.01. Arm exercise-induced ST segment
depression≥1 mm was directly associated with outcome
end points as shown intables 2and3.
Neither limiting nor non-limiting angina predicted death ( p>0.05 by multivariate analysis). Exercise-induced
ventricular dysrhythmias were related to mortality by univariate analysis ( p<0.01) but not after adjustment for covariates. Coronary revascularisation by either coronary artery bypass graft surgery or percutaneous coronary intervention was associated with lower mortality (HR 0.52, 95% CI 0.38 to 0.72; p<0.001). However, there was no interaction between coronary revascularisation and the inverse relationship of arm exercise capacity and heart rate recovery with death. Arm exercise-induced ST segment depression was predictive of coronary revascular-isation at 5 and 12 years (HR 2.29, 95% CI 1.25 to 4.19; p=0.007 and HR 2.42, 95% CI 1.55 to 3.77; p<0.001, respectively). Limiting angina also was associated with coronary revascularisation at 5 and 12 years (HR 7.12, 95% CI 2.14 to 23.7; p=0.001 and HR 4.75, 95% CI 1.46 to 15.42; p<0.001, respectively).
Although β-adrenergic blocking agents were withheld
on the morning of testing, their use was still associated with lower resting heart rate (70 (13) vs 78 (15) bpm),
peak heart rate (115 (23) vs 130 (20) bpm) andδ( peak
—resting) heart rate (45 (31) vs 52 (20) bpm) (all
p<0.01) but did not affect arm exercise capacity in METs, heart rate recovery or ST segment depression. In addition, multivariate Cox proportional hazards analyses
revealed no significant interaction between treatment
with β blockade and prediction of mortality with arm
exercise capacity in METs, 1 min heart rate recovery, and ST segment depression, the components of the arm exercise score.
Arm exercise scores
For arm exercise variables, data were available for the following number and percentage of participants: METs (n=440; 99.3%), peak heart rate (n=443; 100%), peak systolic blood pressure (n=433; 97.5%), 1 min heart rate recovery (n=340; 76.7%), angina (n=443; 100%), ven-tricular dysrhythmias (n=443; 100%) and an interpret-able ST segment response (n=427; 96.4%). Arm exercise scores were developed from complete data in 331 parti-cipants. Multivariate HRs and 95% CIs for arm exercise
scores and significant univariate demographic and
clin-ical associations with the respective outcomes in Cox
proportional hazards models are shown intable 4.
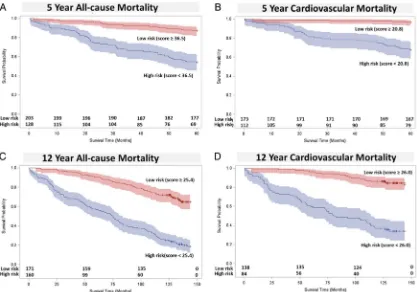
Infigure 1, Kaplan-Meier curves for high and low-risk groups, based on the displayed arm exercise score cut points, are depicted for 5-year all-cause death (A), 5-year cardiovascular death (B), 12-year all-cause death (C) and 12-year cardiovascular death (D). Arm exercise scores and C-statistic values for prediction of outcome
events before and after adjustment for significant
demo-graphic and clinical covariates are presented intable 5.
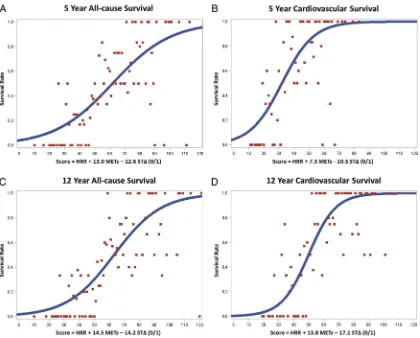
To permit estimation of survival rates of individual patients with a given arm exercise score, continuous rela-tionships between corresponding arm exercise scores and all-cause and cardiovascular survival over 5 and
12 years are shown in figure 2. For comparison with
pharmacological myocardial perfusion imaging (MPI) results obtained in a separate cohort of 1730 patients
Xie Y, Xian H, Chandiramani P,et al.Open Heart2016;3:e000333. doi:10.1136/openhrt-2015-000333 3
Special populations
on September 13, 2020 by guest. Protected by copyright.
http://openheart.bmj.com/
Table 1 Association of demographic, medication, resting vital sign and ECG variables, clinical diagnoses and arm exercise responses with all-cause and cardiovascular mortality over 5 and 12 years
Variable
Arm exercise stress test (N=443)
5-year 12-year Survivors (n=323, 72.9%) All-cause mortality (n=120, 27.1%) CV mortality (n=50, 11.3%) Survivors (n=187, 42.2%) All-cause mortality (n=256, 57.8%) CV mortality (n=102, 23.0%) Demographics
Age (years) (SD) 62.4 (10.6) 68.6 (10.9) p<0.001
68.3 (10.6) p<0.001
59.7 (9.9) 67.3 (10.7) p<0.001
65.9 (11.6) p<0.001 Height (inches) (SD) 69.7 (2.9) 69.4 (4.0)
p=0.36
68.5 (5.2) p=0.01
69.9 (2.7) 69.4 (3.6) p=0.17
69.1 (4.4) p=0.08 Weight (lbs) (SD) 218.1 (54.4) 196.3 (52.3)
p<0.001
191.8 (44.9) p=0.001
223.2 (53.0) 204.2 (54.6) p<0.001
205.6 (60.3) p=0.01 Body mass index (kg/m2) (SD) 31.5 (7.1) 28.7 (7.5)
p<0.001
29.1 (8.3) p=0.03
32.1 (7.1) 29.7 (7.3) p<0.001
30.3 (8.6) p=0.06 Race (black) (%) 79 (24.8) 33 (27.7)
p=0.54
10 (20.4) p=0.50
48 (26.2) 64 (25.2) p=0.81
24 (24) p=0.68 Gender (women) (%) 8 (2.5) 1 (0.8)
p=0.28
1 (2.0) p=0.84
5 (2.7) 4 (1.6) p=0.41
3 (2.9) p=0.89 Medications
β-blocker (%) 125 (38.7) 55 (45.8) p=0.17
30 (60.0) p=0.005
75 (40.1) 105 (41.0) p=0.85
47 (46.1) p=0.33 ACEI/ARB/hydralazine (%) 168 (52.0) 66 (55.0)
p=0.58
31 (62.0) p=0.19
91 (48.7) 143 (55.9) p=0.13
63 (61.8) p=0.03
Statin (%) 124 (38.4) 40 (33.3)
p=0.33
18 (36.0) p=0.75
74 (39.6) 90 (35.2) p=0.34
36 (35.3) p=0.47 Platelet antagonist (%) 190 (58.8) 63 (52.5)
p=0.23
28 (56.0) p=0.71
100 (53.5) 153 (59.8) p=0.19
60 (58.8) p=0.38 Aldosterone blocker (%) 13 (4.0) 4 (3.3)
p=0.74
0 (0.0) p=0.15
6 (3.2) 11 (4.3) p=0.56
1 (1.0) p=0.24 Resting vital signs
Heart rate (bpm) (SD) 74 (14) 78 (16) p=0.01
77 (17) p=0.13
74 (14) 76 (16) p=0.20
75 (15) p=0.55 Systolic BP (mm Hg) (SD) 136 (21) 132 (23)
p=0.07
132 (22) p=0.23
135 (20) 135 (22) p=0.80
135 (23) p=0.97 Diastolic BP (mm Hg) (SD) 83 (12) 78 (12)
p<0.001
79 (13) p=0.03
84 (12) 80 (13) p<0.001
80 (13) p=0.01 Resting ECG results
Abnormal (%) 122 (37.8) 60 (50.0)
p=0.02
27 (54.0) p=0.03
60 (32.1) 122 (47.7) p=0.001
48 (47.1) p=0.01 Clinical diagnoses
Hypertension (%) 243 (75.2) 96 (80.0) p=0.29
39 (78.0) p=0.67
Table 1 Continued
Variable
Arm exercise stress test (N=443)
5-year 12-year Survivors (n=323, 72.9%) All-cause mortality (n=120, 27.1%) CV mortality (n=50, 11.3%) Survivors (n=187, 42.2%) All-cause mortality (n=256, 57.8%) CV mortality (n=102, 23.0%)
Dyslipidaemia (%) 147 (45.5) 46 (38.3) p=0.18
21 (42.0) p=0.64
93 (49.7) 100 (39.1) p=0.03
42 (41.2) p=0.16 Current smoker (%) 100 (31.0) 44 (36.7)
p=0.25
20 (40.0) p=0.20
54 (28.9) 90 (35.2) p=0.16
39 (38.2) p=0.10 Past smoker (%) 120 (37.2) 43 (35.8)
p=0.80
17 (34.0) p=0.67
69 (36.9) 94 (36.7) p=0.97
33 (32.4) p=0.44
Diabetes (%) 111 (34.4) 50 (41.7)
p=0.16
20 (40.0) p=0.44
58 (31.0) 103 (40.3) p=0.05
39 (38.2) p=0.21
CAD (%) 126 (39.0) 56 (46.7)
p=0.15
29 (58.0) p=0.01
69 (36.9) 113 (44.1) p=0.13
51 (50.0) p=0.03 History of MI (%) 87 (26.9) 50 (41.7)
p=0.003
23 (46.0) p=0.006
49 (26.2) 88 (34.4) p=0.07
33 (32.4) p=0.27 History of CHF (%) 29 (9.0) 28 (23.3)
p<0.001
17 (34.0) p<0.001
11 (5.9) 46 (18.0) p<0.001
24 (23.5) p<0.001 Status post CABG (%) 53 (16.4) 29 (24.2)
p=0.06
17 (34.0) p=0.003
27 (14.4) 55 (21.5) p=0.06
29 (28.4) p=0.004 Status post PCI (%) 43 (13.3) 16 (13.3)
p=1.00
11 (22.0) p=0.10
24 (12.8) 35 (13.7) p=0.80
20 (19.6) p=0.13 Atrial fibrillation (%) 15 (4.5) 27 (22.5)
p<0.001
14 (28.0) p<0.001
8 (4.3) 34 (13.3) p=0.001
16 (15.7) p<0.001
PAD (%) 75 (23.2) 55 (45.8)
p<0.001
27 (54.0) p<0.001
33 (17.7) 97 (37.9) p<0.001
44 (43.1) p<0.001
COPD (%) 54 (16.7) 48 (40.0)
p<0.001
20 (40.0) p<0.001
25 (13.4) 77 (30.1) p<0.001
30 (29.4) p<0.001 Renal disease (%) 19 (5.9) 18 (15.0)
p=0.002
8 (16.0) p=0.01
9 (4.8) 28 (10.9) p=0.02
10 (9.8) p=0.10
Cancer (%) 20 (6.2) 26 (21.7)
p<0.001
7 (14.0) p=0.04
5 (2.7) 41 (16.0) p<0.001
10 (9.8) p=0.009 Arm exercises responses
Peak values
Heart rate (bpm) (SD) 125 (21) 117 (25) p<0.001
115 (26) p=0.002
129 (20) 119 (23) p<0.001
117 (22) p<0.001 Systolic BP (mm Hg) (SD) 172 (28) 161 (33)
p<0.001
164 (34) p=0.08
172 (28) 166 (31) p=0.05
168 (31) p=0.29 Diastolic BP (mm Hg) (SD) 94 (15) 90 (17)
p=0.01
91 (17) p=0.28
95 (15) 91 (16) p=0.02
92 (16) p=0.24 δValues (Peak–Rest)
Heart rate (bpm) (SD) 52 (19) 39 (20) p<0.001
38 (19) p<0.001
56 (19) 43 (20) p<0.001 42 (18) p<0.001 Continued Xie Y , Xian H, Chandir amani P , et al . Open Heart 2016; 3 :e000333. doi:10.1136/ openhrt-2015 -000333 5 Speci a l popula tions
Table 1 Continued
Variable
Arm exercise stress test (N=443)
5-year 12-year
Survivors (n=323, 72.9%)
All-cause mortality (n=120, 27.1%)
CV mortality (n=50, 11.3%)
Survivors (n=187, 42.2%)
All-cause mortality (n=256, 57.8%)
CV mortality (n=102, 23.0%)
Systolic BP (mm Hg) (SD) 36 (24) 29 (23) p=0.008
32 (20) p=0.31
37 (23) 32 (24) p=0.03
34 (22) p=0.22 Diastolic BP (mm Hg) (SD) 11 (12) 12 (12)
p=0.64
13 (11) p=0.54
11 (14) 12 (11) p=0.45
13 (12) p=0.38 Heart rate recovery (bpm)
1 min post (SD) 19 (10) 11 (8)
p<0.001
10 (7) p<0.001
20 (9) 14 (9)
p<0.001
14 (9) p<0.001 Exercise capacity (METs) 3.3 (0.9) 2.6 (0.8)
p<0.001
2.6 (0.8) p<0.001
3.5 (0.9) 2.8 (0.9) p<0.001
2.8 (0.9) p<0.001 Angina
Limiting (%) 7 (2) 2 (2)
p=0.74
2 (4) p=0.43
3 (2) 6 (2)
p=0.59
2 (2) p=0.82
Non-limiting (%) 17 (6) 11 (10)
p=0.25
8 (16) p=0.03
9 (5) 19 (8)
p=0.59
11 (11) p=0.17 ST depression≥1 mm (%) 39 (13) 23 (20)
p=0.05
12 (26) p=0.02
19 (10) 43 (18) p=0.03
21 (21) p=0.01 Ventricular dysrhythmias (%) 26 (8) 17 (14)
p=0.05
11 (22) p=0.002
8 (4) 35 (14)
p=0.001
16 (16) p<0.001 Data shown are means (SD) or n (%).
Statistically significant differences are designated in bold.
ACEI, ACE inhibitor; ARB, angiotensin receptor blocker; BP, blood pressure; CABG, coronary artery bypass grafting; CAD, coronary artery disease; CHF, congestive heart failure; COPD, chronic obstructive pulmonary disease; CV, cardiovascular; METs, resting metabolic equivalents; MI, myocardial infarction; PAD, peripheral arterial disease; PCI, percutaneous coronary intervention.
Xie
Y
,
Xian
H,
Chandir
amani
P
,
et
al
.
Open
Heart
2016;
3
:e000333
.
doi:10.113
6/openhrt-20
15-000333
Op
en
H
e
ar
Table 2 Multivariate HRs and 95% CIs for significant arm exercise variables by univariate analysis
5-year all-cause
mortality 5-year CV mortality
5-year CV mortality or MI
12-year all-cause
mortality 12-year CV mortality
Peak heart rate (bpm) 1.00 (0.99 to 1.02) 1.00 (0.98 to 1.02) 1.00 (0.98 to 1.02) 1.00 (0.99 to 1.01) 1.00 (0.98 to 1.01) Peak systolic blood pressure (mm Hg) 0.99 (0.97 to 1.00) 1.00 (0.99 to 1.01)
Peak diastolic blood pressure (mm Hg) 1.01 (0.99 to 1.02) 0.99 (0.98 to 1.01)
δHeart rate (bpm) 1.01 (0.97 to 1.03) 0.99 (0.95 to 1.02) 1.00 (0.97 to 1.03) 1.00 (0.99 to 1.02) 0.99 (0.97 to 1.02) δSystolic blood pressure (mm Hg) 1.01 (0.99 to 1.02) 1.00 (0.99 to 1.01)
Heart rate recovery (bpm) 0.93*** (0.90 to 0.96) 0.92** (0.86 to 0.97) 0.93** (0.89 to 0.98) 0.96*** (0.94 to 0.98) 0.96* (0.92 to 1.00) Exercise capacity (METs) 0.44*** (0.30 to 0.65) 0.55* (0.32 to 0.95) 0.51** (0.32 to 0.81) 0.55*** (0.43 to 0.70) 0.55*** (0.38 to 0.79)
Non-limiting Angina 1.60 (0.34 to 7.51)
ST depression≥1 mm 1.85* (1.00 to 3.43) 2.59* (1.00 to 6.71) 3.07** (1.44 to 6.57) 1.70* (1.10 to 2.61) 2.48** (1.34 to 4.59) Ventricular dysrhythmias 2.08 (0.88 to 4.96) 1.90 (0.90 to 4.02) 1.47 (0.94 to 2.31) 1.38 (0.69 to 2.79) HRs for continuous variables indicate hazard change per single integer measurement unit.
Statistically significant differences are designated in bold. *p<0.05; **p<0.01; ***p<0.001 by multivariate analysis.
CV, cardiovascular; METs, resting metabolic equivalents; MI, myocardial infarction.
Table 3 Multivariate parameter estimates, HRs and 95% CIs for arm exercise variables based on step-wise Cox analysis
5-year all-cause mortality 5-year CV mortality 5-year CV mortality or MI
12-year all-cause
mortality 12-year CV mortality Parameter
estimate HR
Parameter estimate HR
Parameter estimate HR
Parameter estimate HR
Parameter estimate HR
Heart rate recovery (bpm)
−0.06 0.94*** (0.91 to 0.97)
−0.10 0.90*** (0.86 to 0.95)
−0.08 0.93*** (0.89 to 0.96)
−0.04 0.96*** (0.94 to 0.98)
−0.05 0.95** (0.92 to 0.98) Exercise capacity
(METs)
−0.78 0.46 *** (0.33 to 0.63)
−0.75 0.47** (0.29 to 0.77)
−0.73 0.48*** (0.32 to 0.73)
−0.63 0.54*** (0.44 to 0.65)
−0.72 0.49*** (0.36 to 0.67) ST depression≥1 mm 0.76 2.14**
(1.22 to 3.78)
1.07 2.92** (1.33 to 6.41)
1.22 3.38*** (1.70 to 6.70)
0.61 1.85** (1.24 to 2.76)
0.90 2.46** (1.37 to 4.42) HRs for continuous variables indicate hazard change per single integer measurement unit.
*p<0.05; **p<0.01; ***p<0.001 by multivariate analysis.
CV, cardiovascular; METs, resting metabolic equivalents; MI, myocardial infarction.
Xie
Y
,
Xian
H,
Chandir
amani
P
,
et
al
.
Open
Heart
2016;
3
:e000333.
doi:10.1136/
openhrt-2015
-000333
7
Speci
a
l
popula
tions
Table 4 Multivariate HRs and 95% CIs for arm exercise scores and significant covariates by univariate analysis
Variable Outcome
5-year all-cause mortality 5-year CV mortality 5-year CV mortality or MI 12-year all-cause mortality 12-year CV mortality
Arm exercise score 0.96*** (0.94 to 0.98) 0.92*** (0.88 to 0.96) 0.95*** (0.92 to 0.97) 0.96*** (0.95 to 0.98) 0.96*** (0.94 to 0.98) Demographics
Age (years) 1.01 (0.99 to 1.04) 0.99 (0.96 to 1.03) 1.01 (0.98 to 1.04) 1.02 (1.00 to 1.03) 1.01 (0.99 to 1.04) Body mass index (kg/m2) 0.96* (0.92 to 0.99) 0.98 (0.93 to 1.04) 0.97** (0.95 to 0.99) 0.99 (0.96 to 1.02) Medications
β-blocker 0.92 (0.43 to 1.96)
ACEI/ARB/hydralazine 1.43 (0.87 to 2.34)
Resting vital signs
Heart rate (bpm) 1.02 (1.00 to 1.03)
Diastolic BP (mm Hg) 0.98* (0.96 to 1.00) 1.00 (0.97 to 1.03) 0.99* (0.97 to 1.00) 1.00 (0.98 to 1.02) Resting ECG results
Abnormal 1.03 (0.63 to 1.70) 0.54 (0.25 to 1.14) 0.73 (0.40 to 1.36) 1.18 (0.86 to 1.61) 0.93 (0.56 to 1.55) Clinical diagnoses
Dyslipidaemia 0.67** (0.49 to 0.90)
Diabetes 0.91 (0.66 to 1.26)
CAD 1.40 (0.57 to 3.46) 0.97 (0.53 to 1.77)
History of MI 1.29 (0.81 to 2.05) 1.24 (0.55 to 2.78) 1.46 (0.79 to 2.68)
History of CHF 1.17 (0.64 to 2.13) 1.61 (0.67 to 3.86) 1.96 (1.00 to 3.84) 1.43 (0.94 to 2.19) 1.63 (0.84 to 3.16)
Status post CABG 1.71 (0.71 to 4.10) 1.22 (0.61 to 2.43) 1.53 (0.81 to 2.89)
Atrial fibrillation 3.50*** (1.92 to 6.38) 6.83*** (2.77 to 16.88) 4.31*** (2.03 to 9.16) 2.09** (1.28 to 3.39) 3.27** (1.47 to 7.25) PAD 1.75* (1.07 to 2.84) 1.73 (0.75 to 3.94) 2.44** (1.29 to 4.61) 1.74** (1.24 to 2.43) 2.04** (1.19 to 3.47) COPD 1.19 (0.73 to 1.95) 1.06 (0.47 to 2.37) 1.12 (0.60 to 2.09) 1.26 (0.91 to 1.77) 1.41 (0.81 to 2.45) Renal disease 1.82 (0.87 to 3.81) 2.61 (0.98 to 6.94) 1.74 (0.75 to 4.05) 1.30 (0.75 to 2.24)
Cancer 2.41** (1.28 to 4.55) 1.64 (0.44 to 6.08) 2.17** (1.35 to 3.49) 1.07 (0.36 to 3.17) HRs for continuous variables indicate hazard change per single integer measurement unit.
Statistically significant differences are designated in bold. *p<0.05; **p<0.01; ***p<0.001 by multivariate survival analysis.
ACEI, ACE inhibitor; ARB, angiotensin receptor blocker; BP, blood pressure; CAD, coronary artery disease; CHF, congestive heart failure; CABG, coronary artery bypass grafting; COPD, chronic obstructive pulmonary disease; CV, cardiovascular; MI, myocardial infarction; PAD, peripheral arterial disease.
Xie
Y
,
Xian
H,
Chandir
amani
P
,
et
al
.
Open
Heart
2016;
3
:e000333
.
doi:10.113
6/openhrt-20
15-000333
Op
en
H
e
ar
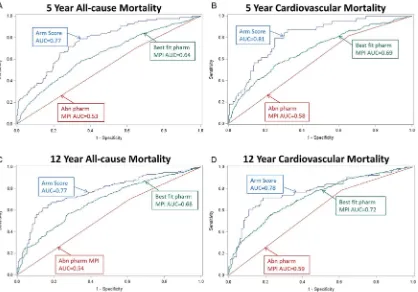
evaluated over the same 1997–2002 time interval,7 receiver operator curve plots of arm exercise scores, best
fit models of significant pharmacologic MPI study 5-year
and 12-year mortality predictors ( perfusion defect number, type, and size and the change in heart rate
from baseline to peak stress as described recently7), and
an abnormal versus normal pharmacological MPI result,
are depicted infigure 3.
DISCUSSION
For the ≥50% of patients unable to perform treadmill
or other leg exercise, we have developed a scoring system for prediction of all-cause and cardiovascular
mortality over 5 and 12 years and cardiovascular mortal-ity or MI over 5 years using easily obtainable information from arm exercise ECG stress testing. No other scoring system and few prognostic data are currently available for arm exercise testing. However, we have recently observed that arm exercise is an equivalent or superior alternative to pharmacological MPI for many patients
who are unable to perform lower extremity exercise.7As
illustrated in figure 3, this is further emphasised by the
higher area under the curve of C-statistic plots for pre-diction of mortality with arm exercise ECG stress test scores than for pharmacological MPI results. Arm exer-cise also provides important functional and physiological information on exercise capacity, heart rate recovery and Figure 1 Kaplan–Meier plots of 5 and 12-year all cause (A and C, respectively) and cardiovascular mortality (B and D,
respectively) with number of participants at risk and 95% CIs stratified by cut points into high and low-risk groups based on arm exercise scores.
Table 5 Arm exercise scores with C statistic values before and after adjustment for significant demographic and clinical predictors
Outcome Score equation
Area under the curve (AUC)* Unadjusted Adjusted†
5-year-all-cause mortality HRR+13.0×METs−12.6×STΔ(0/1) 0.77 0.86
5-year-CV mortality HRR+7.3×METs−10.5×STΔ(0/1) 0.81 0.88
5-year-CV mortality or MI HRR+9.4×METs−15.7×STΔ(0/1) 0.79 0.83
12-year-all-cause mortality HRR+14.5×METs−14.2×STΔ(0/1) 0.77 0.83
12-year-CV mortality HRR+13.8×METs−17.1×STΔ(0/1) 0.78 0.82
*C-statistic (AUC) based on a logistic model.
†Arm Exercise Score adjusted for significant demographic and clinical variables indicated intable 4.
AUC, area under the curve; CV, cardiovascular; HRR, heart rate recovery at 1 min postexercise; METs, resting metabolic equivalents; MI, myocardial infarction; ST, ST segment depression.
Xie Y, Xian H, Chandiramani P,et al.Open Heart2016;3:e000333. doi:10.1136/openhrt-2015-000333 9
Special populations
on September 13, 2020 by guest. Protected by copyright.
http://openheart.bmj.com/
clinical symptoms relevant to patient management deci-sions such as referral for cardiac catheterisation. This information is not available with pharmacological MPI or echocardiographic evaluations. Although arm and leg exercise ECG stress tests are less sensitive for detection
of cardiac ischaemia than MPI,7 10 11 we have
demon-strated a close relationship between an abnormal arm exercise ECG result and the size and reversibility of
per-fusion defects.10 15 Arm exercise ECG testing does not
require exposure to ionising radiation and is several times less expensive and time consuming for patients and staff than pharmacological imaging. Institutional resource and space requirements are also much less for arm exercise ECG testing than for treadmill or pharma-cological imaging evaluations.
We observed a C-statistic of 0.81 for prediction of car-diovascular mortality over 5 years with arm exercise, which is similar to C-statistic results of 0.85 and 0.75 in outpatients and inpatients, respectively, for
prognostica-tion of cardiovascular mortality over 4–5 years with the
Duke Treadmill Score.1 2 However, despite the ability of
arm exercise and Duke Treadmill Score C-statistics to dis-criminate outcome events, there are notable differences between our cohort and that from which the Duke
Treadmill Score was derived. Our cohort is comprised of a very high-risk veteran population with a 5-year cardio-vascular mortality of about 11% in comparison with the
3–4% 4-year cardiovascular mortality for outpatients and
8% mortality for inpatients in the Duke sample.1 2 The
high mortality of our population is typical of patients
unable to perform treadmill exercise.4 Our cohort
included inpatients and outpatients, was about 10–
15 years older, and was comprised of 98% men versus
67–70% men in the Duke database.1 2 The prevalence
of peripheral arterial disease, congestive heart failure
and atrial fibrillation in our population was 29%, 13%,
and 10%, respectively, all of which were associated with worsened cardiovascular mortality. The greater relative prognostic value of clinical predictors in our population versus the cohort used to derive the Duke Treadmill
Score2may reflect the much higher outcome event rate
in our group. However, functional assessment and esti-mation of prognosis in these high-risk patients is likely to be easier with arm exercise scores than with more complex models of clinical variables, despite their com-parable C-statistic values.
In contrast to the Duke Treadmill Score, which
strati-fied patients into high, low and intermediate-risk
Figure 2 The continuous curvilinear relationship between arm exercise scores and 5-year and 12-year all-cause (A and C, respectively) and cardiovascular survival (B and D, respectively) with associated scatter plots. HRR, heart rate recovery at 1-min postexercise; METs, arm exercise capacity in resting metabolic equivalents; STΔ, ST segment depression either <1 mm (0) or
≥1 mm (1).
Open Heart
on September 13, 2020 by guest. Protected by copyright.
groups,2 best fit statistical models of our arm exercise
cohort identified only very high and relatively low-risk
groups. The difference in 5-year cardiovascular mortality between the higher and lower risk groups in our cohort
(29% vs 3%) was similar to the Duke sample over 4–
5 years (28% vs 1–2%).2However, we did not identify an
intermediate risk group, which comprised about half of
the Duke sample,2and the proportion of patients in the
high-risk group of our cohort was much greater than in
the Duke cohort (39% vs 8%).2This difference is likely
related to the very high-risk nature of our population, which experienced a 5-year all-cause mortality rate of 23%. Rates of all-cause and cardiovascular survival in our cohort may be estimated over a continuum of arm exercise scores based on curvilinear relationships shown infigure 2.
Our arm ergometer score and the Duke Treadmill Score are comprised of three test variables that include exercise capacity and stress-induced ST segment
depres-sion data.2 However, there are other important
differ-ences in the individual components. First, the Duke Treadmill Score does not include heart rate recovery, which is an element of our arm exercise score, but was not found to be strongly associated with mortality until
several years after publication of the Duke results.2 5
Second, we did not observe an association of angina,
either limiting or non-limiting, with cardiovascular
mor-tality, whereas this finding is a component of the Duke
Treadmill Score.2One explanation for this is that unlike
the Duke investigators, we did not censor our results for coronary revascularisation, which has become much
more common than during the 1969–1990 era when the
Duke data were obtained.1 2We have previously observed
that arm exercise-induced angina was strongly associated
with subsequent coronary revascularisation,9 which also
predicted lower mortality in our population, possibly mitigating the effect of angina as a prognosticator of
death. Thus, our data reflect actual clinical practice
out-comes rather than the natural history of coronary artery disease. In addition, certain classes of medications such as statins and platelet antagonists, which also improve cardiovascular mortality, were not widely prescribed
before 1990, and might influence the natural history of
patients with angina. However, there was no association of medications with mortality in our cohort. Finally, in
contrast to the Duke Treadmill Score,2 we did not
observe a relationship between the magnitude of arm exercise-induced ST segment depression and subsequent
cardiovascular mortality. This difference could be
explained by our smaller sample size or by the effects of subsequent coronary revascularisation and/or medical treatment on cardiovascular mortality of patients with a Figure 3 Receiver operator curve plots for prognostication of 5-year and 12-year all-cause (A and C, respectively) and
cardiovascular mortality (B and D, respectively) with arm exercise scores (Arm Score AUC), best fit model pharmacological myocardial perfusion imaging (MPI) study predictors ( perfusion defect number, type and size and the change in heart rate from rest to peak stress;7Best fit pharm MPI AUC), and an abnormal versus normal pharmacological MPI result (Abn pharm MPI AUC), for 1730 pharmacological evaluations performed during the same 1997–2002 time interval. AUC, area under the curve.
Xie Y, Xian H, Chandiramani P,et al.Open Heart2016;3:e000333. doi:10.1136/openhrt-2015-000333 11
Special populations
on September 13, 2020 by guest. Protected by copyright.
http://openheart.bmj.com/
marked arm exercise-induced ST segment depression as noted above for individuals with stress-induced angina. In this context, we have also observed an association between arm exercise-induced ST-segment depression
and coronary revascularisation.9
Arm exercise capacity in METs and heart rate recovery exhibited robust inverse relationships with cardiovascular, non-cardiovascular and all-cause mortality after adjust-ment for covariates and there was no interaction of these effects with coronary revascularisation. These results are
similar tofindings with treadmill or leg cycle ergometer
testing, for which several investigators have reported powerful inverse relationships between exercise capacity and/or heart rate recovery and long term all-cause and
cardiovascular mortality in lower risk populations.5 12 16–
18 Our arm exercise score and pharmacological MPI
results are also consistent with other studies demonstrat-ing that leg exercise capacity is a better predictor of
mor-tality than stress nuclear perfusion imaging results.18 19
There are important differences in cardiovascular responses to arm and leg exercise, however. In young healthy participants, peak oxygen uptake with arm
exer-cise averaged 56% of treadmill maximal oxygen uptake.8
Peak heart rate was 5–8% lower for arm versus leg work
whereas systolic blood pressure is greater for arm
exer-cise.8 20 Thus, the rate-pressure product and cardiac
work requirement are comparable for the two exercise modalities, despite the lower peak oxygen uptake during arm exercise.
Since our study was initiated in 1997, new imaging modalities such as coronary CT angiography have
emerged21 and the number of patients unable to
perform treadmill exercise continues to increase.4These
new imaging modalities provide potentially useful infor-mation but, similar to MPI stress testing, require
expos-ure to ionising radiation,21 22 contribute to rapidly
increasing healthcare costs,23 and fail to provide
prog-nostic and functional information on exercise capacity, symptomatic, cardiovascular and ECG responses to the relevant physiological stress of exercise. Nephrotoxicity also is a potential limitation of coronary CT angiography. Arm exercise ECG stress testing is a potential solution to these problems for many patients unable to perform leg exercise.
Major limitations of this arm exercise scoring system are that it is based on retrospective data and was devel-oped in a high-risk cohort of veterans, possibly
introdu-cing selection bias. Definitive confirmation of this
approach will require a randomised prospective clinical trial of arm exercise versus pharmacologic stress testing, which is being planned. Generalisability of these equa-tions to younger, healthier populaequa-tions or to women is uncertain and also will require further investigation. Arm exercise is not feasible for patients with upper extremity disabilities and ECG testing alone may not be adequate for patients with left bundle branch block or other ECG abnormalities that interfere with accurate interpretation of the stress ECG.
In conclusion, we have developed a simple arm exer-cise ECG scoring system for prediction of 5-year and 12-year all-cause and cardiovascular mortality and 5-year cardiovascular mortality or MI. These arm exercise scores have comparable accuracy to the Duke Treadmill Score, are at least equivalent to pharmacological MPI for this purpose, and are the only data available for patients who cannot perform leg exercise. Thus, greater clinical use of arm exercise ECG stress testing in this population is a potentially equivalent or superior alternative to non-selective pharmacological imaging for cost-effective clinical decision making without radiation exposure.
Contributors WM designed and supervised the study and data collection, obtained grant funding, wrote the manuscript and is responsible for its overall content. PC and EB performed data extraction, analysis, and interpretation, and assisted with manuscript preparation. YX, HX and LW were responsible for statistical analyses, tables and graphs, provided intellectual contributions, and assisted with manuscript preparation.
Funding HX, PC, and WHM and EB are supported by a Merit Review research award from the Department of Veterans Affairs, Washington DC.
Competing interests None declared.
Ethics approval St. Louis Veterans Administration Institutional Review Board. Provenance and peer review Not commissioned; externally peer reviewed. Data sharing statement All data that are currently available from this study have either been published or are contained in the submitted manuscript. Open Access This is an Open Access article distributed in accordance with the Creative Commons Attribution Non Commercial (CC BY-NC 4.0) license, which permits others to distribute, remix, adapt, build upon this work non-commercially, and license their derivative works on different terms, provided the original work is properly cited and the use is non-commercial. See: http:// creativecommons.org/licenses/by-nc/4.0/
REFERENCES
1. Mark DB, Hlatky MA, Harrell FE Jr,et al. Exercise treadmill score for predicting prognosis in coronary artery disease.Ann Intern Med
1987;106:793–800.
2. Mark DB, Shaw L, Harrell FE Jr,et al. Prognostic value of a treadmill exercise score in outpatients with suspected coronary artery disease.N Eng J Med1991;325:849–53.
3. Nishime EO, Cole CR, Blackstone EH,et al. Heart rate recovery and treadmill exercise score as predictors of mortality in patients referred for exercise ECG.JAMA2000;284:1392–8.
4. Rozanski A, Gransar H, Hayes SW,et al. Temporal trends in the frequency of inducible myocardial ischemia during cardiac stress testing: 1991 to 2009.J Am Coll Cardiol2013;61:1054–65. 5. Cole CR, Blackstone EH, Pashkow FJ,et al. Heart rate recovery
immediately after exercise as a predictor of mortality.N Eng J Med
1999;341:1351–7.
6. Shetler K, Marcus R, Froelicher VF,et al. Heart rate recovery validation and methodologic issues.J Am Coll Cardiol
2001;38:1980–7.
7. Martin WH III, Xian H, Chandiramani P,et al. Cardiovascular mortality prediction in veterans with arm exercise vs pharmacologic myocardial perfusion imaging.Am Heart J2015;170:362–370e2. 8. Ilias NA, Xian H, Inman C,et al. Arm exercise testing predicts
clinical outcome.Am Heart J2009;157:69–76.
9. Martin WH III, Xian H, Wagner D,et al. Arm exercise as an alternative to pharmacologic stress testing: arm exercise stress testing and outcome.Am Heart J2014;167:169–77.
10. Chan AK, Ilias-Khan NA, Xian H,et al. Arm exercise stress perfusion imaging predicts clinical outcome.J Appl Physiol
2011;111:1546–53.
11. Chaitman BR. Exercise stress testing. In: Zipes DP, Libby P, Bonow RO,et al., eds.Braunwald’s heart disease: a textbook of
Open Heart
on September 13, 2020 by guest. Protected by copyright.
cardiovascular medicine. Vol 1. 7th edn. Philadelphia, PA: Elsevier Saunders, 2005:153–85.
12. Myers J, Prakash M, Froelicher V,et al. Exercise capacity and mortality among men referred for exercise testing.N Eng J Med
2002;346:793–801.
13. Astrand PO, Rodahl K.Textbook of work physiology. 3rd edn. New York: McGraw-Hill, 1986:365. Ch. 8.
14. SAS software. Version 9.4 of the SAS System for Windows; [last accessed 9/15/2014]; copyright 2014. SAS Institute, Inc. Cary, NC, USA.
15. Martin WH III, Xian H, Wagner DL,et al. Arm exercise myocardial perfusion imaging for prognostication of long-term outcome.Med Sci Sports Exerc2014;46:2216–23.
16. Blair SN, Kohl HW III, Paffenbarger RS Jr,et al. Physical fitness and all-cause mortality: a prospective study of healthy men and women.
JAMA1989;262:2395–401.
17. Jouven X, Empana JP, Schwartz PJ,et al. Heart rate profile during exercise as a predictor of sudden death.N Eng J Med
2005;352:1951–8.
18. Snader CF, Marwick TH, Pashkow FJ,et al. Importance of estimated functional capacity as a predictor of all-cause mortality among
patients referred for exercise thallium single-photon emission computed tomography: a report of 3400 patients from a single center.J Am Coll Cardiol1997;30:641–8.
19. Candell-Riera J, Ferreira-Gonzalez I, Marsal JR,et al. Usefulness of exercise test and myocardial perfusion-gated single photon emission computed tomography to improve prediction of major events.
Circ Cardiovasc Imaging2013;6:531–4.
20. Stenberg J, Astrand PO, Ekblom B,et al. Hemodynamic response to work with different muscle groups, sitting and supine.J Appl Physiol
1967;22:61–70.
21. Douglas PS, Hoffmann L, Patel MR,et al., for the PROMISE Investigators. Outcomes of anatomical versus functional testing for coronary artery disease.N Eng J Med2015;372: 1291–300.
22. Berrington de Gonzalez A, Kim KP, Smith-Bindman R,et al. Myocardial perfusion scans: projected population cancer risks from current levels of use in the United States.Circulation
2010;122:2403–10.
23. Fuchs VR, Milstein A. The $640 billion question—why does cost-effective care diffuse so slowly?N Eng J Med
2011;364:1985–7.
Xie Y, Xian H, Chandiramani P,et al.Open Heart2016;3:e000333. doi:10.1136/openhrt-2015-000333 13
Special populations
on September 13, 2020 by guest. Protected by copyright.
http://openheart.bmj.com/