E
EF
FF
FI
IC
CI
I
EN
E
NC
CY
Y
O
O
F
F
AU
A
UD
DU
U
&
&
A
AD
DE
EW
WA
AR
RA
A
(
(2
20
01
17
7)
)
T
TW
WO
O-
-P
PH
HA
AS
SE
E
F
FA
AC
CT
TO
O
R-
R
-T
TY
YP
PE
E
E
ES
ST
TI
IM
MA
AT
TO
OR
RS
S
W
WI
IT
TH
H
T
TW
WO
O
A
AU
UX
XI
IL
LI
IA
AR
RY
Y
V
VA
AR
RI
IA
AB
BL
LE
ES
S
I
IN
N
S
SA
AM
MP
PL
LE
E
S
SU
UR
RV
VE
EY
Y
A
A
.
.
A
A
u
u
d
d
u
u
11,
,
A
A
.
.
A
A
.
.
A
A
d
d
e
e
w
w
a
a
r
r
a
a
221
Department of Mathematics, Usmanu Danfodiyo University, P.M.B. 2346, Sokoto, Nigeria
2
Department of Statistics, University of Ilorin, P.M.B 1515, Ilorin, Kwara State, Nigeria
Corresponding Author: Ahmed Audu, [email protected]
ABSTRACT: In this paper, efficiency of Audu & Adewara ([AA17]) two-phase factor-type estimators with two auxiliary variables for estimating finite population mean were examined using simulation. These estimators were obtained by incorporating some known functions of auxiliary variables X and Z in some existing factor-type estimators. Bias and Mean
square error (MSE) of these estimators, 1 d
FTAA
y
and 2 dFTAA
y were obtained using tailor’s series expansion. Audu & Adewara
([AA17]) revealed that although 1 d
FTAA
y and 2 d
FTAA
y , have minimum MSE and high PRE than all other related existing factor-type estimators considered using three life dataset but of these two, which is more efficient and most preferred. The
simulation results obtained in this study revealed that 2 d
FTAA
y is more efficient than 1 d
FTAA
y and hence, most preferred.
KEYWORDS: Factor-type estimator, Two-phase sampling, Mean square error (MSE), Efficiency.
1. INTRODUCTION
It has been established that when the population mean
X
of auxiliary variablesX
is not known butX
is correlated to another auxiliary variable Z whose population meanZ
is known, then information on Z can be used to improved the efficiency of estimator at hand ([CS12]). In this study, information on secondary auxiliary variable were incorporated into the work of Shukla ([Shu02]) in addition to power transformation with sole aim of improving Shukla ([Shu02]) factor-type estimator.Shukla ([Shu02]) suggested a factor-type estimator for population mean under two-phase sampling as:
1 22
1 2
FTd
A C x
fBx
y
y
A
fB x
Cx
(1)
23 4
FTd I xy x y x
Bias y
YP
C C
C
(2)
21 3 2 4 2
FTd II x xy x y
Bias y
YP
C
C C
(3)
2 2 2 22 3
2
3FTd I y x xy x y
MSE y
Y
C
P C
P
C C
(4)
2 2 2 22 4
2
2FTd II y x xy x y
MSE y
Y
C
P C
P
C C
(5)Where:
1 2 3 4 1 2
1 2 2 1
1 1 1 1 1 1
, , ,
n N n N n n
1
2
A d d , B
d1
d4
, C
d2
d3
d4
,1 , 2 , 3 , 4
A C fB A fB C
A fB C A fB C A fB C A fB C
,
P
3
1
2
4
In his work, it was observed that factor-type estimator
y
FTd was more efficient than classical ratio estimator yrd , if 2Cyx P 0 under case I and if
1
2
C
yx1
P
0
under case II where
1 21.2. AUDU & ADEWARA ([AA17]) ESTIMATORS
Consider a preliminary large sample of size drawn from population Ω of size by SRSWOR and secondary sample of size drawn either of the following manners:
Case I: as a subset from the preliminary sample i.e. . Case II: as an independent sample from population i.e. .
Motivated by Choudhury and Singh ([CS12]) and Khan et. al ([KSS12]), Audu & Adewara ([AA17]) suggested the following estimators under two-phase sampling as:
1
1 1 2
2
1 2 1
d z z
FTAA
z z
A C x
fBx
a Z
b
y
y
A
fB x
Cx
a z
b
(6)
2
2 1 2 1
2
1 2 2
d z z
FTAA
z z
A C x
fBx
a z
b
y
y
A
fB x
Cx
a z
b
(7)where , , and are assumed to be known as either real numbers or (linear or non-linear) functions,
0
1
1
and0
2
1
3. PROPERTIES OF AUDU & ADEWARA ([AA17]) FACTOR-TYPE ESTIMATORS
(a). Under Case I ([AA17])
1
2
2 1
1
23 4 1 1
1 2
d
FTAA x xy x y z z z yz y z I
Bias y Y
PC
C C
C
C C
(8)
1
2 2
2
3 3 2 4 1 3 1
1 / 2
d
FTAA x x yx z z z xz
II
Bias y
Y
P
C
P C
C
C
PC
(9)
1
2 2 2
2
2 3
2
1 1 12
d
FTAA y x yx z z z yz
I
MSE y
Y
C
C P P
C
C
C
(10)and
1
2 2 2
2
2 2 2 3 3 1 1 2
d
FTAA y x yx z z z xz
II
MSE y Y
C C P
P C
P
C
PC (11)(b). Under Case II ([AA17])
2 2 2 2 2
2 1 3 4 3 2
2 2 2 2 2 2 2 2 2
2 1 2
1 1
2 2
d
FTAA yz z yx x x z yz z I
z z z z
Bias y Y PC C PC C PC C C
C C
(12)
2
2
2
2 2 2
2
2 2 22 1 2 2
1 1
2 2
d
FTAA z z z z z xz z
II
Bias y Y
C
C
P C C
and
2 2 2 2 2
2 2 1 2 2
2 2 2
2 2 2 1
2 2
2 2
d
FTAA y x yx z z z xz
II
z z z yz xz x
MSE y Y C C P P C C PC
C C PC P C
(15)
4. EFFICIENCY COMPARISON
2d
FTAA y
is said to be more efficient than
1d
FTAA
y
whenever:
(a). For case I:
1
2 2 2
2
2 2 2 3 3 1 1 2
d
FTAA y x yx z z z xz
II
MSE y Y
C C P
P C
P
C
PC <
1
2 2 2
2
2 3
2
1 1 12
d
FTAA y x yx z z z yz
I
MSE y
Y
C
C P P
C
C
C
and
(b). For case II:
2 2 2 2 2
2 2 1 2 2
2 2 2
2 2 2 1
2 2
2 2
d
FTAA y x yx z z z xz
II
z z z yz xz x
MSE y Y C C P P C C PC
C C PC P C
<
2
2 2 2
2
2 3
2
3 2 12
2
d
FTAA y x yx z z z yz xz
I
MSE y
Y
C
C P P
C
C
C
PC
5. EMPIRICAL STUDY USING SIMULATED DATA
In order to justify the results obtained in section three, a numerical simulation study is conducted to investigate the efficiency of these Audu & Adewara ([AA17]) factor-type estimators. The correlation coefficients between the study and auxiliary variables are assumed to be
xy 0.2,
xy 0.5,
xy 0.8 and
xy 0.99using multivariate normal with the following parameters:
200, 1.51, 2.02, 3.05, y 0.241, x 0.387, z 0.239
N Y X Z S S S
Table 1: Bias, MSE and PRE of when
xy
0.2
and
xy
0.5
EstimatorsBias MSE PRE Bias MSE PRE
CASE I
6.92X10⁻⁴ 10.75X10⁻⁴ 107.1 23.2X10⁻⁴ 5.41X10⁻⁴ 157.8
4.81X10
-4
10.02X10⁻⁴ 113.6 31.7X10⁻⁴ 4.87X10⁻⁴ 175.2
CASE II
21.2X10⁻⁴ 8.52X10⁻⁴ 133.7 13.9X10⁻⁴ 5.08X10⁻⁴ 168.1
16.1X10
-4
8.41X10⁻⁴ 135.3 17.2X10⁻⁴ 4.52X10⁻⁴ 188.9
1d
,
2d FTAA FTAAy
y
0.2
xy
xy
0.5
1d FTAA
y
2d FTAA
y
1d FTAA
y
2d FTAA
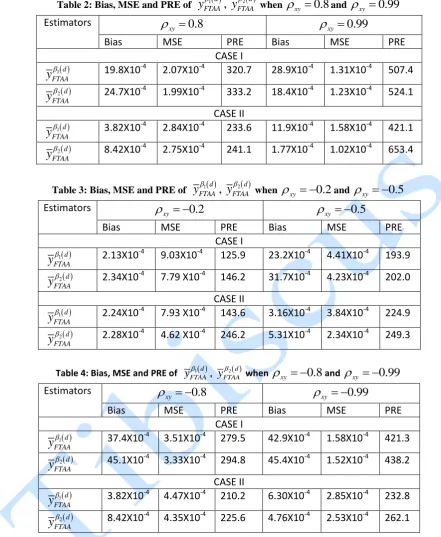
Table 2: Bias, MSE and PRE of when
xy
0.8
and
xy
0.99
Estimators
xy
0.99
Bias MSE PRE Bias MSE PRE
CASE I
19.8X10⁻⁴ 2.07X10⁻⁴ 320.7 28.9X10⁻⁴ 1.31X10⁻⁴ 507.4
24.7X10⁻⁴ 1.99X10⁻⁴ 333.2 18.4X10⁻⁴ 1.23X10⁻⁴ 524.1 CASE II
3.82X10⁻⁴ 2.84X10⁻⁴ 233.6 11.9X10⁻⁴ 1.58X10⁻⁴ 421.1
8.42X10
-4
2.75X10⁻⁴ 241.1 1.77X10⁻⁴ 1.02X10⁻⁴ 653.4
Table 3: Bias, MSE and PRE of when and
Estimators
xy
0.2
xy
0.5
Bias MSE PRE Bias MSE PRE
CASE I
2.13X10⁻⁴ 9.03X10⁻⁴ 125.9 23.2X10⁻⁴ 4.41X10⁻⁴ 193.9
2.34X10⁻⁴ 7.79 X10⁻⁴ 146.2 31.7X10⁻⁴ 4.23X10⁻⁴ 202.0 CASE II
2.24X10⁻⁴ 7.93 X10⁻⁴ 143.6 3.16X10⁻⁴ 3.84X10⁻⁴ 224.9
2.28X10⁻⁴ 4.62 X10⁻⁴ 246.2 5.31X10⁻⁴ 2.34X10⁻⁴ 249.3
Table 4: Bias, MSE and PRE of when and
Estimators
xy
0.8
xy
0.99
Bias MSE PRE Bias MSE PRE
CASE I
37.4X10
-4
3.51X10⁻⁴ 279.5 42.9X10⁻⁴ 1.58X10⁻⁴ 421.3
45.1X10⁻⁴ 3.33X10⁻⁴ 294.8 45.4X10⁻⁴ 1.52X10⁻⁴ 438.2 CASE II
3.82X10⁻⁴ 4.47X10⁻⁴ 210.2 6.30X10⁻⁴ 2.85X10⁻⁴ 232.8
8.42X10⁻⁴ 4.35X10⁻⁴ 225.6 4.76X10⁻⁴ 2.53X10⁻⁴ 262.1
6. RESULTS AND DISCUSSION
Tables 1 - 4 show the biases, MSEs and PRE of 1 d
FTAA
y and 2 d
FTAA
y under simple random sampling scheme when the study and auxiliary variables are negatively and positively correlated with
0.2, 0.5, 0.8
xy xy xy
and
xy 0.99 coefficients respectively. These properties (Bias, MSEand PRE) were computed under cases I and II. The simulation results of the analysis revealed that 2 d
FTAA y have
minimum MSEs and high PRE and hence, more efficient and most preferred to 1 d
FTAA y .
1d
,
2d FTAA FTAAy
y
0.8
xy
1d FTAA
y
2 d FTAA
y
1d FTAA
y
2 d FTAA
y
1 2
,
d d
FTAA FTAA
y
y
xy
0.2
xy
0.5
1d FTAA
y
2 d FTAA
y
1d FTAA
y
2 d FTAA
y
1d , 2d FTAA FTAA
y y
xy
0.8
xy
0.99
1d FTAA
y
2 d FTAA
y
1d FTAA
y
2 d FTAA
REFERENCES
[AA17] Audu A., Adewara A. A. - Modified Factor-Type Estimators With Two Auxiliary Variable Under Two-Phase Sampling. Anale. Seria Informatica. XV(1), 63 -76, 2017.
[CS12] Choudhury S., Singh B. K. - Aclass of chain ratio-product type estimators with two auxiliary variables under double sampling scheme. Jour. of the Korean Stat. Soc. 41, 247-256, 2012.
[KSS12] Khan H., Shouket S., Sanaullah A. - Aclass of improved estimators for estimating population mean regarding partial information in double sampling. Global Journal of Science Frontier Research (Mathematics and Decision), 12(14), 32 – 44, 2012.