Author name / JHMTR 00 (2013) 000–000 33
33 1. Introduction
High affiliations of Industrial societies to energy resources, especially on fossil fuels and indiscriminate use of them, thereby reducing fossil fuel reserves and increased air pollution and scathe to the environment.[1] Hence, the use and investment of renewable energy have developed over the past that among them in the meantime, the application of solar energy has been allocated larger share respect to the other clean energies, due to its more accessibility and advances in PV technology in recent years.[2] So the solar photovoltaic energy has been extensively utilized in many usages and the maximum power point tracking control becomes a significant issue for PV systems.
Unfortunately, the maximum power constructed by the PV array changes with solar brilliance and cell temperature.[3] Frequently, when the maximum power output is accomplished, the efficiency can approximate
about 18%. For this reason, achieve a maximum of solar energy usage efficiency by approximating the maximum power point of PV panel, many investigators put forwards different optimal control algorithms, such as P&O method, maintaining climbing algorithm and so on.
Each of these methods has several certain advantages and disadvantages which lead to the usage limitation. For instance, perturb and observe (P&O) is extensively used in commercial products, or incremental conductance (In Cond) method, which is more impressive under speedily changing conditions as it uses the fact that the derivative of the power with respect to the voltage (dP/dV) at the MPP is zero. [2] However, when the PV systems are operated under partially shaded conditions, the characteristic of P–V curve shows multifold peaks. This results in these conventionalMPPT algorithms becoming trapped at a local maximum, bring forth a consequential energy loss of up to 70%.[4]
Click here, type the title of your paper, Capitalize first letter of each words
First Author
a, Second Author
b,*a
First affiliation, Address, City and Postcode, Country
b
Second affiliation, Address, City and Postcode, Country
Journal of Solar Energy Research 22 (2017) 33-39
Journal of Solar Energy Research (JSER)
Journal homepage: jser.ir
A B S T R A C T
Click here and insert your abstract text. Click here and insert your abstract text. Click here and insert your abstract text. Click here and insert your abstract text. Click here and insert your abstract text. Click here and insert your abstract text. Click here and insert your abstract text. Click here and insert your abstract text. Click here and insert your abstract text. Click here and insert your abstract text. Click here and insert your abstract text. Click here and insert your abstract text. Click here and insert your abstract text. Click here and insert your abstract text. Click here and insert your abstract text. Click here and insert your abstract text. Click here and insert your abstract text. Click here and insert your abstract text. Click here and insert your abstract text. Click here and insert your abstract text. Click here and insert your abstract text Click here and insert your abstract text Click here and insert your abstract text Click here and insert your abstract text Click here and insert your abstract text Click here and insert your abstract text Click here and insert your abst
© 2013Published by University of Tehran Press. All rights reserved.
ARTICLE INFO Received:
Received in revised form: Accepted:
Available online:
Keywords: Type 3-6 keywords here,
separated by semicolons ;
Tuning a PD-type Fuzzy Controller by Particle Swarm Optimization for Photovoltaic
Systems to Achieve Maximum Power Point Tracking
Imani
a,*,M., Delavari
a,H.
a
Faculty of Electrical Engineering, Hamedan University of Technology,Hamedan, Iran *E-Mail: [email protected]
Journal of Solar Energy Research (JSER)
Journal homepage: www.jser.ut.ac.ir
A B S T R A C T
In order to use photovoltaic cell effectively and improve its photoelectric conversion efficiency, the maximum power point of photovoltaic generation system should be tracked rapidly and stably. In this paper after comparison and analysis common methods used in controller of photovoltaic systems such as Fuzzy and P&O, proposed an approach combined from FLC and particle swarm optimization algorithm (PSO) as an appropriate method to achieve maximum power point tracking (MPPT). Indeed Fuzzy logic control can cope with photovoltaic system using heuristic knowledge rules, but tuning the control parameters is not straightforward. PSO performs an on-line haphazard global search for input and output scaling factors of a PD-type fuzzy controller. The objective function of the PSO algorithm has been defined to minimize slope of P-V curve. The simulation results in SIMULINK of MATLAB indicate that proposed method can effectively eliminate the power oscillation around MPP and raise stability and reach steady state of the system.
© 2017 Published by University of Tehran Press. All rights reserved.
ARTICLE INFO
Received: 20 April 2017 Received in revised form: 21 May 2017
Accepted: 10 June 2017
As compared with these straightforward search methods, computational intelligence based methods, including fuzzy logic (FL), artificial neural network (ANN), particle swarm optimization (PSO) and etc., propose important benefit advantages.[5]
These can consist: no necessity for knowledge of inner system parameters, decreased computational endeavor and a well-set solution for multivariable problems. However, for fuzzy logic methods, the fuzzy rule base, which is related to the experience of algorithm extenders, expressively impression the performance of MPPT. For ANN based methods, it is only appropriate for the system that can get adequate training data. The PSO based method is impressive for non-uniform weather conditions. However, its convergence obviously depends on the incipient place of the factors.[6]
In this paper, we have proposed the composition of PD- type fuzzy controller with PSO algorithm to specify the best parameters for MPPT. In fact, PSO performs an online haphazard global search for input and output scaling factors of a PD-type fuzzy controller and tuning the control parameters in the inputs of the fuzzy controller.[7]
2. Materials and Methods
2.1. The Characteristics of a PV Array
A single-stage PV system is used in this paper. The equivalent circuit of the considered for a model of a PV cell is shown in Figure 1. PV system inherently represents a nonlinear I-V and P-V characteristics which revolve with the radiant intensity and cell temperature.[8]
Solar arrays composed of solar cells that have been connected in series. From the solid- state physics point of view, the cell is basically a large area p-n diode with the junction positioned close to the top surface.[9]
Rs
Rp Id
I
V Ipv
Figure 1. Model of a PV cell
So a practical solar cell modeled by a current source in parallel with a diode and a shunt resistance (Rp) and a series resistance (Rs) that mathematically describes the I-V characteristic by Eq. (1):[10]
Where Ipv and I0 are the photovoltaic that generated by the incident light and saturation currents of the array and Vt =
NskT/q is the thermal voltage of the array with Ns cells connected in series, q is the electron charge [1.60217646*10−19 C], k is the Boltzmann constant [1.3806503*10−23 J/K], T [K] is the temperature of the p-n junction, and a is the diode ideality constant. Photovoltaic current is related to radiation levels and temperature alike in form the following Eq. (2) [11]:
Ipv=(Ipv,n+KI∆T)
Where Ipv,n is the photovoltaic current at 25 ° C and the level of irradiation 1000 W/m2, ΔT = T − Tn (being T and Tn the actual and nominal temperatures [K]), G is the irradiation
on the device surface, and Gn is the nominal irradiation. The diode saturation current Io and its dependence on the temperature is given by Eq.(3) [12]:
Io=Io,n( )exp[ ]
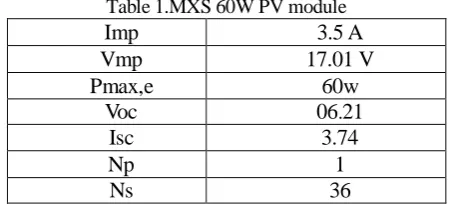
Where E is the bandgap energy of the semiconductor, whose value is 1.12eV for polycrystalline Si. The specifications of PV module used in this simulation are shown in Table1.
Table 1.MXS 60W PV module 3.5 A Imp
17.01 V Vmp
60w Pmax,e
06.21 Voc
3.74 Isc
1 Np
36 Ns
2.2. DC-DC Boost Converter
In this paper, we have proposed DC-DC boost converter. The boost converter is capable of producing a dc output voltage greater in magnitude than the dc input voltage. The circuit topology for a boost converter is as shown in Figure 3. Power for the boost converter can come from any suitable DC sources, such as batteries, solar panels, rectifiers and DC generators. By command of maximizing power controller to the MOSFET's gate in boost converter circuit, the working point of the array sets to the maximum power point.[13] The control strategy lies in the manipulation of the duty cycle of the switch which causes the voltage change. The control strategy lies in the attaint of the duty cycle of the switch which causes the voltage change. Regardless of losses in the converter, the relationship between the input and the output of the boost converter can be written into Eq. (5):
35 The calculated values of resistor, inductor, and capacitor that are used in the boost circuit shown in table 2.
Table 2.characteristic of boost converter 140 Ω R
24 uF C
11.4 uH L
L
C
R
Vo
Vi
Ii
Io
Figure 2. Boost converter
2.3. Conventional Methods A. Perturb and observe (P&O)
The P&O algorithm and hill-climbing are the same algorithm depending on how it is implemented. Hill-climbing consist of a perturbation on the duty cycle of the power converter and P&O a perturbation in the operating voltage of the DC link between the PV array and the power converter. The perturb and observe or hill-climbing MPPT algorithm is
Figure 3. Simulink model of Solar panel
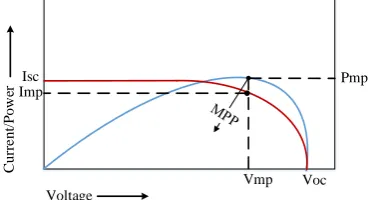
based on the fact that, on the voltage-power characteristics, variation of the power against voltage dP/dV > 0 on left of the MPP, while on the right, dP/dV<0 as shown in Figure 4.[14]
Pmp
Vmp Isc
Voc Voltage
Cur
re
nt
/P
ow
er Imp
Figure 4. Current/Power-Voltage characteristics
The operation of the HC and the P&O technique is explained by the flowcharts given in Figure 5 and Figure 6 respectively.
Inputs: Vin(k), Iin(k)
Pin = Vin * Iin
Pin(k) > Pin(k-1)
Vin(k) > Vin(k-1)
Vref(k) = Vref(k-1) + C Vref(k) = Vref(k-1) - C
Vin(k) > Vin(k-1)
Vref(k) = Vref(k-1) - C Vref(k) = Vref(k-1) + C
Yes NO
Yes
NO NO Yes
Figure 5. P&O method flow chart
Inputs: Vin(k), Iin(k)
Pin = Vin * Iin
Pin(k) > Pin(k-1)
Vin(k) > Vin(k-1)
D(k) = D(k-1) + δ D(k) = D(k-1) - δ
Vin(k) > Vin(k-1)
D(k) = D(k-1) - δ D(k) = D(k-1) + δ
Yes NO
Yes
NO NO Yes
Figure 6. HC method flow chart
P&O exhibitions a bad and slow behavior under quick variations environmental conditions. Variations in environmental conditions can change the operating point suddenly. P&O may realize those operational point variations as an output of its control action. This could cause it to move away from the MPP until weather conditions are changeless. Alongside this problem, when the MPP is attained, this algorithm oscillates around it as will be seen in the simulation results.[15], [16]
Simulation of P&O controller in MATLAB environment shown in Figure 7.
Figure 7. P&O controller in MATLAB/ Simulink
B. Fuzzy logic (FL)
Pmax
Voltage Power
(dp/dv > 0) (dp/dv < 0)
(dp/dv = 0)
Voltage Increase Voltage decrease
Figure 8. Power-voltage characteristic of a PV module
FLC has two inputs which are: error and the change in error, and one output feeding to the pulse width modulation (PWM) to control the DC-to-DC converter. The two FLC input variables error (E) and change of error (CE) at sampled times k defined by [17], [18]:
The input E (k) shows if the load operation point at the moment k is situated on the left or on the right of the maximum power point on the PV characteristic, while the input CE (k) represents the moving direction of this point. The fuzzy inference is executed by using Mamdani method, FLC for the Maximum power point tracker. FLC contains three basic parts: Fuzzification, Base rule, and Defuzzification.
1)
Fuzzification:
The membership functions for inputs E and CE and output D shown in Figures 9, 10 and 11 respectively.
-0.8 -0.6 -0.4 -0.2 0 0.2 0.4 0.6
0 0.2 0.4 0.6 0.8 1
Error
De
gr
ee
o
f m
em
be
rs
hi
p
NB NM NS ZE PS PM PB
Figure 9. Membership function for Error
-6 -4 -2 0 2 4 6
0 0.2 0.4 0.6 0.8 1
Changing Error
De
gr
ee
o
f m
em
be
rs
hi
p
NB NM NS ZE PS PM PB
Figure 10. Membership function for Change of Error
0 0.2 0.4 0.6 0.8 1
0 0.2 0.4 0.6 0.8 1
Duty Cycle
De
gr
ee
of
me
mb
ers
hip
NB NM NS ZE PS PM PB
Figure 11. Membership function for Duty Cycle
2)
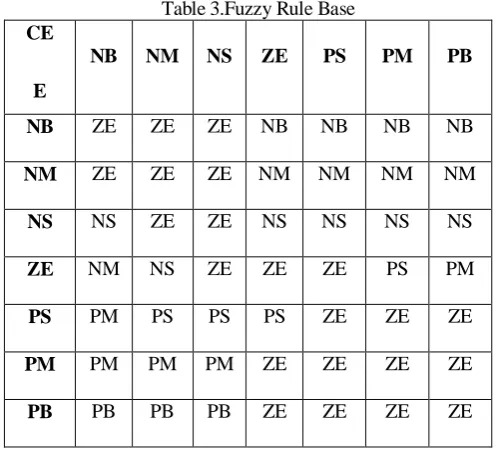
Base rule:
The control rules are appraised by an inference mechanism and represented as a set of:
IF Error is ... and Change of Error is ... THEN the output will ...
The linguistic variables used are: NB: Negative Big
NM: Negative Medium NS: Negative Small ZE: Zero
PS: Positive Small PM: Positive Medium PB: Positive Big
Table 3.Fuzzy Rule Base CE
E
NB NM NS ZE PS PM PB
NB ZE ZE ZE NB NB NB NB
NM ZE ZE ZE NM NM NM NM
NS NS ZE ZE NS NS NS NS
ZE NM NS ZE ZE ZE PS PM
PS PM PS PS PS ZE ZE ZE
PM PM PM PM ZE ZE ZE ZE
PB PB PB PB ZE ZE ZE ZE
3)
Defuzzification:
The defuzzification uses the center of gravity to compute the output of this FLC which is the duty cycle (D):
D =
2.4. Particle Swarm Optimization
37 velocity vector, Vi = [ ] and the position vector
Pi = [ ] where D abbreviation the dimensions of
the solution space. It performs a haphazard global search through a D-dimensional problem to optimize an objective function. The velocity and the position of each particle are initialized by random vectors within the corresponding ranges. For updating the velocity and position of particle i on dimension d, during the evolutionary process, the following equations are used.[7], [19]
[t+1]= w* [t]+C1*
[t]*( [t]- [t])
+ C2 * * (gbestd
[t]-[t])
[t+1]= [t]+ [t]
Where w is momentum or inertia weight constant, C1 and C2 are social and cognitive for the local best and global best positions accelerations, [t] and [t] are random numbers in the interval (0,1) for the d the dimension. In equation (9), is the position with the best fitness found heretofore i the particle, and gbestd is the best fitness position in the neighborhood.
Here, Sum of squared errors (ei) as an objective function is proposed for MPPT problem-solving.
F =
Where is the arbitrary coefficient.
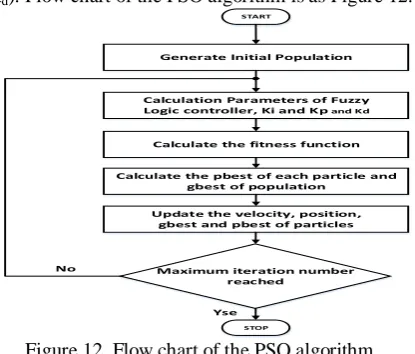
Particles are defined as the triad of scaling factor values (Ki,
Kp, Kd). Flow chart of the PSO algorithm is as Figure 12.
START
Generate Initial Population
Calculation Parameters of Fuzzy
Logic controller, Ki and Kp and Kd
Calculate the fitness function
Calculate the pbest of each particle and gbest of population
Update the velocity, position, gbest and pbest of particles
Maximum iteration number reached
STOP
Yse No
Figure 12. Flow chart of the PSO algorithm
2.5. Tuning a PD-Type Fuzzy Controller by PSO
In this paper proposed an approach combined from FLC and particle swarm optimization algorithm (PSO) as an appropriate method to achieve maximum power point tracking (MPPT). Indeed Fuzzy logic control can cope with the photovoltaic system using heuristic knowledge rules, but tuning the control parameters is not straightforward. PSO performs an on-line haphazard global search for input and output scaling factors of a PD-type fuzzy controller.[7] The objective function of the PSO algorithm has been defined to minimize slope of the P-V curve. In Figure 13, is illustrated adjusting the inputs of the Fuzzy controller by PSO optimization algorithm for generating appropriate duty cycle
as the input of PWM generator to produce a proper pulse to apply into the boost converter.
PWM
PSO
Figure 13. Block diagram for the PSO-Fuzzy control system
3. Results and Discussion
All simulations and results were taken in MATLAB 2014 environment. Related components of a solar panel system include the boost converter and MPPT controller, can be revealed at MATLAB Simulink environment as Figure. 14 According to the proposed method, PSO-Fuzzy, Initial values considered in the PSO algorithm are summarized in the following Table and initial values of other parts of PV system are in accordance that has been said in the previous sections.
Figure 14. Schematic overview of the solar system components in Simulink of MATLAB
Table 4. PSO parameters
Swarm size Size = 20
Maximum number of iterations Max (iteration) =
35
Dimension of the problem Dim = 3
Cognitive acceleration C1 = 1.2
Social acceleration C2 = 2.4
Inertial weight W = 1
scaling factor 1 Ki = 0.04
scaling factor 2 Kp = 0.04
scaling factor 3 Kd = 1.253
Assuming absence of a tracker on the panel, power outputs of PSO-fuzzy, fuzzy and P&O controllers’ action under radiations 1000, 800, 600, 400 and 200 kilowatts per meter square, are compared in Figure 15 in the duration of 0.1 seconds.
0 0.01 0.02 0.03 0.04 0.05 0.06 0.07 0.08 0.09 0.1 0
10 20 30 40 50 60
Time (seconds)
P
o
w
er
(
W
)
Output Power
Fuzzy-PSO Fuzzy P&O
Offset=0
0 0.02 0.04 0.06 0.08 0.1
0.2 0.4 0.6 0.8 1
Time (sec)
Irra
dia
nce
(K
W/
m2
)
Figure 15. Compared the output of the PSO-fuzzy controller with fuzzy and P&O controllers in steady state under
different radiations
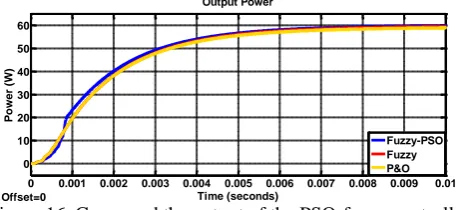
respectively. The transient response of the controllers is shown in Figure 16. With considering to the Figure 16, the PSO-Fuzzy controller converges to appropriate response after almost 0.0008 seconds.
0 0.001 0.002 0.003 0.004 0.005 0.006 0.007 0.008 0.009 0.01
0 10 20 30 40 50 60
Time (seconds)
P
o
w
e
r (
W
)
Output Power
Fuzzy-PSO Fuzzy P&O
Offset=0
Figure 16. Compared the output of the PSO-fuzzy controller with fuzzy and P&O controllers in transient state
4. Conclusion
In this paper has proposed tuning fuzzy scaling factors for MPPT control of PV system by particle swarm optimization (PSO), a haphazard global search method with applicable convergence characteristics. With this optimization method can tune the input and output scaling factors of a PD-type fuzzy controller whose rules are acquired from heuristic knowledge. Generally, having high tracking speed, low rise time, good stability and low disturbance steady state are most important features of this method (PSO-Fuzzy) compared with other conventional methods.
References
[1] M. Jieming, M. Ka Lok, T. O. Ting, Z. Nan, L. Chi-Un, and W. Ngai, "Low-cost global MPPT scheme for Photovoltaic systems under partially shaded conditions," in
Circuits and Systems (ISCAS), 2013 IEEE International Symposium on, 2013, pp. 245-248.
[2] L. L. Jiang, D. L. Maskell, and J. C. Patra, "A novel ant colony optimization-based maximum power point tracking for photovoltaic systems under partially shaded conditions,"
Energy and Buildings, vol. 58, pp. 227-236, 2013.
[3] R. Garraoui, M. Ben Hamed, and L. Sbita, "MPPT controller for a photovoltaic power system based on fuzzy logic," in Systems, Signals & Devices (SSD), 2013 10th International Multi-Conference on, 2013, pp. 1-6.
[4] T. Esram and P. L. Chapman, "Comparison of photovoltaic array maximum power point tracking
techniques," IEEE TRANSACTIONS ON ENERGY CONVERSION EC, vol. 22, p. 439, 2007.
[5] S. Subiyanto, A. Mohamed, and M. Hannan, "Intelligent maximum power point tracking for PV system using Hopfield neural network optimized fuzzy logic controller,"
Energy and Buildings, vol. 51, pp. 29-38, 2012.
[6] M. Miyatake, F. Toriumi, N. Fujii, and H. Ko, "Maximum power point tracking of multiple photovoltaic arrays: a PSO approach," Aerospace and Electronic Systems, IEEE Transactions on, vol. 47, pp. 367-380, 2011.
[7] J. Hurel, A. Mandow, and A. Garcia-Cerezo, "Tuning a fuzzy controller by particle swarm optimization for an active suspension system," in IECON 2012-38th Annual Conference on IEEE Industrial Electronics Society, 2012, pp. 2524-2529.
[8] M. A. Islam, A. B. Talukdar, N. Mohammad, and P. K. S. Khan, "Maximum power point tracking of photovoltaic arrays in Matlab using fuzzy logic controller," in India Conference (INDICON), 2010 Annual IEEE, 2010, pp. 1-4. [9] S. Lixia, D. Zheng Dan, and H. Fengling, "Study on MPPT approach in photovoltaic system based on fuzzy control," in Industrial Electronics and Applications (ICIEA), 2013 8th IEEE Conference on, 2013, pp. 1259-1263. [10] Y. Shijie, Y. Jia, and X. Lei, "Fuzzy logic control of MPPT for photovoltaic power system," in Fuzzy Systems and Knowledge Discovery (FSKD), 2012 9th International Conference on, 2012, pp. 448-451.
[11] A. M. Noman, K. E. Addoweesh, and H. M. Mashaly, "A fuzzy logic control method for MPPT of PV systems," in
IECON 2012 - 38th Annual Conference on IEEE Industrial Electronics Society, 2012, pp. 874-880.
[12] W. Xie and J. Hui, "MPPT for PV System Based on a Novel Fuzzy Control Strategy," in Digital Manufacturing and Automation (ICDMA), 2010 International Conference on, 2010, pp. 960-963.
[13] S. Sreekumar and A. Benny, "Fuzzy logic controller based maximum power point tracking of photovoltaic system using boost converter," in 2013 Fourth International Conference on Computing, Communications and Networking Technologies (ICCCNT), 2013, pp. 1-6.
[14] I. W. Christopher and R. Ramesh, "Comparative Study of P&O and InC MPPT Algorithms."
[15] K. Hussein, I. Muta, T. Hoshino, and M. Osakada, "Maximum photovoltaic power tracking: an algorithm for rapidly changing atmospheric conditions," IEE Proceedings-Generation, Transmission and Distribution, vol. 142, pp. 59-64, 1995.
[16] V. Salas, E. Olias, A. Barrado, and A. Lazaro, "Review of the maximum power point tracking algorithms for stand-alone photovoltaic systems," Solar energy materials and solar cells, vol. 90, pp. 1555-1578, 2006.
[17] M. M. Algazar, H. A. EL-halim, and M. E. E. K. Salem, "Maximum power point tracking using fuzzy logic control,"
International Journal of Electrical Power & Energy Systems, vol. 39, pp. 21-28, 2012.
[18] H. Mahamudul, M. Saad, and M. Ibrahim Henk, "Photovoltaic system modeling with fuzzy logic based maximum power point tracking algorithm," International Journal of Photoenergy, vol. 2013, 2013.