A New Validated Stability-Indicating RP-HPLC Method for the Estimation of Pitavastatin in Tablet Dosage Forms
8
0
0
Full text
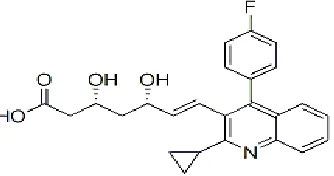
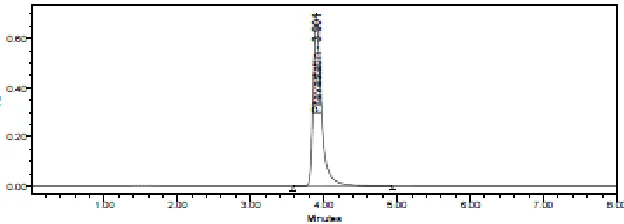
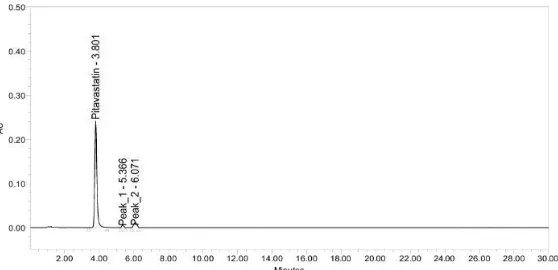
(2) 68 K.Sujatha, et al / Int. J. of Pharmacy and Analytical Research Vol-3(1) 2014 [67-74]. Figure 1. Structure of pitavastatin A literature survey revealed that some analytical new accurate and precise stability – indicating RPmethods have been reported for the determination of HPLC method with short retention and run times for pitavastatin in pharmaceutical dosage forms using the determination of pitavastatin in bulk drug samples spectrophotometry [6], HPLC [7], HPTLC [8-9], and in tablet dosage forms. The developed method UPLC [10] and LC/MS [11]. We have developed a has been duly validated as per ICH guideline. MATERIALS AND METHODS The pure reference sample of pitavastatin was obtained from Aizant Drug Research Solutions Pvt Ltd., Hyderabad. The commercial tablet formulation of pitavastatin ‘Flovas’ (2 mg) manufactured by IPCA Laboratories Ltd., Mumbai, was purchased from the local market. Potasium dihydrogen B. Equipment and chromatographic conditions A Waters Alliance liquid chromatograph (model 2695) fitted with a diode array detector (model 2996) and running on Empower2 data handling system was employed in the study. An Agilent Eclipse XDB C18 column (150 x 4.6 mm; 5) was used for analyzing the drug. All the chromatographic runs were carried out by using a mobile phase consisting of a mixture. A. Drugs, chemicals, and solvents orthophosphate, orthophosphoric acid, HPLC acetonitrile and HPLC grade methanol purchased from Rankem Fine Chemicals Mumbai. HPLC grade water was prepared by Millipore Milli-Q system.. grade were Ltd., using. of phosphate buffer (pH 3.4) and acetonitrile (65:35 v/v) in isocratic mode at a flow rate of 0.9 mL/min. The injection volume of the samples was 10 µL. The detector wavelength was set at 244 nm. The chromatographic run time was set as 8.0 min. Under these optimized conditions, the retention time obtained for pitavastatin was 3.905 min.. Figure: 2.Chromatogram of Pitavastatin from working standard solution. C. Preparation of the phosphate buffer The phosphate buffer was prepared by dissolving 1.36 gm of potassium dihyrogen phosphate in a beaker containing 1000 mL of water and the contents. were sonicated. The pH of the solution was then adjusted to 3.4 with ortho phosphoric acid. It was then filtered through a 0.45µ membrane filter..
(3) K.Sujatha, et al / Int. J. of Pharmacy and Analytical Research Vol-3(1) 2014 [67-74]. D. Preparation of the mobile phase The optimized mobile phase consisted of a mixture of the above-mentioned phosphate buffer (pH 3.4) and acetonitrile in the ratio of 65:35 v/v.. E. Preparation of the diluent Methanol was used as the diluent.. F. Preparation of the working standard solution of pitavastatin 10 mg of pitavastatin reference standard was accurately weighed and transferred into a 10 mL volumetric flask. To this, 7 mL of methanol was added, sonicated for 5 minutes and the volume was made up with a further quantity of methanol. This was used as the standard stock solution. The working standard solution was prepared by diluting 1.0 mL of. the standard stock solution to 10 mL with the diluent in a volumetric flask.. G. Calibration plot Solutions of pitavastatin at different concentration levels including the working standard concentration were prepared with the diluent. Twenty microlitres of each concentration was injected three times into the HPLC system (n=3). The response was read at 244 nm and the corresponding chromatograms were recorded. From these chromatograms, the mean peak areas at the different concentration levels were calculated and the linearity plot of mean peak areas over their concentrations was constructed.. H. Estimation of the drug from the tablet dosage forms Ten ‘Flovas’ (2 mg) tablets were crushed and ground to a fine powder. Tablet powder equivalent to 10 mg of pitavastatin was transferred into a 10 mL volumetric flask. 8mL of diluent was added and sonicated for 30 min. The volume was made up with the diluent and the contents were mixed well. This mixture was filtered through a 0.45µ membrane filter. (discarding the first few mL of the filtrate). 1 mL of the filtrate was transferred into a 10 mL volumetric flask and made up to volume with diluent. This solution was then chromatographed six times. From the chromatograms obtained, the average drug content in the formulation was calculated.. Figure 3. Chromatogram of pitavastatin from its tablet dosage form. RESULTS AND DISCUSSION During the method optimization studies, various combinations and proportions of the solvents and buffers were examined on an Agilent Eclipse XDB C18 column for efficient separation of pitavastatin. Using a mobile phase consisting of a mixture of phosphate buffer (pH 3.4) and acetonitrile in the ratio of 65:35 v/v, a good resolution and baseline separation of the drug peak was obtained. All the chromatographic conditions were optimized by. valuating the column efficiency parameters like theoretical plates and tailing factor (Table 1). Under these optimized conditions, the retention time obtained for pitavastatin was 3.905 min (Figure 2) in a run time of 8.0 min. The method was then validated as per the ICH guideline. The proposed method was also found to be applicable for the analysis of pitavastatin in tablet formulations..
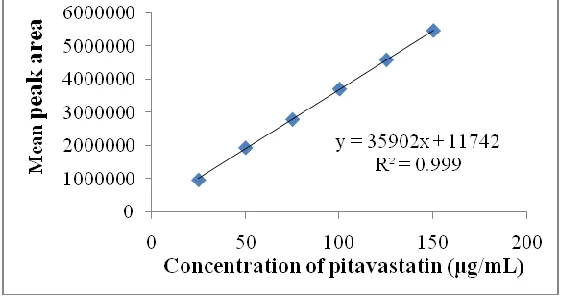
(4) 70 K.Sujatha, et al / Int. J. of Pharmacy and Analytical Research Vol-3(1) 2014 [67-74]. Table 1. Optimized chromatographic conditions Stationary Phase Mobile Phase Flow Rate Column Temperature Injection Volume Detection Wavelength. Agilent Eclipse XDB C18 (100 x 4.6 mm, 5m) Phosphate buffer : Acetonitrile =65:35 v/v 0.9 mL/min 30°C 10 µL 244 nm. A. Specificity A good analytical method should be able to measure the analytes accurately in the presence of probable interferences from its solvent as well as from the excipients of its formulation. Figure 2 shows good chromatographic baseline separation of pitavastatin. from its working standard solution. Figure 3 demonstrates that no interfering peaks were observed at the retention time of pitavastatin arising due to the excipients of its tablet.. B. Linearity The calibration curve (n=3) constructed for the drug was linear over the concentration range of 25 – 150 µg/mL. The regression of the plot was computed by least square regression method and is shown in. Figure 4. The correlation coefficient is greater than 0.99 and the %RSD at each concentration studied was less than 2.. Figure 4. Linearity plot for pitavastatin. C. Accuracy and precision The accuracy of the method was determined by recovery experiments. The recovery studies were carried out and the percent recovery with its standard deviation were calculated (Table 2). The high percentage of recovery indicates that the proposed. Analyte Pitavastatin. method is quite accurate. The precision of the method was demonstrated by inter-day and intra-day variation studies. Six replicate injections of sample solutions were made and the percent RSD was calculated (Table 3).. Table 2. Accuracy data of the proposed method Amount of the analyte Mean recovery taken (µg/mL) (µg/mL) ± SD 50 50.26 ± 0.31 100 100.14 ± 0.01 150 151.65 ± 0.03. % Mean recovery ± SD 100.52 ± 0.62 100.14 ± 0.01 101.10 ± 0.02.
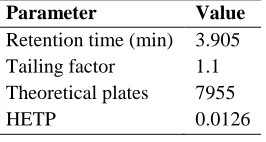
(5) K.Sujatha, et al / Int. J. of Pharmacy and Analytical Research Vol-3(1) 2014 [67-74]. Table 3. Precision data for the proposed method S.No. Intra-day precision Inter-day precision 1 3722681 3721986 2 3722486 3722045 3 3722687 3718926 4 3722415 3722694 5 3722105 3722468 6 3722098 3722195 3721719 Average 3722412 263.18 1394.03 SD 0.007 0.037 %RSD. D. System suitability parameters System suitability parameters were studied with six replicate injections of the standard solution and the results are presented in Table 4. Table 4. System suitability parameters of the proposed method Parameter Value Retention time (min) 3.905 Tailing factor 1.1 Theoretical plates 7955 HETP 0.0126. E. Degradation studies Peroxide degradation: 1 mL of stock solution of pitavastatin was transferred into a 10 mL volumetric flask. To that 1 mL of 20% hydrogen peroxide (H2O2) was added. The solution was kept for 30 min at 60°C. The resultant solution was. diluted w i t h d i l u e n t to obtain 100 µg/mL solution of pitavastatin. 10 µL of this solution was injected into the system and the chromatogram was recorded.. Figure 5. Chromatogram of pitavastatin subjected to peroxide degradation Acid - degradation: 1 mL of stock solution of pitavastatin was transferred into a 10 mL volumetric flask. To it 1 mL of 2M hydrochloric. acid was added and refluxed for 30mins at 60°C. The resultant solution was diluted w i t h d i l u e n t to obtain 100 µg/mL solution of. 71.
(6) 72 K.Sujatha, et al / Int. J. of Pharmacy and Analytical Research Vol-3(1) 2014 [67-74]. pitavastatin. 10 µL of this solution was injected into. the system and the chromatogram was recorded.. Figure 6. Chromatogram of pitavastatin subjected to acid - degradation Base - degradation: 1 mL of stock solution of pitavastatin was transferred into a 10 mL volumetric flask. To it, 1 mL of 2 M sodium hydroxide was added and refluxed for 30min at. 60°C. The resultant solution was diluted w i t h d i l u e n t to obtain 100 µg/mL solution of pitavastatin. 10 µL of this solution was injected into the system and the chromatogram was recorded.. Figure 7. Chromatogram of pitavastatin subjected to base - degradation Dry heat degradation: The w o r k i n g standard solution of pitvastatin w a s placed in oven at 105°C for six hours. The resultant solution was. diluted to 100 µg/mL solution and 10 µL was injected into the system and the chromatogram was recorded.. Figure 8. Chromatogram of pitavastatin subjected to dry heat - degradation.
(7) K.Sujatha, et al / Int. J. of Pharmacy and Analytical Research Vol-3(1) 2014 [67-74]. Photo - d e g r a d a t i o n : The photochemical stability of the drug was also studied by exposing the working standard solution of pitavastatin to UV light by keeping the beaker in UV Chamber for 7days.. The resultant solution was diluted to obtain 100 µg/mL solution of pitavastatin. 10 µL of this solution was injected into the system and the chromatogram was recorded.. Figure: 9. Chromatogram of pitavastatin subjected to photo - degradation. Neutral - degradation: Stress testing under neutral conditions was studied by refluxing the drug in water for 6 h o u r s at a temperature of 60°C. The. resultant solution was diluted to get 100 µg/mL solution of pitavastatin and 10 µL was injected into the system and the chromatogramswas recorded.. Figure 10. Chromatogram of pitavastatin subjected to neutral - degradation. F. Method suitability The commercial tablet formulation, Flovas (2 mg) was analyzed by the proposed method. The recovery obtained (100.1%) by the proposed method was found to be in good agreement with the labelled. amount of the drug, which confirms the suitability of the method for the analysis of pitavastatin in tablet dosage forms.. CONCLUSION The proposed RP -HPLC method is sensitive, precise, accurate and stability indicating and can be used for. the routine determination of pitavastatin in its tablet dosage forms.. 73.
(8) 74 K.Sujatha, et al / Int. J. of Pharmacy and Analytical Research Vol-3(1) 2014 [67-74]. ACKNOWLEDGEMENT The authors are thankful to the authorities of the College of Pharmaceutical Sciences, Andhra. University, for providing laboratory facilities to carry out this study.. REFERENCES [1] Sweetman SC, Martindale. The complete dug reference. The Pharmaceutical press: London, 2007. [2] Kajinami K, Takekoshi N, Saito Y. Pitavastatin: Efficacy and Safety Profiles of a Novel Synthetic HMG CoA Reductase Inhibitor. Cardiovascular Drug Reviews. 21, 2003, 199 - 215. [3] Mukhtar RYA, Reid J, Reckless JPD. Pitavastatin, International Journal of Clinical Practice. 59, 2005, 239 - 252. [4] Lennernäs H, Fager G. Pharmacodynamics and pharmacokinetics of the HMG-CoA reductase inhibitorsSimilarities and differences. Clinical Pharmacokinetics. 32, 1997, 403 – 425. [5] Istvan ES, Deisenhofer J. Structural mechanism for statin inhibition of HMG-CoA reductase. Science. 292, 2001, 1160 –1164. [6] Krishna MV, Sankar DG. Adaptation of Color Reactions for Spectrophotometric Determination of Pitavastatin Calcium in Bulk Drugs and in Pharmaceutical Formulations. E J Chem. 4, 2007, 272-278. [7] Neelima B, Ravi Kumar P, Hima Bindu V, Rajendra Prasad Y. A Validated Stability Indicating RP-HPLC Method for Estimation of Pitavastatin in Bulk and Pharmaceutical Dosage Form. International Journal of Pharma Sciences. 3, 2013, 309-315. [8] Kumar NS, Nisha N, Nirmal J, Sonali N, Bagyalakshmi J. HPLC Determination of Pitavastatin Calcium in Pharmaceutical Dosage Forms. Pharm Ana Acta. 2, 2011, 119. doi:10.4172/2153-2435.1000119. [9] Satheesh Kumar N, Baghyalakshmi J. Determination and Quantification of Pitavastatin Calcium in Tablet Dosage Formulation by HPTLC Method. Analytical Letters. 40, 2007, 2625-2632. [10] Hiral Panchal J, Bhanubhai Suhagia N, Natubhai Patel J, Bhavesh Patel H. A Simple and Sensitive HPTLC Method for Quantitative Analysis of Pitavastatin Calcium in Tablets. Journal of Planar Chromatography – Modern TLC. 21, 2008, 267-270. [11] Antony Raj Gomas, Pannala Raghu Ram, Nimmakayala Srinivas, Jadi Sriramulu. Degradation Pathway for Pitavastatin Calcium by Validated Stability Indicating UPLC Method. American Journal of Analytical Chemistry. 2, 2010, 83-90. [12] Nirogi R, Mudigonda K, Kandikere V. Chromatography–Mass Spectrometry Methods for the Quantitation of Statins in Biological Samples. Journal of Pharmaceutical and Biomedical Analysis. 44, 2007, 379-387. [13] ICH Harmonized Tripartite Guidelines (Q2R1). Validation of analytical procedures: Text and Methodology. International Conference on Harmonization, European commission, Japan and USA (2005). *******************************.
(9)
Figure
+3

Related documents
The purpose of the study was to quantify through 3D computer modelling whether the new TFNA nail, with a 1.0-m bow design, provides a better anatomical fit com- pared with an
Good dreams, unlike bad dreams, have different effects on both the dreamer and the hearers.. For one, the dreamer will naturally be
Hitch Hiker classifies LooCI bindings as high-priority and low-priority, and this classifica- tion allows Hitch Hiker to support data aggregation by appending low-priority data in
The second benefit of the presented GGBA zero- knowledge protocol is that all the nonlinear operations are transferred from the encrypted domain (where they must be performed
Key search terms included diabetic foot ulcer, peripheral vascular disease, peripheral neuropathy, infection, osteomyelitis, wound and ulcer care, and amputation.. Unfor tunately,
Four weeks after the first vaccination (week 12), the antibody titers of CpG plus AT2-inactivated SIVmac239-treated animals in- creased and the mean anti-SIV IgG antibody titer of
Поскольку текстовая деятельность – это один из видов учебной деятельности, то при ее организации обязательно должны быть учтены закономерности естественной
Photocurrents were calculated using initial state wavefunction obtained by solving one dimensional Schrödinger equation in terms of Greens function where the crystal potential
