Combining meta-QTL with RNA-seq data to identify candidate
genes of kernel row number trait in maize
Qin Jiang
1, Dengguo Tang
1, Chong Hu
1, Jingtao Qu
1, Jian Liu
1*
1Maize Research Institute, Sichuan Agricultural University, Huiming Road, Wenjiang District, Chengdu, Sichuan 611130, China
*Corresponding author: E-mail: [email protected]
Keywords: maize, kernel row number, meta-analysis, meta-QTL, candidate genes
Introduction
Maize (Zea mays L) is one of the most
impor-tant food crops throughout the world. It has not only served as staple for humans and animals, but as source of bioenergy. With the expansion of popula-tion and deteriorapopula-tion of the global energy crisis, maize will face greater demands for grain production. Hence, improvement of crop production is of great significance. Grain yield is a quantitative trait, which is influenced by environmental factors and multi-genes
with minor effects (Li et al, 2011). The decomposition
of the complex yield trait into its elementary compo-nent traits may be the best strategy for elucidating the genetic mechanism of yield trait.
Kernel row number (KRN) trait is more accessible and accurate than other complex quantitative traits. KRN was not only an important yield component (one of the major components of grain yield), but also one of the key trait during the domestication of maize. The domestication of maize changed with dramatic differentiation in KRN from its wild ancestor teosinte (2 rows of kernel) to most varieties of modern maize (8-20 rows of kernel). Due to the crucial role of KRN trait in maize genetic and breeding, a considerable number of studies have been conducted on KRN trait and various types of data had been accumulated. In addition, lots of genes related to homology traits have been cloned from closely related model species.
Quantitative trait loci (QTL) mapping is a power-ful tool for locating chromosomal regions involved in
complex traits (Somers et al, 2007). Based on
phe-notypic and gephe-notypic data, QTL mapping enables the identification of action, interaction, numbers and chromosomal locations of loci affecting particular
traits (Miles and Wayne, 2008). In the past several
decades, hundreds of QTL have been detected for KRN, which were then mapped on all ten
chromo-somes in maize (Cai et al, 2014; Choe and Rocheford,
2012; Upadyayula et al, 2006). Liu et al (2015) identi-fied a main QTL KRN4 mapping on chromosome 4 (bin4.08) through genome-wide association studies (GWAS) and linkage mapping. The published QTL of KRN were derived from the different QTL mapping
populations (F2:3, BC1S1, BC2F2, IF2, and RIL) and
mo-lecular markers (RFLP, SSR, INDEL, and SNP) (Austin
and Lee, 1996; Calderón et al, 2016; Karen Sabadin et al, 2008; Li et al, 2009; Li et al, 2007; Lu et al, 2011;
Veldboom and Lee, 1994). However, the validity of QTL mapping is influenced by many factors including different experiment environments, materials, map-ping population, population type and size, number of QTL, density of genetic markers, and heritability of traits, among which the analysis of genetic and statis-tical models have significantly influenced QTL
detec-tion and locadetec-tion (Austin and Lee, 1996; Martinez et
al, 2016). These QTL associated with the same trait increased gradually, but the results dramatically
dif-Abstract
Kernel row number is an important component of grain yield in maize. With development of classical quan-titative trait loci (QTL) mapping and modern RNA-seq, numerous QTL and tissue-specific gene expression data were accumulated in previous studies. In this paper, a total of initial 373 QTL for grain yield (GY) and kernel row number (KRN) were collected based on 29 previous literatures. Fifty-four meta-QTL (MQTL) were detected via the meta-analysis method with IBM2 2008 Neighbors as a reference map, including 19 for GY and 35 for KRN. These MQTL were unevenly distributed on all 10 chromosomes. Chromosome 1 harbored the most initial QTL and MQTL, and chromosome 7 contained the least. Three MQTL for KRN have been overlapped with MQTL for GY on chromosomes 1 and 3. A total of 1,588 (46.07%) out of 3,447 genes located in the KRN MQTL regions were iden-tified by gene expression data, and categorized into 101 significant GO terms. Meanwhile, six candidate genes were identified from MQTL regions, which are homologous to three functionally characterized genes found to participate in plant inflorescence development. The identified MQTL could be applied to marker-assisted selection (MAS) to facilitate yield architecture, QTL fine mapping and gene cloning in the maize community. Furthermore, the identified candidate genes could enhance the selection efficiency by MAS directly, and could illuminate molecular mechanisms of grain yield in maize.
fered. It is difficult to apply to these QTL to molecular marker-assisted selection (MAS) breeding practice.
Compared with QTL mapping, molecular cloning of genes associated with KRN has lagged behind, es-pecially, the field of positional or map-based cloning. Several genes associated with KRN have been iden-tified and cloned through mutations or map-based
cloning, include zfl2 (Bomblies and Doebley, 2006;
Bomblies et al, 2003), fea2 (Bommert et al, 2013b) and
ub3 (Chuck et al, 2014) and it’s enhancing QTL (Liu et al, 2015). fea2 gene of all these genes resulted in the over-proliferation of ear inflorescence meristem, increased the KRN, and was cloned and mapped into the major QTL regions for KRN on chromosome
4 (bin4.05) (Bommert et al, 2013b; Taguchi-Shiobara
et al, 2001). Moreover, the rapid development of next generation sequencing (NGS) technologies and com-putational methods enables extensive transcriptome-wide analysis of different tissues and organs in maize by RNA-seq, such as the developmental dynamics of the maize leaf transcriptome, regulatory modules of inflorescence architecture, regulatory network in the
maize kernel and so on (Eveland et al, 2014; Fu et al,
2013; Li et al, 2010b). Although some genes are found to be associated with KRN, the genetic mechanism is poorly known. Therefore, understanding genetic ba-sis of KRN will not only accelerate the breeding of maize, but also make a further step into the study of maize evolution.
Meta-analysis is a quantitative comprehensive analysis method for synthesizing data from various
different independent results (Rosenberg et al, 2004).
It could mine the «real» QTL from a host of positioning results, refine confidence interval (CI) and enhance
the accuracy and effectiveness of QTL mapping (Li
et al, 2013). In recent years, the method has been
fre-quently applied in maize (Xiang et al, 2012), wheat
(Hanocq et al, 2007) and rice (Ballini et al, 2008). For
instance, Lv et al (2008) identified three meta-QTL
(MQTL) for resistance to sugarcane mosaic virus in maize and mined four candidate genes on the MQTL of chromosome 3. One of MQTL for photoperiod sensitivity was identified in maize bin 10.04 where
a CCT-domain containing gene was found (Xu et al,
2012). And then this gene was proved to be ZmCCT
that functioned on controlling photoperiod response
in maize (Hung et al, 2012). Therefore, meta-analysis
could facilitate to excavate consistency of main gene loci controlling the same trait, and also furnish valu-able «clue» for QTL fine-mapping.
In the current study, the published QTL associ-ated with KRN and GY in maize were collected and MQTL were retrieved through meta-analysis path-way with IBM2 2008 Neighbors as a reference map. Meanwhile, the purpose of combining comprehen-sive meta-analysis with currently available RNA-seq data of critical periods in the KRN morphogenesis is to identify candidate gene responsible for KRN trait. It provided important information for MAS breeding and
Materials and Methods
Collection of dataGrain yield (GY) of maize is a complex trait con-sisting of several yield components, including ker-nel row number, kerker-nel number per row and kerker-nel weight. In this study, GY and KRN were investigated. The key words «grain yield» and «kernel row number»
were retrieved in the NCBI (http://www.ncbi.nlm.nih.
gov/pubmed/) and MaizeGDB website (http://www. maizegdb.org/). Here, we collected 29 manuscripts published from 1996 to 2015. The information of QTL consisted of parent lines, the types and size of QTL mapping population, and the numbers of QTL per
trait was provided in Table 1. Furthermore, we also
surveyed flanking molecular markers, QTL position, confidence interval (CI), LOD score and proportion of
phenotypic variance explained (PVE or R2) in terms of
each QTL. If two or several QTL for the same trait ex-isted in consensus map positions in one study, they were considered as identical QTL, and thus only one QTL was counted in our study. The gene action and epistatic loci were not considered in this paper.
The genome sequences for B73 (Release
ZmB73_RefGen_v2) was downloaded from http://
www.maizesequence.org/index.html. The 5’-UTR, coding determining sequences (CDS), 3’-UTR, exon, intron and intergenic regions were determined based
on their original annotations (ZmB73_5b_FGS, http://
ftp.maizesequence.org/current/filtered-set/). TSS_ up_0.5kb region are defined as 0.5kp upstream of the transcription start site and TES_down_0.5kb region are defined as 0.5kp downstream of the transcription end site. The RNA-seq data of inflorescence meri-stem (IM) period of B73 were downloaded from NCBI
(accession number GSE51050) (Eveland et al, 2014).
QTL projection and meta-analysis QTL
The 373 identified QTL were projected onto the reference map (IBM2 2008 Neighbors) for meta-analysis based on the original map positions, LOD
score, CI and R2. The following formulas were used
to estimate 95% CI in case the CI of QTL was not demonstrated.
CI = 530 / (N × R2) (1)
CI = 163 / (N × R2) (2)
where N represented the mapping population size
and R2 represented the ratio of phenotypic variation
explained by the identified QTL. The formula (1) was applied in backcrossed lines (BC), test-cross lines
(TC) and F2 population (Darvasi and Soller, 1997) and
formula (2) was applied in recombinant inbred lines
(RIL) ( Guo et al, 2006).
The high-density genetic linkage map of IBM2 2008 Neighbors (Intermated B73 × Mo17) played a crucial role in the reference map. This map crossed 8,054.28 centiMorgans (cM) and included 15,991 RFLP, SSR, AFLP, genes, PARD markers etc. This wealthy map shared plentiful common markers with selecting candidate genes for KRN in maize.
Results
Initial QTL on chromosomes in maize
Information on QTL for GY and KRN was collect-ed from 29 literatures reportcollect-ed over the past 19 years from 1996 to 2015. A total of 373 QTL were collected (Table 1) and 166 special for GY and 207 for KRN, Table 1 - Detailed information of the QTL used for Meta-analysis.
References Parents Population size Cross type N° of QTL for GY N° of QTL for KRN
Barrière et al, 2010 F838 x F286 240 RIL 8
-Liu et al, 2011 Huang C x Xu178 203 RIL 7
-Ribaut et al, 2007 Ac7643S5 x Ac7729 240 F2:3 8
-Messmer et al, 2009 CML444 x SC-Malawi 236 RIL 5
-Liu et al, 2010 Mo17 x Huangzao4 239 RIL - 6
Guo et al, 2011 Zheng58 x Chang7-2 231 F2:3 10
-Cai et al, 2012 Ye478 x Wu312 218 RIL 18
-Liu et al, 2014 V671 x Mc 270 F2:3 -
-Yang et al, 2015 B73 x SICAU1212 325 RIL - 26
Li et al, 2014 Nongxi531 x H21 526 BC4F1 - 17
Cai et al, 2014 MT-6 x B73 266 F2 - 7
Yu et al, 2014 1132 x 751 342 F2 - 3
Tian et al, 2014 Y1648 x Y2348 180 F2:3 - 7
Y1648 x Y2348 180 F2:4 - 6
- BC3F2:3 - 4
Choe and Rocheford 2012BH20 x BH30 264 F2:3 - 5
Yang et al, 2012 GY220 x 8984 282 RIL 8 20
GY220 x 8622 263 RIL 6 13
Li et al, 2011 Dan232 x N04 258 RIL 10 13
Peng et al, 2011 Huangzao4 x Qi319 230 F2:3 4
-Huangzao4 x Ye478 235 F2:3 4
-Lu et al, 2011 Ye478 x Dan340 397 F2:3 12 13
Tang et al, 2010 Zong3 x 871 426 433 IF2 3 1
Li et al, 2010a 5003 x 178 210 F2:3 7 12 Li et al, 2009 GY220 x 8984 284 F2:3 1 4 GY220×8622 265 F2:3 2 4 Karen Sabadin et al 2008L-08-05F x L-14-4B 400 F2:3 - 10 Li et al, 2007 Dan232 x N04 220 BC2F2 4 2 259 F2:3 1 4
Yan et al, 2006 Zong3 x 87-1 266 F2:3 5 18
Upadyayula et al, 2006 ILP x B73 150 BC1F1 - 4
Ho et al, 2002 RD6501 x RD3013 204 BC2 as TC 5
-Huang et al, 2010 F2 x F252 300 Conventional F3 9
-F2 x -F252 322 Intermated F3 12
-Coque and Gallais, 2006 Io x F2 99 RIL as TC 11
-Austin and Lee, 1996 Mo17 x H99 186 RIL 6 8
Total 166 207
the original maps recorded in this paper. The projec-tion of QTL was carried out by BioMercator V3.0
soft-ware (Sosnowski et al, 2012). The best positions of
original QTL and CI were projected on the reference
map underlying the homothetic function (Chardon
et al, 2004). MQTL are the consensus QTL from the model with lowest Akaike Information Criterion (AIC)
value (Goffinet and Gerber, 2000). When some QTL
could not be projected or map positions were beyond the scope on the reference map, the QTL would be discarded to ensure accuracy and dependability of projection.
Candidate genes mining and GO analysis
These MQTL involved in KRN were selected as the candidate genomic region for further analysis. RNA-seq data controlling maize inflorescence ar-chitecture were downloaded from NCBI website (www.ncbi.nlm.nih.gov/geo/; GSE51050; Eveland et al, 2014). The candidate genes were identified by the gene-level expression values, which are repre-sented by fragments per kilo base exon per million
reads mapped (FPKM), and a consensus FPKM was determined for each gene based on its representa-tion across biological replicates. The GO enrichment analysis of the significant genes with FPKM > 1 of MQTL regions was carried out using singular enrich-ment analysis (SEA) approach by online AgriGO tool (http://bioinfo.cau.edu.cn/agriGO/) with the B73
ref-erence genome (AGPv3.30) as background (Du et
al, 2010). The highly significant enriched terms were chosen by default P-value and false discovery rate (FDR). Protein sequence alignment using BLAST by
default e-value (e-10), and homologous genes were
identified with identity larger than 40% and coverage more than 60% length alignment.
With the development of molecular marker tech-nology and QTL mapping software, plenty of QTL have been generated on over 10 chromosomes and gene cloning for agronomic traits in maize. By far, thousands of QTL have been generated, that are rel-evant to phenotype (plant height, leaf angle, and ear diameter, etc), flowering time, biotic stress, abiotic stress, and so on. Extensive studies had been done on yield and yield-related traits, especially for KRN trait. Consequently, the researchers have to face the problems that how to effectively employ these in-dependent study programs. In addition, increase of gene expression data produced by microarray-based and RNA-seq would unlock new area in
meta-analy-Discussion
respectively. Nine original QTL for GY and seven for KRN could not be projected on the reference map. These initial QTL were unevenly distributed on the
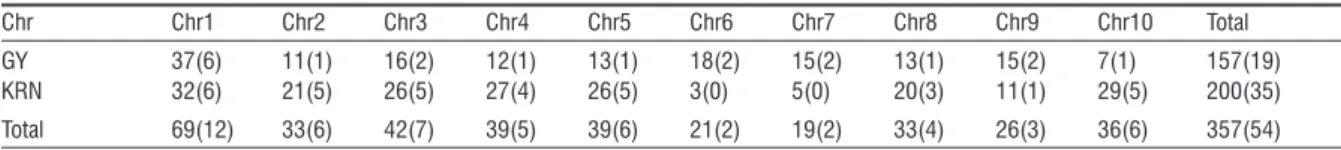
10 chromosomes. The amount of initial QTL (Table 2)
ranged from 19 (chromosome 7) to 69 (chromosome 1). QTL for GY (37) and KRN (32) was the highest on the chromosome 1. GY QTL was the least (7) on the chromosome 10. The least (3) of KRN QTL were lo-cated onto chromosome 6.
Meta-QTL of KRN and GY on chromosomes in maize
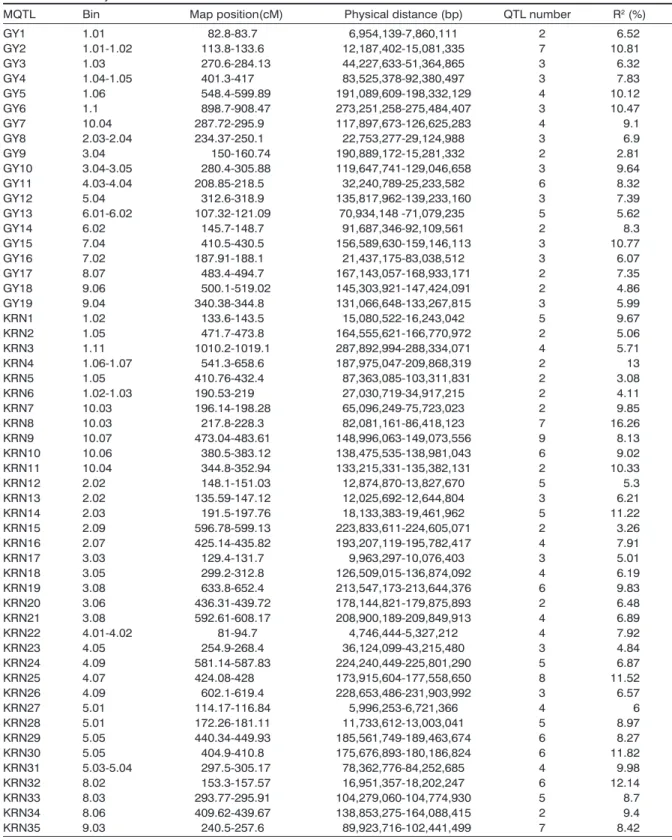
Based on the principle of the lowest AIC value, 35 MQTL for KRN and 19 MQTL for GY were detected via meta-analysis pathway, respectively, which were
also unevenly distributed on all chromosomes (
Ta-bles 2 and 3). The number of MQTL changed from two (chromosomes 6 and 7) to 12 (chromosome 1), with an average of 5.4 MQTL per chromosome. Chromosome1 had the highest frequency of MQTL (12), while chromosomes 6 and 7 had the lowest (2). The numbers of initial QTL in one MQTL ranged from two to nine. The maximum of MQTL for GY and KRN were distributed on chromosome 1, correspond-ing to the distribution of original QTL. The MQTL for GY were detected on all ten chromosomes, whereas KRN MQTL were located on all chromosomes except chromosomes 6 and 7.
The overlapped MQTL between GY and KRN traits were identified with interval on chromosome. As is shown in table 3, three overlapped MQTL were de-tected from 54 MQTL, and they were GY5 overlapped with KRN4 on chromosome 1 (bin 1.06), GY4 over-lapped with KRN5 on chromosome 1 (bin 1.05), and GY10 overlapped with KRN18 on chromosome 3 (bin 3.05), respectively. The overlapping regions maybe inferred some pleiotropic QTL controlled of KRN and GY traits, which could facilitate to screen candidate genes and could process the MAS breeding.
Mining possible candidate genes in MQTL and GO analysis
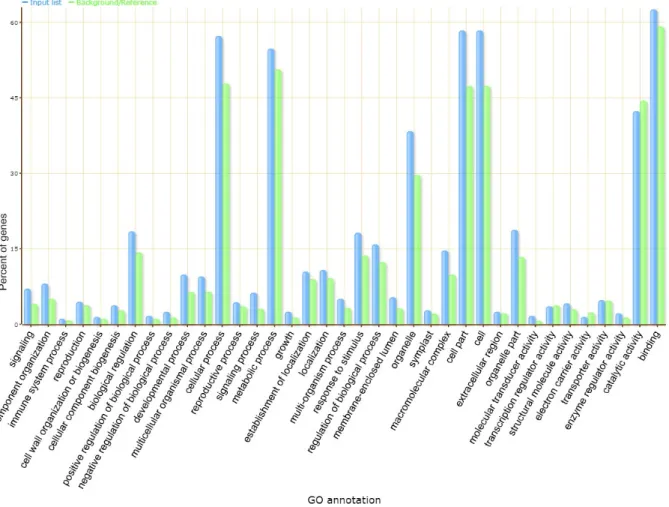
A total of 3447 annotated genes were contained in
these MQTL regions (Supplementary Table 1). FPKM
value of 46.07% (1,588) of these genes ranged from
1.03 to 1,160.35, with an average of 23.39 (
Supple-mentary Table 2). 1,154 genes with FPKM value >1 were annotated and categorized into 101 significant GO terms, including 58 GO terms involved in biologi-cal process such as cellular process (GO:0009987), signaling process (GO:0023046), signal transmission (GO:0023060) and 43 GO terms, which were exten-sively involved in cellular process, intracellular part
(GO:0044424), intracellular (GO:0005622) and cell
part (GO:0044464) (Figure 1, Supplementary Table 3).
Significant progress has been made in under-standing the molecular mechanism of inflorescence development in Arabidopsis, and the classical ABC model had been upgraded to ABCDE model. In or-der to identify candidate genes involved in inflores-cence development in the MQTL regions, 52 genes that were functionally characterized to inflorescence development were collected from Arabidopsis and
Rice (Supplementary Table 4). A total of six homologs
genes in the MQTL regions were identified by pro-tein sequences alignment. These genes involved in the MADS-box gene family and transcription factor in rice and the CLV pathway in Arabidopsis. Three can-didate genes GRMZM2G043584, GRMZM2G017386, and GRMZM2G404207, which are homologous to
CLV1 (Stone et al, 1998). OsMADS7 (homologous
gene of the candidate gene GRMZM2G159397) and
OsMADS32 (homologous gene of the candidate gene
GRMZM2G001139) functioned on inflorescence de-velopment and impacted the kernel number per ear in
rice (Cui et al, 2010; Wang et al, 2015). RFL
(homolo-gous gene of the candidate gene GRMZM2G180190)
controlled of the inflorescence and floral
develop-ment (Ikeda-Kawakatsu et al, 2012). Among of them,
GRMZM2G043584 was mapped in the KRN6 interval and its FPKM value was 86.97. GRMZM2G017386, GRMZM2G404207, and GRMZM2G001139 were located in the KRN34 interval and the FPKM val-ues were 4.68, 7.64, and 129.75, respectively. GRMZM2G159397 was mapped in the KRN4 interval and its FPKM value was 3.9. GRMZM2G180190 was mapped in the KRN12 interval and its FPKM value was 69.17.
Table 2 - Numbers of initial QTL and identified MQTL (in brackets) on the chromosomes.
Chr Chr1 Chr2 Chr3 Chr4 Chr5 Chr6 Chr7 Chr8 Chr9 Chr10 Total
GY 37(6) 11(1) 16(2) 12(1) 13(1) 18(2) 15(2) 13(1) 15(2) 7(1) 157(19)
KRN 32(6) 21(5) 26(5) 27(4) 26(5) 3(0) 5(0) 20(3) 11(1) 29(5) 200(35)
Table 3 - Meta-analysis results of GY and KRN in maize.
MQTL Bin Map position(cM) Physical distance (bp) QTL number R2 (%)
GY1 1.01 82.8-83.7 6,954,139-7,860,111 2 6.52 GY2 1.01-1.02 113.8-133.6 12,187,402-15,081,335 7 10.81 GY3 1.03 270.6-284.13 44,227,633-51,364,865 3 6.32 GY4 1.04-1.05 401.3-417 83,525,378-92,380,497 3 7.83 GY5 1.06 548.4-599.89 191,089,609-198,332,129 4 10.12 GY6 1.1 898.7-908.47 273,251,258-275,484,407 3 10.47 GY7 10.04 287.72-295.9 117,897,673-126,625,283 4 9.1 GY8 2.03-2.04 234.37-250.1 22,753,277-29,124,988 3 6.9 GY9 3.04 150-160.74 190,889,172-15,281,332 2 2.81 GY10 3.04-3.05 280.4-305.88 119,647,741-129,046,658 3 9.64 GY11 4.03-4.04 208.85-218.5 32,240,789-25,233,582 6 8.32 GY12 5.04 312.6-318.9 135,817,962-139,233,160 3 7.39 GY13 6.01-6.02 107.32-121.09 70,934,148 -71,079,235 5 5.62 GY14 6.02 145.7-148.7 91,687,346-92,109,561 2 8.3 GY15 7.04 410.5-430.5 156,589,630-159,146,113 3 10.77 GY16 7.02 187.91-188.1 21,437,175-83,038,512 3 6.07 GY17 8.07 483.4-494.7 167,143,057-168,933,171 2 7.35 GY18 9.06 500.1-519.02 145,303,921-147,424,091 2 4.86 GY19 9.04 340.38-344.8 131,066,648-133,267,815 3 5.99 KRN1 1.02 133.6-143.5 15,080,522-16,243,042 5 9.67 KRN2 1.05 471.7-473.8 164,555,621-166,770,972 2 5.06 KRN3 1.11 1010.2-1019.1 287,892,994-288,334,071 4 5.71 KRN4 1.06-1.07 541.3-658.6 187,975,047-209,868,319 2 13 KRN5 1.05 410.76-432.4 87,363,085-103,311,831 2 3.08 KRN6 1.02-1.03 190.53-219 27,030,719-34,917,215 2 4.11 KRN7 10.03 196.14-198.28 65,096,249-75,723,023 2 9.85 KRN8 10.03 217.8-228.3 82,081,161-86,418,123 7 16.26 KRN9 10.07 473.04-483.61 148,996,063-149,073,556 9 8.13 KRN10 10.06 380.5-383.12 138,475,535-138,981,043 6 9.02 KRN11 10.04 344.8-352.94 133,215,331-135,382,131 2 10.33 KRN12 2.02 148.1-151.03 12,874,870-13,827,670 5 5.3 KRN13 2.02 135.59-147.12 12,025,692-12,644,804 3 6.21 KRN14 2.03 191.5-197.76 18,133,383-19,461,962 5 11.22 KRN15 2.09 596.78-599.13 223,833,611-224,605,071 2 3.26 KRN16 2.07 425.14-435.82 193,207,119-195,782,417 4 7.91 KRN17 3.03 129.4-131.7 9,963,297-10,076,403 3 5.01 KRN18 3.05 299.2-312.8 126,509,015-136,874,092 4 6.19 KRN19 3.08 633.8-652.4 213,547,173-213,644,376 6 9.83 KRN20 3.06 436.31-439.72 178,144,821-179,875,893 2 6.48 KRN21 3.08 592.61-608.17 208,900,189-209,849,913 4 6.89 KRN22 4.01-4.02 81-94.7 4,746,444-5,327,212 4 7.92 KRN23 4.05 254.9-268.4 36,124,099-43,215,480 3 4.84 KRN24 4.09 581.14-587.83 224,240,449-225,801,290 5 6.87 KRN25 4.07 424.08-428 173,915,604-177,558,650 8 11.52 KRN26 4.09 602.1-619.4 228,653,486-231,903,992 3 6.57 KRN27 5.01 114.17-116.84 5,996,253-6,721,366 4 6 KRN28 5.01 172.26-181.11 11,733,612-13,003,041 5 8.97 KRN29 5.05 440.34-449.93 185,561,749-189,463,674 6 8.27 KRN30 5.05 404.9-410.8 175,676,893-180,186,824 6 11.82 KRN31 5.03-5.04 297.5-305.17 78,362,776-84,252,685 4 9.98 KRN32 8.02 153.3-157.57 16,951,357-18,202,247 6 12.14 KRN33 8.03 293.77-295.91 104,279,060-104,774,930 5 8.7 KRN34 8.06 409.62-439.67 138,853,275-164,088,415 2 9.4 KRN35 9.03 240.5-257.6 89,923,716-102,441,499 7 8.42
sis linked to QTL and expression-based information.
Meta-QTL of KRN trait
In this study, we collected and reallocated 207 QTL of KRN from myriads of individuals studies via meta-analysis pathway, and a total of 35 KRN MQTL were identified. Generally, the more initial QTL in the
MQTL, the higher reliability is. Twenty-two (62.8%) MQTL were integrated more than 3 initial QTL, and 9 (25.7%) MQTL integrated more than 5 initial QTL, with an average of 3.5 initial QTL. Among these KRN MQTL, the MQTL of KRN9 possessing the most initial QTL (9 QTL) were mapped on chromosome
10 (bin10.07). The MQTL of KRN8 possessing the
highest R2 (16.26%) were mapped on chromosome
10 (bin10.03). Furthermore, 3 (8.5%) out of all KRN MQTL were overlapped with MQTL for GY, which were some common and overlapped intervals in
pre-vious research relevant to GY trait (Martinez et al,
2016; Wang et al, 2016).
Compared to the previously published genes associated with KRN, three reported genes were
mapped in these MQTL intervals, including ub2 (bin
1.06) involved in KRN (Chuck et al, 2014), ct2 (bin
1.01) resulted in fasciated ear (Bommert et al, 2013a)
and zfl2 (bin 2.02) controlling KRN (Bomblies et al,
2003). Meanwhile, the cloned genes td1 (Bommert et
al, 2005), fea2 (Taguchi-Shiobara et al, 2001), fea4 (Je et al, 2016), and ub3 (Chuck et al, 2014) associated with KRN were not able to be mapped in the MQTL intervals in this study. It may be because the clone’s genetic materials coming from specific genetic
back-ground. Generally, the genetic R2 of the consistency
of QTL under various genetic backgrounds were not
high, while those QTL exhibiting high R2 values were
parent-of-origin specific QTL.
Candidate genes mining of KRN Meta-QTL
QTL mapping and cloning of the corresponding
genes were an effective way to elucidate the molecu-lar mechanism. Although a lot of QTL were identified in previous experiments, the genes underlying QTL had only been cloned in a few cases, particularly for minor QTL. In many cases, the major QTL region typi-cally contained minor QTL clusters, and the pheno-type of traits is controlled by polygenes. The tradition-al way was difficult to perform in-depth case-study research. RNA-seq technology provided a solution.
For example, Eveland et al (2014) revealed regulatory
modules controlling maize inflorescence architecture by RNA-seq technologies, and provided compre-hensive insight into the developmental dynamics of gene expression for inner ear morphogenesis.
Inter-estingly, the number of known genes, including ub2,
ub3 and zfl2, controlling KRN trait that had
expres-sion of FPKM between > 6.62 and < 65.37 in 1-mm ear stage. The genes related to abnormal ear
mor-phology, including ra1, ra2, ra3, ct2, fea2, fea3, and
fea4, had expression of FPKM between > 2.30 and
< 67.66. FPKM value was far less than that of high-est value (GRMZM2G153292; 4,006.72). The results show that the FPKM value of key genes response for significant morphological changes was not the higher the better and might be around the average of 13.45.
Bomblies K, Wang RL, Ambrose BA, Schmidt RJ, Meeley RB, Doebley J, 2003. Duplicate FLORI-CAULA/LEAFY homologs zfl1 and zfl2 control in-florescence architecture and flower patterning in maize. Development 130: 2385-2395
Bommert P, Je BI, Goldshmidt A, Jackson D, 2013a. The maize Galpha gene COMPACT PLANT2 func-tions in CLAVATA signalling to control shoot meri-stem size. Nature 502: 555-558
Bommert P, Nagasawa NS, Jackson D, 2013b. Quan-titative variation in maize kernel row number is controlled by the FASCIATED EAR2 locus. Nat Genet 45: 334-337
Bommert P, Nardmann J, Vollbrecht E, Running M, Jackson D, Hake S, Werr W, 2005. Thick tassel dwarf1 encodes a putative maize ortholog of the Arabidopsis CLAVATA1 leucine-rich repeat re-ceptor-like kinase. Development 132: 1235-1245 Cai HG, Chu Q, Gu RL, Yuan LX, Liu JC, Zhang XZ,
Chen FJ, Mi GH, Zhang FS, 2012. Identification of QTLs for plant height, ear height and grain yield in
maize (Zea mays L.) in response to nitrogen and
phosphorus supply. Plant Breeding 131: 502-510 Cai LC, Li K, Yang XH, Li JS, 2014. Identification of
large-effect QTL for kernel row number has po-tential for maize yield improvement. Mol Breed 34: 1087-1096
Calderón Claudia I, Yandell Brian S, Doebley John F, 2016. Fine Mapping of a QTL Associated with Kernel Row Number on Chromosome 1 of Maize. PloS One 11: e0150276
Chardon F, Virlon B, Moreau L, Falque M, Joets J, Decousset L, Murigneux A, Charcosset A, 2004. Genetic architecture of flowering time in maize as inferred from quantitative trait loci meta-analysis and synteny conservation with the rice genome. Genetics 168: 2169-2185
Choe E, Rocheford TR, 2012. Genetic and QTL anal-ysis of pericarp thickness and ear architecture traits of Korean waxy corn germplasm. Euphytica 183: 243-260
Chuck GS, Brown PJ, Meeley R, Hake S, 2014. Maize SBP-box transcription factors unbranched2 and unbranched3 affect yield traits by regulating the rate of lateral primordia initiation. P Natl Acad Sci 111: 18775-18780
Coque M, Gallais A, 2006. Genomic regions involved in response to grain yield selection at high and low nitrogen fertilization in maize. Theor Appl Genet 112: 1205-1220
Cui RF, Han JK, Zhao SZ, Su KM, Wu F, Du XQ, Xu QJ, Chong K, Theißen G, Meng Z, 2010. Func-tional conservation and diversification of class E
floral homeotic genes in rice (Oryza sativa). Plant
J 61: 767-781
Darvasi A, Soller M, 1997. A simple method to cal-culate resolving power and confidence interval of QTL map location. Behav Genet 27: 125-132 Du Z, Zhou X, Ling Y, Zhang ZH, Su Z, 2010. agriGO:
Applications of meta-QTL in MAS
MAS technologies were significantly contribut-ing in increascontribut-ing accuracy in selection and breedcontribut-ing work to improve the efficiency of breeding practice, which was the trend of molecular breeding strategies. In recent years, the success of MAS for genetic im-provement of yield related traits had been reported in
maize and rice (Liang et al, 2004; Stuber et al, 1987).
Meta-QTL originated from different genetic back-grounds, growth environments and types of molecu-lar markers contained clear indication of QTL location and the interactions of environment-environment and gene-environment could improve efficiency in MAS. Particularly, the QTL-rich regions related to various traits had higher efficiency of selection. There were also three overlapping intervals in our study. In sum-mary, these «hot bins» may be the pleiotropic regions character of yield and yield components, which could take a shortcut for the MAS breeding.
In comparison to QTL mapping of important ag-ronomic traits, the gene cloning could be more useful to understand the molecular mechanism and genetic improvement of a trait, which is also the foundation of breeding by design. All identified candidate genes for KRN in maize, especially, those genes with conserved ortholog in closely related species, might have a po-tential influence on elucidating the molecular mecha-nisms of morphogenesis and increasing the breeding efficiency by marker-assisted selection based on the functional marker.
Acknowledgements
This research was supported by the National Ba-sic Research Program of China (the «973» project, 2014CB138203), National Natural Science Founda-tion of China (31101161) and the State Key Labora-tory of Grassland Agro-ecosytems (SKLGAE201509).
References
Austin DF, Lee M, 1996. Comparative mapping in F2:3 and F6:7 generations of quantitative trait loci for grain yield and yield components in maize. Theor Appl Genet 92: 817-826
Ballini E, Morel JB, Droc G, Price A, Courtois B, Not-teghem JL, Tharreau D, 2008. A genome-wide meta-analysis of rice blast resistance genes and quantitative trait loci provides new insights into partial and complete resistance. Mol Plant Mi-crobe In 21: 859-868
Barrière Y, Méchin V, Denoue D, Bauland C, Laborde J, 2010. QTL for yield, earliness, and cell wall quality traits in topcross experiments of the F838 × F286 early maize RIL progeny. Crop Sci 50: 1761-1772
Bomblies K, Doebley JF, 2006. Pleiotropic effects of the duplicate maize FLORICAULA/LEAFY genes zfl1 and zfl2 on traits under selection during maize domestication. Genetics 172: 519-531
Quantitative trait loci mapping for kernel row number using chromosome segment substitution lines in maize. Genet Mol Res 13: 1707-1716 Li JZ, Zhang ZW, Li YL, Wang QL, Zhou YG, 2011.
QTL consistency and meta-analysis for grain yield components in three generations in maize. Theor App Genet 122: 771-782
Li M, Guo XH, Zhang M, Wang XP, Zhang GD, Tian YC, Wang ZL, 2010a. Mapping QTLs for grain yield and yield components under high and low
phosphorus treatments in maize (Zea mays L.).
Plant Sci 178: 454-462
Li PH, Ponnala L, Gandotra N, Wang L, Si YQ, Tausta SL, Kebrom TH, Provart N, Patel R, Myers CR, 2010b. The developmental dynamics of the maize leaf transcriptome. Nat Genet 42: 1060-1067 Li WT, Liu CJ, Liu YX, Pu ZE, Dai SF, Wang JR, Lan
XJ, Zheng YL, Wei YM, 2013. Meta-analysis of QTL associated with tolerance to abiotic stresses in barley. Euphytica 189: 31-49
Li YL, Li XH, Li JZ, Fu JF, Wang YZ, Wei MG, 2009. Dent corn genetic background influences QTL detection for grain yield and yield components in high-oil maize. Euphytica 169: 273-284
Li YL, Niu SZ, Dong YB, Cui DQ, Wang YZ, Liu YY, Wei MG, 2007. Identification of trait-improving quantitative trait loci for grain yield components from a dent corn inbred line in an advanced back-cross BC2F2 population and comparison with its F2: 3 population in popcorn. Theor Appl Genet 115: 129-140
Liang FS, Deng QY, Wang YG, Xiong YD, Jin DM, Li JM, Wang B, 2004. Molecular marker-assisted selection for yield-enhancing genes in the proge-ny of «9311 × O. rufipogon» using SSR. Euphytica 139: 159-165
Liu L, Du YF, Shen XM, Li MF, Sun W, Huang J, Liu ZJ, Tao YS, Zheng YL, Yan JB, 2015. KRN4 Con-trols Quantitative Variation in Maize Kernel Row Number. PLoS Genet 11: e1005670
Liu XH, He SL, Zheng ZP, Huang YB, Tan ZB, Wu X, 2010. QTL identification for row number per ear and grain number per row in maize. Maydica 55: 127-133
Liu Y, Wang LW, Sun CL, Zhang ZX, Zheng YL, Qiu FZ, 2014. Genetic analysis and major QTL detec-tion for maize kernel size and weight in multi-envi-ronments. Theor Appl Genet 127: 1019-1037 Liu ZH, Ji HQ, Cui ZT, Wu X, Duan LJ, Feng XX, Tang
JH, 2011. QTL detected for grain-filling rate in maize using a RIL population. Mol Breed 27: 25-36
Lu M, Xie CX, Li XH, Hao ZF, Li MS, Weng JF, Zhang DG, Bai L, Zhang SH, 2011. Mapping of quan-titative trait loci for kernel row number in maize across seven environments. Mol Breed 28: 143-152
Lv XL, Li XH, Xie CX, Hao ZF, Ji HL, Shi LY, Zhang SH, 2008. Comparative QTL mapping of resis-a GO resis-anresis-alysis toolkit for the resis-agriculturresis-al
commu-nity. Nucleic Acids Res: gkq310
Eveland AL, Goldshmidt A, Pautler M, Morohashi K, Liseron-Monfils C, Lewis MW, Kumari S, Hiraga S, Yang F, Unger-Wallace E, 2014. Regulatory modules controlling maize inflorescence architec-ture. Genome Res 24: 431-443
Fu JJ, Cheng YB, Linghu JJ, Yang XH, Kang L, Zhang ZX, Zhang J, He C, Du XM, Peng ZY, 2013. RNA sequencing reveals the complex regulatory net-work in the maize kernel. Nat Commun 4
Goffinet B, Gerber S, 2000. Quantitative trait loci: a meta-analysis. Genetics 155: 463-473
Guo B, Sleper DA, Lu P, Shannon JG, Nguyen HT, Arelli PR, 2006. QTLs associated with resistance to soybean cyst nematode in soybean: meta-analysis of QTL locations. Crop Sci 46: 595-602 Guo JJ, Chen ZL, Liu ZP, Wang BB, Song WB, Li
W, Chen J, Dai JR, Lai JS, 2011. Identification of genetic factors affecting plant density response through QTL mapping of yield component traits
in maize (Zea mays L.). Euphytica 182: 409-422
Hanocq E, Laperche A, Jaminon O, Lainé AL, Le Gouis J, 2007. Most significant genome regions involved in the control of earliness traits in bread wheat, as revealed by QTL meta-analysis. Theor Appl Genet 114: 569-584
Ho J, McCouch S, Smith M, 2002. Improvement of hybrid yield by advanced backcross QTL analysis in elite maize. Theor Appl Genet 105: 440-448 Huang YF, Madur D, Combes V, Ky CL, Coubriche D,
Jamin P, Jouanne S, Dumas F, Bouty E, Bertin P, 2010. The genetic architecture of grain yield and
related traits in Zea mays L. revealed by
compar-ing intermated and conventional populations. Ge-netics 186: 395-404
Hung HY, Shannon LM, Tian F, Bradbury PJ, Chen C, Flint-Garcia SA, McMullen MD, Ware D, Buckler ES, Doebley JF, 2012. ZmCCT and the genetic basis of day-length adaptation underlying the postdomestication spread of maize. Proc Natl Acad Sci USA 109: E1913-E1921
Ikeda-Kawakatsu K, Maekawa M, Izawa T, Itoh JI, Nagato Y, 2012. ABERRANT PANICLE ORGANI-ZATION 2/RFL, the rice ortholog of Arabidopsis LEAFY, suppresses the transition from inflores-cence meristem to floral meristem through inter-action with APO1. Plant J 69: 168-180
Je BI, Gruel J, Lee YK, Bommert P, Arevalo ED, Eve-land AL, Wu QY, Goldshmidt A, Meeley R, Bartlett M, 2016. Signaling from maize organ primordia via FASCIATED EAR3 regulates stem cell prolif-eration and yield traits. Nat Genet 48(7): 785-791 Karen Sabadin P, Lopes de Souza Júnior C, Pereira
de Souza A, Augusto Franco Garcia A, 2008. QTL mapping for yield components in a tropical maize population using microsatellite markers. Heredi-tas 145: 194-203
Tian BH, Wang JH, Wang GY, 2014. Confirmation of a major QTL on chromosome 10 for maize ker-nel row number in different environments. Plant Breeding 133: 184-188
Upadyayula N, Da Silva HS, Bohn MO, Rocheford TR, 2006. Genetic and QTL analysis of maize tas-sel and ear inflorescence architecture. Theor App Genet 112: 592-606
Veldboom LR, Lee M1, 1994. Molecular-marker-fa-cilitated studies of morphological traits in maize. II: Determination of QTLs for grain yield and yield components. Theor Appl Genet 89: 451-458 Wang HH, Zhang L, Cai Q, Hu Y, Jin ZM, Zhao XX,
Fan W, Huang QM, Luo ZJ, Chen MJ, 2015. Os-MADS32 interacts with PI-like proteins and regu-lates rice flower development. J Integr Plant Biol 57: 504-513
Wang YJ, Xu J, Deng DX, Ding HD, Bian YL, Yin ZT, Wu YR, Zhou B, Zhao Y, 2016. A comprehensive meta-analysis of plant morphology, yield, stay-green, and virus disease resistance QTL in maize (Zea mays L.). Planta 243: 459-471
Xiang K, Reid LM, Zhang ZM, Zhu XY, Pan GT, 2012. Characterization of correlation between grain moisture and ear rot resistance in maize by QTL meta-analysis. Euphytica 183: 185-195
Xu J, Liu YX, Liu J, Cao MJ, Wang J, Lan H, Xu YB, Lu YL, Pan GT, Rong TZ, 2012. The genetic architec-ture of flowering time and photoperiod sensitiv-ity in maize as revealed by QTL review and meta analysis. J Integr Plant Biol 54: 358-373
Yan JB, Tang H, Huang YQ, Zheng YL, Li JS, 2006. Quantitative trait loci mapping and epistatic anal-ysis for grain yield and yield components using molecular markers with an elite maize hybrid. Eu-phytica 149: 121-131
Yang C, Tang DG, Zhang L, Liu J, Rong TZ, 2015. Identification of QTL for ear row number and two-ranked versus many-two-ranked ear in maize across four environments. Euphytica 206: 33-47
Yang GH, Li YL, Wang QL, Zhou YG, Zhou Q, Shen BT, Zhang FF, Liang XJ, 2012. Detection and in-tegration of quantitative trait loci for grain yield components and oil content in two connected recombinant inbred line populations of high-oil maize. Mol Breed 29: 313-333
Yu Y, Li G, Yang Z, Hu J, Zheng J, Qi X, 2014. Iden-tification of a major quantitative trait locus for ear size induced by space flight in sweet corn. Genet Mol Res 13: 3069-3078
tance to sugarcane mosaic virus in maize based on bioinformatics. Hereditas 30: 101-108
Martinez AK, Soriano JM, Tuberosa R, Koumproglou R, Jahrmann T, Salvi S, 2016. Yield QTLome dis-tribution correlates with gene density in maize. Plant Sci 242: 300-309
Messmer R, Fracheboud Y, Bänziger M, Vargas M, Stamp P, Ribaut JM, 2009. Drought stress and tropical maize: QTL-by-environment interactions and stability of QTLs across environments for yield components and secondary traits. Theor Appl Genet 119: 913-930
Miles C, Wayne M, 2008. Quantitative trait locus (QTL) analysis. Nature Education 1: 208
Peng B, Li YX, Wang Y, Liu C, Liu ZZ, Tan WW, Zhang Y, Wang D, Shi YS, Sun BC, 2011. QTL analy-sis for yield components and kernel-related traits in maize across multi-environments. Theor Appl Genet 122: 1305-1320
Ribaut JM, Fracheboud Y, Monneveux P, Banziger M, Vargas M, Jiang CJ, 2007. Quantitative trait loci for yield and correlated traits under high and low soil nitrogen conditions in tropical maize. Mol Breed 20: 15-29
Rosenberg MS, Garrett KA, Su Z, Bowden RL, 2004. Meta-analysis in plant pathology: synthesizing re-search results. Phytopathology 94: 1013-1017 Somers D, Gyenis L, Yun SJ, Smith KP, Steffenson
BJ, Bossolini E, Sanguineti MC, Muehlbauer GJ, 2007. Genetic architecture of quantitative trait loci associated with morphological and agronom-ic trait differences in a wild by cultivated barley cross. Genome 50: 714-723
Sosnowski O, Charcosset A, Joets J, 2012. BioMer-cator V3: an upgrade of genetic map compilation and quantitative trait loci meta-analysis algo-rithms. Bioinformatics 28: 2082-2083
Stone JM, Trotochaud AE, Walker JC, Clark SE, 1998. Control of meristem development by CLA-VATA1 receptor kinase and kinase-associated protein phosphatase interactions. Plant Physiol 117: 1217-1225
Stuber CW, Edwards MD, Wendel JF, 1987. Molecu-lar marker-facilitated investigations of quantitative trait loci in maize. II: Factors influencing yield and its component traits. Crop Sci 27: 639-648 Taguchi-Shiobara F, Yuan Z, Hake S, Jackson D,
2001. The fasciatedear2 gene encodes a
leucine-rich repeat receptor-like protein that regulates shoot meristem proliferation in maize. Genes Dev 15: 2755-2766
Tang JH, Yan JB, Ma XQ, Teng WT, Wu WR, Dai JR, Dhillon BS, Melchinger AE, Li JS, 2010. Dissec-tion of the genetic basis of heterosis in an elite maize hybrid by QTL mapping in an immortalized F2 population. Theor Appl Genet 120: 333-340