Measuring the Efficiency of Public Schools using Data
Envelopment Analysis – An Exploratory Study
Masood Badri
United Arab Emirates University (Seconded to ADEC),P. O Box 36005, Abu Dhabi, United Arab Emirates [email protected]
Jihad Mohaidat
Abu Dhabi Education Council, P. O. Box 36005, Abu Dhabi, UAE [email protected]
Tarek El Mourad
Abu Dhabi Education Council, P. O. Box 36005, Abu Dhabi, UAE [email protected]
The research is financed by the Abu Dhabi Education Council Abstract
We explore measuring and comparing the efficiency of selected Abu Dhabi secondary public schools using data envelopment analysis. For better identification and specification, certain scenarios were developed using different combinations of inputs and outputs. Sensitivity analysis was carried out to identify expected reductions (in inputs) or increases (in outputs) needed for inefficient schools to become efficient. The inputs with greatest impact were cost per teacher and cost per students. The outputs with greatest impact were two student tests conducted at the national level. Analysis of variance showed that location and type of school had a significant impact on school efficiencies.
Keywords: School efficiency, Data Envelopment Analysis, Abu Dhabi 1. Introduction
Education is a priority area for Abu Dhabi government. It is important in the performance assessment process to know to what extent schools are achieving their stated missions and expectations. Abu Dhabi schools system has never had a comprehensive performance plan that compares schools relative to each other in an objective and scientific manner. Every year, the results of national exams at the end of secondary school, which are used as entry requirements for higher education, have been made publicly available. These results are usually used to rank the secondary schools by several newspapers, and usually a highly debated issue when it comes to school performance, school choice, and the perverse effects of such simplistic ranking system. Analysis of performance in Abu Dhabi has to be contextualized with the relative maturity of the concept for the country and level of implicit understanding by the stakeholders.
Public schools in Abu Dhabi are non-profit organizations (government funded units). As a result, and as Hu et al. (2009) point out, “government funded schools do not have any motivation to cost accounting and cost minimization”. If resource optimization is important, schools should change their policies on the utilization of these resources. On the other hand, with regard to student outcomes, schools were never pressured to do more to raise standards and expectations. Student outcome data was available to the public, but on aggregate basis. As a result, parents could not make a choice of better performing schools for their children. Since 2009, parents could get any information they needed about their children’s schools. Performance-based school reform has received much attention in the recent years. Key elements of Abu Dhabi school reform include setting standards for students, teachers and school performance, granting autonomy to local participants in the educational process, and establishing a merit system based on school performance. Performance-based school reform attempts to provide stronger incentives for improving student performance by developing measures of achievement and linking financial and other rewards to those measures. Developing valid and reliable measures of school performance is crucial for both the efforts to establish incentives and to the assessment of management practices.
In the past, evaluating public schools’ efficiency and performance in Abu Dhabi were generally hampered by either lack of data or problems with the quality of the data. Only in 2008, a complete student information system (eSIS) was put in place. The eSIS is in its second phase, and the completion of the system might take several years. It is hoped that this study will contribute towards a better understanding of the Abu Dhabi situation in terms of public school performance and to inform the debate on school evaluation, performance improvement, and policy setting.
DEA offers clear advantages over other methods as a source of information in determining the efficiency of organizations that produce multiple outputs (Banker et al., 1989; Banker, et al., 1986; Bowlin, et al.,
1985; Charnes, et al., 1989). DEA is a linear programming based technique which is applied to assess the efficiency of organizations such as universities, schools, bank branches, hospitals, power plants, police stations, tax offices, prisons, and manufacturing units which often use multiple resources (inputs) to achieve multiple goals (outputs). The methodology measures the relative efficiency without prior assumption of input-output weights.
DEA is used in this study as an exploration to examine its applicability to calculate the relative efficiency scores of public schools of Abu Dhabi. A further aim of this study is to give school-wise planning information to improve their efficiency. Because of the lack of clear definition of the factors that reflect the performance of schools and to assess in a more rigorous approach of evaluation, this study will explore using several model variants with available inputs and outputs. Both internal and external factors are considered in these proposed evaluation models. Because of statistical features of the inputs and outputs, only the justified ones would be utilized.
The objective of this paper is to assess the schools’ efficiency to some extent in the presence of multiple inputs and outputs by using DEA. Other statistical methods will also be employed to shed light on the understanding of the nature of relationships between the inputs and outputs used in the study. The study would explore the contribution of certain factors to the school efficiencies in Abu Dhabi. The understanding of the nature of these factors should provide a better understanding of the overall production function related to school efficiencies. The main approach of this study could be summarized in the following steps:
1. Identify an appropriate list of input and output variables for evaluating the efficiencies of Abu Dhabi secondary public schools in the urban areas.
2. Assess the relationship between the input and output variables. 3. Assess the relationship among the input variables.
4. Assess the relationship among the output variables.
5. Identify appropriate output/input models of DEA of efficiencies of Abu Dhabi secondary public schools in urban areas.
6. Compute the efficiencies of the Abu Dhabi secondary public schools in urban areas:
a. analyze the potential improvements for inefficient schools and the contribution percentage of each input or output;
b. Identify peer schools for each inefficient unit.
7. Perform Post-hoc analysis by conducting statistical significance tests to compare schools based on their efficiencies according to geographic location, school gender, and school type.
8. Identify the effect of inputs and outputs variables on school efficiencies.
As a precaution, it should be understood that study represents only an exploration into the nature of using DEA in measuring the efficiency of public schools in Abu Dhabi. There are many limitations with regard to sample size, specification problems, and other factors. As a result, the outcome from this specific application should be treated with caution. The nature of these limitations will be addressed.
1.1 The Abu Dhabi education system
Public education in Abu Dhabi is divided into three groups: Cycle 1 (Grades 1-5); Cycle 2 (Grades 6-9); and Cycle 3 (Grades 10-12). Abu Dhabi’s 296 public schools have been at the center of a transformational reform agenda to elevate student performance and education delivery to international standards. The reform effort spans all areas of education from the physical environment and resources, curriculum, assessment, teaching methods, and health and wellbeing. The public sector reform effort is driven by the Abu Dhabi Education Council’s (ADEC) 10-Year Strategic Plan which identifies four main priorities: elevating school quality, improving access to P-12 education, providing affordable options of high-quality private education, and focusing on national identity and career development.
There are three main public school types in Abu Dhabi, public-private partnership (PPP) schools, model schools and government schools. The PPP initiative is designed to use the expertise of private school operators in enhancing public schools operations. Private operator teams work onsite at schools to support enhanced teaching methods and higher curriculum standards. There are 25 Model Schools in the Emirate of Abu Dhabi, covering both primary and secondary education. Model schools have conditions on student achievements, and teacher qualifications. Students are supposed to maintain a certain average every year. However, the new school model aims at unifying these school types in 2-5 years. Since 2009, all urban-secondary-public schools in Abu Dhabi are either PPP or model. However, in 2010, a decision was taken to unify the public school system in Abu Dhabi under one model called the New School Model (NSM). This is implemented in 2011.
In 2011, ADEC initiated its new school model (NSM). All Abu Dhabi schools should be transformed to NSM in 5 years. The NSM is a new approach to learning that will confront existing challenges in the public school sector to drive tangible and specific improvements in education delivery. It is intended as a comprehensive foundation for learning that will enable desired student outcomes by developing major
components of the educational experience: teaching quality, learning environment, school leadership, and parental involvement. Within this model, a new curriculum and new teaching methods will be introduced in order to develop the student as a creative independent thinker and problem-solver. The New School Model (NSM) is grounded in two core beliefs: that all students are capable of learning, and that the teacher is responsible for student learning. This seemingly simple philosophy is the basis for an approach to education that makes educators accountable for ensuring that each and every individual is able to develop to his or her maximum potential through developing specific talents and concentrating on individual areas of improvement.
All schools are government funded. ADEC is responsible for recruiting and hiring staff, principals and teachers. The ADEC strategic plan outlines many student achievement outcomes along with resources utilized as KPI’s. Currently, ADEC decides (as a regulator and operator) on resources for each school. However, the strategic plan is calling for ADEC to have a regulatory role only in few years. ADEC has put many plans and initiatives to provide government schools with the know-how to gradually take the operation responsibility from ADEC. It should be noted that the resources available to each schooling system varies. These variations are hypothesized to affect student achievements, and hence, school efficiencies.
The sources for school inefficiency could vary from school to another. These sources might include inputs, outputs, or misallocation of resources. In this paper, we explore school efficiencies (or inefficiencies) from an empirical perspective.
2. Background and review
2.1 School efficiency measurement: The DEA approach
DEA was developed by Charnes et al. (1978) to evaluate public sector and not-for-profit organizations. DEA compares each decision-making unit (DMU) with all other DMUs in a set of DMUs, and calculates an aggregate performance measure based on a ratio of outputs and inputs. DEA can deal with multiple inputs and outputs for measuring the performance of each DMU. With this information, the DEA model determines the observed frontier of performance, based on the units with 100 per cent performance – all those units that perform better relative to all others in the set of units. DEA can also identify areas for improvement of performance for each unit (relative to the observed performance at the frontier), comparing the practice of the units on the frontier with the practice of the units below it (Sarrico et al., 2010). The sharing of the best practice of the units on the frontier with the units below it allows an opportunity for the units with worse performance to improve and, thus, improve the performance of the whole set. The repeated use of DEA helps to establish an environment of organizational learning.
Many studies report on using DEA to measure performance of schools (Coelho et al., 2007; Mayston, 2003; Dyson, 2000). In fact, DEA was used in many countries to measure the efficiency of schools. Most studies concluded that DEA is applicable to efficiency measurement of schools in the sense that it detects differences among schools and its results are fairly robust (i.e., USA [Bessent and Bessent, 1980; Bessent et al., 1982, 1983, 1984; Ludwin and Guthrie, 1989; Fare et al., 1989; Sengupta, 1987; Sengupta and Sfeir, 1986, 1988; Ray, 1991; Ganley and Cubbin, 1992; Ruggiero, 1996, 1999, 2004; Engert, 1996; Duncombe et al., 1997; Chalos and Cherian, 1995; Chalos, 1997; Grosskopf et al., 1999; Grosskopt et a., 2001; Rassouli-Currier, 2007; Christie et al., 2010]; [UK (Jesson et al., 1987; Mayston, 1996; Mancebon and Mar-Molinero, 2000; Bradley et al., 2001; Thanassoulis and Dunstan, 1994; Bates, 1997)]; [Norway (Bonesrqnning and Rattsq, 1992, 1994)]; [Finland (Kirjavainen and Loikkanen, 1998)]; [Spain (Muniz, 2002)]; [Sweden (Waldo, 2007)]; [Portugal (Sarrico et al., 2010)]; [Cyprus (Soteriou et al., 1998)]; [China (Hu et al., 2009; Ng and Li, 2009)]; and [Tunisia (Essid et al., 2010)].
Some studies went beyond just measuring school efficiencies. Bradley et al. (2001) calculated the technical efficiencies of all secondary schools in England over the period 1993-1998, and estimated models to examine the determinants of efficiency in a particular year and the change of efficiency over the period. They also found that competition was an important determining factor of school efficiency over time. Fare et al., (1989) used DEA to assess the performance of school districts in Missouri. They did not only allow for variable returns-to-scale by employing the Banker et al (1984) formulation, but also used ‘jack-knifing’ techniques to reduce the impact of outliers on efficiency measures. Ng and Li (2000) used DEA to examine the effectiveness of China Education Reform in the mid-1980 with the data from 84 institutions, and outlined a different efficiency change pattern.
2.2 Input variables
The literature on educational inputs is plentiful. The inputs are divided into two categories. These are endogenous inputs that can be controlled by schools and exogenous inputs that cannot be controlled by schools. It seems that human and school resources are the two main endogenous determinants affecting school efficiency emerging from studies on school efficiency. The operating expenses and the teaching staff are the most frequently selected inputs for educational processes (Ruggiero, 1998; Madaus et. al. 1979; Mancebon & Bandres,
1999; Mancebon and Banders, 2001). Rutter and Maughan (2002) provide a more comprehensive list of inputs. They involve school management that includes good leadership that provides strategic vision, staff participation with a shared vision and goal, and appropriate rewards. They also involve ethos qualities such as an orderly atmosphere, attractive working environment, shared high expectations and good teacher-student relationships. In addition, other factors include effective monitoring that means regular measurement of student performance, assessment of teacher efficiency and evaluation of overall school performance. Other components include good classroom management that is efficient lessons, clarity of purposes and contents in these lessons; and the pedagogic qualities such as effective teaching, active participation from students, maximization of learning time and the like. Thanassoulis (1999) and Rutter and Maughan (2002) agree to the decisive importance of this category of inputs to student performance. Sammons et al (1996) find that these factors such as student prior attainment, gender, ethnicity and free school meals are statistically significant, contributing about 44.5% of the variation in student academic achievement. Mancebon and Badres (1999) suggest the inclusion of ‘socio-economic component’, ‘human capital component’ and ‘aspiration component’ for the estimation of school efficiency, which account for 74% of the variance in student academic achievement. However, Rutter and Maughan (2002) report that the influence of school related factors can have a stronger impact on academic performance than those of student related factors.
In addition to direct teaching inputs, several studies have attempted to incorporate non-labor inputs, often with the dollar value of non-teaching expenditure. For example, Smith and Mayston (1987) divided total expenditure into a teaching and non-teaching component, while Deller and Rudnicki (1993) used categories of instructional, administrative, operational and busing expenditure. The division of expenditures into finer categories is likely to illuminate particular aspects of educational efficiency that deserve attention. Sengupta and Sfeir (1988) used average teaching salaries for the price of labor and Barrow (1991) specified a re-pricing index for educational expenditure. Ray (1991) for example, specified the number of classroom teachers, support and administrative staff as inputs into the high school education process.
2.3 Output variables
One of the obstacles encountered by studies on school efficiency is the conceptualization and measurement of outputs (Soteriou et al., 1998; Waldo, 2007). However, most studies established the importance of academic performance in this efficiency evaluation (Madaus et. Al. 1979, Mancebon & Bandres, 1999). Mancebon and Bandres (1999) suggest that the variables selected for academic performance must reflect both the quantity and quality of the academic standards achieved by schools. For quantity, one of the suggestions is the proportion of students passing an examination. The marks obtained by students in the subjects that form the curriculum is the variable most supported in the literature for quality. Charnes et al (1981) and Bessent et al. (1982) reported that the preferred specification of educational outcomes in most of the empirical literature has been student test scores. Senupta (1987) used average test scores in reading, mathematics, writing and spelling, McCarty and Yaisawarng (1993) specified passing students in mathematics, reading and writing proficiency, and Chalos and Cherian (1995) and Chalos (1997) employed verbal and math test scores. Studies by Ruggiero (1996) of New York State schools also specified social studies test scores, and Ray (1991) who added language and arts performance in an analysis of Connecticut high schools. However, the specification of output also varies enormously according to the chosen educational context. For instance, Diamond and Medewitz (1990) evaluated an economic education program using the ‘Test for Economic Literacy’, while most U.K. studies have concentrated upon the percentage of school leavers attaining ‘A’ levels and graded ‘O’ levels [see, for example, Smith and Mayston (1987), Ganley and Cubbin (1992) and Bates (1997)].
Of course, all of these output measures concentrate on intermediate educational outcomes, though there is an increasing tendency to specify longer-term educational benefits in more recent work. For example, Fare et al. (1993) followed up their study with post-secondary grades, incomes and education, Engert (1996) included post-secondary college entrance, and Haksevevr and Muragishi (1998) viewed starting salaries and the employment of graduating students as the most appropriate output for the MBA programs. The study by Fare et al., (1993) ‘High School and Beyond’ program simultaneously assessed the performance of schools in generating educational opportunities, as well as intermediate and long-term educational achievement. Educational outcomes were proxied in the short-term by the number of classes taken and extracurricular activity, by follow-up test scores in the intermediate term, and by post-secondary income and educational attainment in the long-term. Engbert (1996) also used a temporal ‘value-added’ approach to educational output by including basic competency, diploma attainment and college entrance in a study of New York schools. Another set of frontier efficiency measurement studies that deserves particular attention is the instances where educational outputs are jointly produced with (strictly) non-educational outcomes (Johnes and Johnes, 1993, 1995; Beasley, 1990, 1995; Madden et al., 1997). Other studies suggest that school beautification activities, sports and other co-curriculum activities are also desirable outputs (Thanassoulis, 2001; Thanassoulis & Dunstan, 1994, Lovell et al, 1993).
Beasely (1995), the current study has considered school related variables as inputs and test scores as outputs. To assess the intuitive picture of performance and to measure the dependency of efficiency on different variables we consider several models with different input-output combinations. The guiding principle in construction of these models is to proceed from simple one (with less number of input-output variables) to more complicated ones (with greater number of variables). This strategy of running several models enables testing the robustness of the results since the DEA methodology does not have a statistical method for testing hypotheses. The utilization of DEA in measuring school performance is highly dependent on the availability of data that, frequently, is not available. It is important to note that a performance measurement model such as DEA will assure the consistency and comparability of the standards used: and the validity values of the educational performance measures for each school compared across schools.
3. Methods
3.1 Data and study sample
Data for the academic year 2009-2010 on Abu Dhabi public schools was collected from the ADEC’s database of public schools, from its ERP system, and from the electronic student information System (eSIS). Since there are many distinguishing features among Abu Dhabi schools, the study established a set of requirements to make the list of schools (DMU’s) more homogeneous. The study focused on schools that met the following four criteria:1) An Abu Dhabi public school; 2) secondary level (or high schools); 3) located in urban areas of the three education zones in Abu Dhabi (Abu Dhabi zone, Al Ain zone, and Al Gharbiah zone); and 4) has been in existence for at least 5 years.
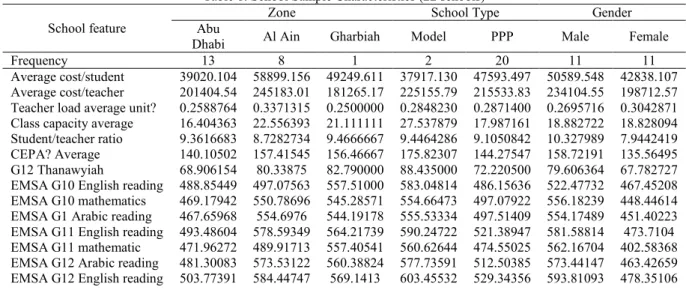
There were 22 schools that met all four requirements. Table 1 provides some details regarding these schools according to location, school type and student gender. The Table shows that average cost per student is highest in Al Ain, for model schools and for male schools. Average cost per teacher is highest in Al Ain, for model schools and for male schools. The unutilized teacher load average is highest in Al Ain, for PPP schools and female schools. The unutilized class capacity of 25 students per class is highest in Al Ain, and for model schools. With regard to outputs, results show that on average, Abu Dhabi scores are the highest. With regard to school type, model schools outperformed PPP’s, and male averages are higher than female averages.
Table 1. School Sample Characteristics (22 schools) School feature
Zone School Type Gender
Abu
Dhabi Al Ain Gharbiah Model PPP Male Female
Frequency 13 8 1 2 20 11 11
Average cost/student 39020.104 58899.156 49249.611 37917.130 47593.497 50589.548 42838.107 Average cost/teacher 201404.54 245183.01 181265.17 225155.79 215533.83 234104.55 198712.57 Teacher load average unit? 0.2588764 0.3371315 0.2500000 0.2848230 0.2871400 0.2695716 0.3042871 Class capacity average 16.404363 22.556393 21.111111 27.537879 17.987161 18.882722 18.828094 Student/teacher ratio 9.3616683 8.7282734 9.4666667 9.4464286 9.1050842 10.327989 7.9442419 CEPA? Average 140.10502 157.41545 156.46667 175.82307 144.27547 158.72191 135.56495 G12 Thanawyiah 68.906154 80.33875 82.790000 88.435000 72.220500 79.606364 67.782727 EMSA G10 English reading 488.85449 497.07563 557.51000 583.04814 486.15636 522.47732 467.45208 EMSA G10 mathematics 469.17942 550.78696 545.28571 554.66473 497.07922 556.18239 448.44614 EMSA G1 Arabic reading 467.65968 554.6976 544.19178 555.53334 497.51409 554.17489 451.40223 EMSA G11 English reading 493.48604 578.59349 564.21739 590.24722 521.38947 581.58814 473.7104 EMSA G11 mathematic 471.96272 489.91713 557.40541 560.62644 474.55025 562.16704 402.58368 EMSA G12 Arabic reading 481.30083 573.53122 560.38824 577.73591 512.50385 573.44147 463.42659 EMSA G12 English reading 503.77391 584.44747 569.1413 603.45532 529.34356 593.81093 478.35106 3.2 Methods and design
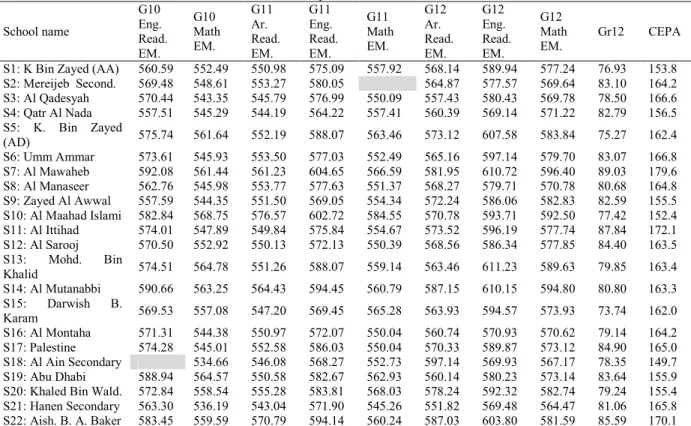
For ADEC secondary public schools, several outputs related to student outcomes are available (Figure 1 and Table 2). These outputs include the following:
• The 12th grade average exit exam results (called Thanawiah). All students in Abu Dhabi, who finish their secondary school, have to sit for an exam at the end of the academic year. This compulsory exam is administered by the Ministry of Education (jointly with ADEC for Abu Dhabi Schools). The results are usually taken by higher education institutions in the UAE as criteria for entering specific colleges and major disciplines.
• The Common Educational Proficiency Assessment (CEPA) average score. CEPA is a joint venture between the National Admissions and Placement Office (NAPO) in the Ministry of Higher Education and Scientific Research and the Federal Higher Education Institutions in the United Arab Emirates. CEPA consists of two tests - an English test and a Math test. For those students who are expected to apply for federal higher education institutions in the UAE, CEPA is required.
• English, Math, Science and Arabic (EMSA) average scores. EMSA test has been used to provide a benchmark to measure actual student progress against the standards and performance levels expected at each grade level. The results are expected to provide information and guidance for individual students, school faculty and administration on their performance relative to other students and schools throughout the Emirate of Abu Dhabi. EMSA is administered by ADEC for all grade levels starting from the 4th grade.
Table 2. Output details for schools School name G10 Eng. Read. EM. G10 Math EM. G11 Ar. Read. EM. G11 Eng. Read. EM. G11 Math EM. G12 Ar. Read. EM. G12 Eng. Read. EM. G12 Math EM. Gr12 CEPA S1: K Bin Zayed (AA) 560.59 552.49 550.98 575.09 557.92 568.14 589.94 577.24 76.93 153.8 S2: Mereijeb Second. 569.48 548.61 553.27 580.05 564.87 577.57 569.64 83.10 164.2 S3: Al Qadesyah 570.44 543.35 545.79 576.99 550.09 557.43 580.43 569.78 78.50 166.6 S4: Qatr Al Nada 557.51 545.29 544.19 564.22 557.41 560.39 569.14 571.22 82.79 156.5 S5: K. Bin Zayed (AD) 575.74 561.64 552.19 588.07 563.46 573.12 607.58 583.84 75.27 162.4 S6: Umm Ammar 573.61 545.93 553.50 577.03 552.49 565.16 597.14 579.70 83.07 166.8 S7: Al Mawaheb 592.08 561.44 561.23 604.65 566.59 581.95 610.72 596.40 89.03 179.6 S8: Al Manaseer 562.76 545.98 553.77 577.63 551.37 568.27 579.71 570.78 80.68 164.8 S9: Zayed Al Awwal 557.59 544.35 551.50 569.05 554.34 572.24 586.06 582.83 82.59 155.5 S10: Al Maahad Islami 582.84 568.75 576.57 602.72 584.55 570.78 593.71 592.50 77.42 152.4 S11: Al Ittihad 574.01 547.89 549.84 575.84 554.67 573.52 596.19 577.74 87.84 172.1 S12: Al Sarooj 570.50 552.92 550.13 572.13 550.39 568.56 586.34 577.85 84.40 163.5 S13: Mohd. Bin Khalid 574.51 564.78 551.26 588.07 559.14 563.46 611.23 589.63 79.85 163.4 S14: Al Mutanabbi 590.66 563.25 564.43 594.45 560.79 587.15 610.15 594.80 80.80 163.3 S15: Darwish B. Karam 569.53 557.08 547.20 569.45 565.28 563.93 594.57 573.93 73.74 162.0 S16: Al Montaha 571.31 544.38 550.97 572.07 550.04 560.74 570.93 570.62 79.14 164.2 S17: Palestine 574.28 545.01 552.58 586.03 550.04 570.33 589.87 573.12 84.90 165.0 S18: Al Ain Secondary 534.66 546.08 568.27 552.73 597.14 569.93 567.17 78.35 149.7 S19: Abu Dhabi 588.94 564.57 550.58 582.67 562.93 560.14 580.23 573.14 83.64 155.9 S20: Khaled Bin Wald. 572.84 558.54 555.28 583.81 568.03 578.24 592.32 582.74 79.24 155.4 S21: Hanen Secondary 563.30 536.19 543.04 571.90 545.26 551.82 569.48 564.47 81.06 165.8 S22: Aish. B. A. Baker 583.45 559.59 570.79 594.14 560.24 587.03 603.80 581.59 85.59 170.1 With respect to the input variables, for ADEC secondary public schools, there are many cost related variables that are available. After careful discussion and considerations with the office of Strategic Plan in ADEC, two cost-related variables are usually used as KPI’s by ADEC, and they will be considered in this study. Other non-monetary variables related to class capacity, teacher to student ratio, and teacher load will be considered too. The list of input variables, as shown in Table 3, and they include:
• Average student cost per school.
• Average teacher cost per school (it should be added here that the average teacher cost per school is a figure added already in the average per student cost per school).
• Class capacity utilization. The policy established by ADEC recommends secondary schools to fulfill class capacity to 25 students.
• The teacher – student ratio in the school. The policy established by ADEC recommends secondary schools to fulfill a ratio of 13 students per teacher.
• Teacher load. The policy established by ADEC recommends secondary schools to fulfill a teacher load of 24 hours per week.
It should be mentioned that ADEC has other inputs and outputs that are directly measureable but were not utilized in the current analysis due to various reasons. These indicators include parent satisfaction scores, teacher satisfaction scores, number of licensed teachers and their satisfaction scores, average ILETS scores of teachers, other cost figures for each school, size of the school, number of students, and other indicators. With regard to satisfaction scores’ data (parents, teachers, and licensed teachers), all scores correspond to the academic year 2010-2011. Prior scores were not school-specific, but they were of a general nature. The full utilization of the services of licensed teacher occurred more in 2010-2011. As a result, using the data for analysis prior to 2010-2011 might not reflect the true application. ILETS scores were not readily available when this study was conducted. Finally, school size and number of students data were not utilized since the numbers were reflected more objectively through other variables such as teacher/student ratio, and class utilization. It should be mentioned that most of those indicator variables would be utilized in future studies.
In DEA, usually two rules of thumb should guide the analyst in the specification of the model. The first is parsimony. The analyst should avoid the "kitchen sink" approach when selecting inputs and outputs
(Thanassoulis, 2001; Cooper et al., 2000). The more inputs and outputs for a given number of DMUs, the greater proportion of units classified as efficient. This is so because the DMUs are compared to each other on the basis of inputs and outputs. Idiosyncratic levels of inputs or outputs of a DMU will cause a DMU to be "unique" and thus only comparable to it; hence, be labeled as efficient. The second rule of thumb is to avoid the use of highly correlated inputs and highly correlated outputs. The issue is whether the variables are truly distinct. For example, the teacher-student ratio and the expenditure per student may not truly reflect two distinct resource utilization measures. Moreover, the first rule of thumb is enhanced by minimization of somewhat redundant inputs and outputs. The vast majority of the literature on education production relationships was estimated with multiple regression analysis which provides an extensive examination of appropriate input and output measures. These carry over to desired DEA input and output measures.
Golany and Roll (1989) note that the number of DMUs should be at least twice of the total number of input and output factors considered when applying the DEA model. In this study the number of DMUs was 22, while the total (available) inputs (5 inputs) and outputs (9 outputs) is 15, which means that we need to be extra careful in selecting the right combination of outputs and inputs for the DEA to yield high construct validity. Through further statistical analysis, an appropriate list of inputs and outputs would be outlined.
Table 3. Input details for schools School name Cost per teacher Cost per Student Teache r load Class size student teacher ratio School 1 244691 43685.35 22.99 13.19 28.69 School 2 267221 64063.23 39.29 13.92 43.72 School 3 254970 43226.81 14.18 12.17 14.04 School 4 181265 49249.61 25.00 21.11 40.83 School 5 267182 49446.45 17.15 10.00 18.57 School 6 242664 51041.47 27.30 10.35 29.03 School 7 229059 40216.00 44.68 27.58 46.65 School 8 268504 58978.94 29.17 21.37 39.24 School 9 224502 48205.23 18.18 27.08 35.19 School 10 230899 60566.30 54.59 20.77 52.90 School 11 221253 35618.26 12.28 27.50 30.95 School 12 270242 61780.72 36.84 16.67 42.03 School 13 248971 55822.64 30.92 13.33 32.59 School 14 227990 49931.43 40.27 0.93 32.70 School 15 234408 42597.13 27.54 20.00 23.08 School 16 235373 46480.79 28.57 9.79 29.59 School 17 236540 56181.59 31.82 18.84 39.78 School 18 227439 87144.07 38.84 56.92 66.13 School 19 219848 36698.78 3.96 7.46 0.34 School 20 227966 46769.40 29.80 10.53 32.00 School 21 222867 51310.92 38.86 17.33 42.33 School 22 213516 58904.67 19.01 37.97 46.16 Figure 1. The input – output system of Abu Dhabi secondary public schools
3.3 Analysis methods
It should be noted that defining inputs and outputs is crucial in any study. The validity of the results rests on the quality of the data used to perform the analysis. Again, since this kind of analysis is new to the Abu Dhabi school system, it should be obvious that this is only an exploratory study of better understanding the advantages of DEA, and its shortcomings. In these circumstances, the authors were not clear at all on what output and input variables they were supposed to be using. There is just a long list with variables described and without link among them. However, the ADEC authorities participating in the study suggested looking at DEA programs output with various scenarios of different input and output combinations to explore their usefulness. This kind of scenario analysis will provide a clearer idea of the variable used and why they were used and why only some combinations have been used.
To help in identifying a shorter list of inputs and outputs for the DEA, two main analysis methods were employed. First, multiple regression was used to assess the relationships between the input and output variables. The output variables were treated as dependent variables with all input variables being independent variables. This method would allow understanding the contributing input variables with each of the output variables. Second, correlation analysis was used to better understand the relations among the input variables. It was also used to establish correlations among the output variables.
DEA models (scenarios) would attempt to incorporate variables that have low correlations. The scenarios would represent the explorations of their usefulness to school decision-makers. The issue of returns to scale concerns what happens to schools' outputs when they change the amount of inputs that they are using to produce their outputs. Since this study is only an exploration, DEA with constant return to scale would be assumed. Under the assumption of constant returns to scale a school’s efficiency is measured relative to efficiency of other schools of different scale sizes. As a result no school will obtain a lower efficiency score using variable returns to scale than it achieves using constant returns to scale and some schools are likely to achieve higher efficiency results.
For the DEA, both input minimization and output maximization are available as options. However, since school efficiencies with respect to costs of each school were a major determinant, the input minimization option will be used. It is concerned with “given the level of outputs that schools produce, how much could their use of inputs have been reduced while maintaining their current level of outputs?” In addition, sensitivity analysis would identify potential improvements. It would show how much inefficient schools need to reduce their inputs or increase their outputs in order to become efficient. As a result, such exploratory investigation would answer two questions: “how efficient the schools are?" and "how much could they improve?" Such analysis might suggest performance targets for each inefficient school. It also would identify the units which were performing best and; therefore, their operating practices could be examined to establish a guide to "best practice" for other schools to emulate.
Since several scenarios would be explored and run using DEA (i.e., DEA under different combinations of inputs and outputs), average efficiency scores for each school would be calculated. Using efficiency scores as dependent variable, regression analyses would be run to better understand the significant input and output variables. Separate and individual regressions would be run on all inputs for each of the outputs one at a time because of the small sample size of schools. Some limitations with using this method would be addressed later in the study.
To evaluate statistical differences between schools based on their calculated efficiencies, ANOVA would be utilized. Since a one-way ANOVA with small sample sizes may not have sufficient power to detect any significant difference among the samples, the analysis would be utilized to only suggest future directions for this study.
3.4 The DEA model
The model designed here is a simple CCR model, which is probably the most widely used and best known DEA model (Banker et al., 1989; Charnes et al., 1993). A constant return to scale relationship is assumed between inputs and outputs. It was the first DEA model to be developed, named CCR after Charnes, Cooper and Rhodes who introduced this model in an article published in the European Journal of Operational Research (1978, Vol. 2 pp. 429-444). This model calculates the overall efficiency for each unit, where both pure technical efficiency and scale efficiency are aggregated into one value. The primal CCR model and its primal version used are explained here.
n)
,
2,
1,
j
(
Unit
Making
Decision
th
j
The
:
DMU
j=
L
sj j j ij mj j j ij
y
y
y
j
i
y
x
x
x
j
i
x
,
,
,
DMU
th
the
of
output
th
the
of
amount
The
:
,
,
,
DMU
th
the
of
input
th
the
of
amount
The
:
2 1 2 1L
L
(
)
(
r
,
,
s
)
r
u
m
,
,
i
i
v
r iL
L
2
1
output
th
the
to
assigned
weight
The
:
2
1
input
th
the
to
assigned
weight
The
:
=
=
(
)
( )
0
,
,
,
,
0
,
,
,
2
.
1
,
,
2
,
1
1
subject to
Maximize
2 1 2 1 1 1 1 1 2 2 1 1 2 2 1 1≥
≥
=
≤
+
+
+
+
+
+
+
+
+
+
=
s m mj m j sj s j mk m k k sk s k ku
u
u
v
v
v
n
j
x
v
x
v
y
u
y
u
x
v
x
v
x
v
y
u
y
u
y
u
L
L
L
L
L
L
L
θ
0
,
,
,
,
0
,
,
,
1
subject to
Maximize
2 1 2 1 1 1 1 1 1 1 1 1≥
≥
+
+
≤
+
+
=
+
+
+
+
=
s m mj m j sj s j mk m k sk s ku
u
u
v
v
v
x
v
x
v
y
u
y
u
x
v
x
v
y
u
y
u
L
L
L
L
L
L
θ
(
* * *)
θ
,
u
,
v
:
Solution
Optimal
An
The reference set R is given by
=
=
=
∑
∑
= =n
j
x
v
y
u
j
R
m i ij i s r rj r k:
,
1
,
,
1 * 1 *L
The primal problem becomes:
0
and
0
1
0
subject to
Maximize
1 1 1 1≥
≥
=
≤
+
−
∑
∑
∑
∑
= = = = r i m i ik i s r rj r m i ij i s r rk ru
v
x
v
y
u
x
v
y
u
And the dual problem becomes:
ed
unrestrict
y
y
x
x
j rk n j j rj ik n j j ij:
and
0
0
subject to
Minimize
1 1θ
λ
λ
θ
λ
θ
≥
≥
≥
+
−
∑
∑
= = 4. Results4.1 Relationship between input and output variables
Regression analysis is performed of input and output variables. Each output variable is treated as a dependent variable with all input variables being independent variables. As a result, a total of 10 regression analyses were run, one for each output variable. Again, it should be noted that the only justification for doing such analysis was to explore dependency of variables on each others. The analysis calculated the values for the standardized beta,
and t-value for only those variables that portray less than (0.10) level of significance. Results show that only several output variables showed some sensitivity to certain input variables. CEPA scores were impacted significantly by only two inputs: average cost per teacher, and average cost per student. Thanawiyah scores were also impacted by the two cost factors. The other output variables related to EMSA scores were not significantly impacted by any of the cost variables.
The analyses provide some justifications for the possible impact of two main input variables: average cost per teacher and average cost per student. Other non-cost variables had some impacts on the EMSA scores but not on the CEPA and Thanawiyah scores. Analyses also point to the importance of three output variables: Thanawiyah scores, CEPA scores, and Grade 12 EMSA Math scores. These three variables mostly were impacted by cost variables.
4.2 Variable candidates and scenarios
The number of schools (DMU’s) is 22 schools with a possible list of 15 input/output variables available. As a result, the DEA would be useless if all inputs and outputs were to be considered. Correlation analyses were performed on the set of inputs and the set of outputs to reduce the total number; and to find the best combination mix of inputs and outputs. Several scenarios could result. Table 4 provides correlation coefficients with regard to the candidate inputs. There are several conclusions that could be made. There is a low correlation between cost per teacher, and the other 4 input variables. As a result, cost per teacher is a good candidate to be a representative input variable. It could be a part of all scenarios. If average cost per student is an important input variable, it should be noted that it enjoys high correlation with teacher load and average student/teacher ratio. In addition, Class capacity is highly correlated with student/teacher ratio. Other inputs listed here could be used, but due to the above reason they will not be include n the final analysis.
The debate was to select most appropriate non-cost variables. Regression results did not show significant effect for most non-cost variables on any of the outputs. However, both student/teacher ratio and teacher load provided significant effects with regard to the different outputs. Since teacher load and student/teacher ratio are both highly correlated (P = 0.742); and student/teacher ratio is correlated with class size (P = 0.749), more discussion were required. As a result, these facts were presented to a panel consisting of ADEC executive members. Such overall results would lead to the recommendation of possibly not using any of the non-cost inputs.
Table 4. Correlation coefficients for inputs (significance level)
Cost per teacher Cost per student Teacher load Student/teacher ratio Class capacity Cost per teacher 1.000
Cost per student 0.293 1.000
Teacher load 0.067 0.513 1.000
Student/teacher ratio -0.300 0.618 0.742 1.000
Class capacity -0.174 0.147 -0.002 0.749 1.000
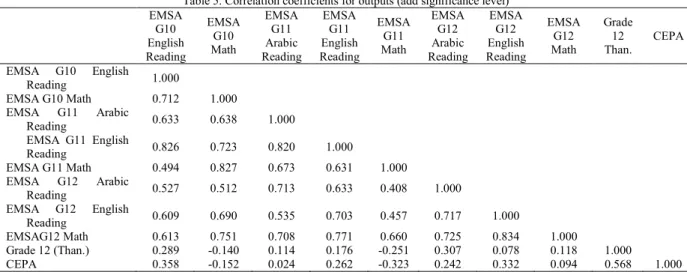
Table 5 provides the correlation between the output variables. There are several conclusions that could be made. Both CEPA and G12 Thanawiyah have relatively low correlations with all other variables. However, CEPA and G12 Thanawiyah are highly correlated. Recommended that either one could be a candidate for inclusion in the analysis. However, they should not be a part of the same model (or scenario). EMSA variables are correlated with each other. As a result, only one of them could be included in the analysis. The one with the lowest correlation with CEPA or with G12 Thanawiyah is EMSA Grade 12 Math.
Table 5. Correlation coefficients for outputs (add significance level) EMSA G10 English Reading EMSA G10 Math EMSA G11 Arabic Reading EMSA G11 English Reading EMSA G11 Math EMSA G12 Arabic Reading EMSA G12 English Reading EMSA G12 Math Grade 12 Than. CEPA EMSA G10 English Reading 1.000 EMSA G10 Math 0.712 1.000 EMSA G11 Arabic Reading 0.633 0.638 1.000 EMSA G11 English Reading 0.826 0.723 0.820 1.000 EMSA G11 Math 0.494 0.827 0.673 0.631 1.000 EMSA G12 Arabic Reading 0.527 0.512 0.713 0.633 0.408 1.000 EMSA G12 English Reading 0.609 0.690 0.535 0.703 0.457 0.717 1.000 EMSAG12 Math 0.613 0.751 0.708 0.771 0.660 0.725 0.834 1.000 Grade 12 (Than.) 0.289 -0.140 0.114 0.176 -0.251 0.307 0.078 0.118 1.000 CEPA 0.358 -0.152 0.024 0.262 -0.323 0.242 0.332 0.094 0.568 1.000
Results from regression and correlation analyses reduced the number of outputs to three (CEPA, Thanawiyah, and EMSA Grade 12 Math). The analyses also reduced the number of possible inputs to three (class size, average cost per student, and average cost per teacher). However, because of the correlation between some of those selected variables, some variables were recommended not to be used in the same model. The suggested models (or scenarios) were the following:
Scenario 1. Average cost per student and (CEPA and EMSA Grade 12 Math). Scenario 2. Average cost per student and (Thanawiyah and EMSA Grade 12 Math). Scenario 3. Average cost per teacher and (CEPA and EMSA Grade 12 Math). Scenario 4. Average cost per teacher and (Thanawiyah and EMSA Grade 12 Math).
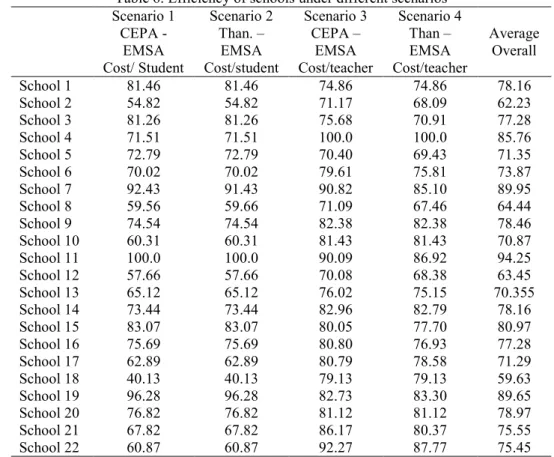
Table 6. Efficiency of schools under different scenarios Scenario 1 CEPA - EMSA Cost/ Student Scenario 2 Than. – EMSA Cost/student Scenario 3 CEPA – EMSA Cost/teacher Scenario 4 Than – EMSA Cost/teacher Average Overall School 1 81.46 81.46 74.86 74.86 78.16 School 2 54.82 54.82 71.17 68.09 62.23 School 3 81.26 81.26 75.68 70.91 77.28 School 4 71.51 71.51 100.0 100.0 85.76 School 5 72.79 72.79 70.40 69.43 71.35 School 6 70.02 70.02 79.61 75.81 73.87 School 7 92.43 91.43 90.82 85.10 89.95 School 8 59.56 59.66 71.09 67.46 64.44 School 9 74.54 74.54 82.38 82.38 78.46 School 10 60.31 60.31 81.43 81.43 70.87 School 11 100.0 100.0 90.09 86.92 94.25 School 12 57.66 57.66 70.08 68.38 63.45 School 13 65.12 65.12 76.02 75.15 70.355 School 14 73.44 73.44 82.96 82.79 78.16 School 15 83.07 83.07 80.05 77.70 80.97 School 16 75.69 75.69 80.80 76.93 77.28 School 17 62.89 62.89 80.79 78.58 71.29 School 18 40.13 40.13 79.13 79.13 59.63 School 19 96.28 96.28 82.73 83.30 89.65 School 20 76.82 76.82 81.12 81.12 78.97 School 21 67.82 67.82 86.17 80.37 75.55 School 22 60.87 60.87 92.27 87.77 75.45
Than (Thanawiyah scores - Grade 12 exit exams)
EMSA (test of English, Math, Science and Arabic – the Math portion only)
4.3 School relative efficiencies under various scenarios
School efficiencies are calculated under the six scenarios suggested, given the conclusions reached with regard to the regression and correlation analyses. Each scenario is associated with different combinations of inputs and/or outputs. This form of analysis could be thought of as an exploration of the sensitivity of the model to different inputs and outputs. In other words, how would the efficiencies change given a change in the combination on inputs and outputs? For both input minimization and output maximization analyses with constant returns to scale, the efficiencies for each of the scenarios were analyzed and are given in Table 6. The last row shows the average efficiency scores under each scenario.
There are several obvious results that could be summarized here:
• For the 4 scenarios, only 2 schools reach the 100% efficiency score at least once (School 4 and School 11). • The first and second scenarios provided almost identical results.
• Using cost/student or cost/teacher significantly affected the efficiency of several schools. • The correlation between the third and fourth scenario is 0.882, significant and high.
• The correlation between either the first or second scenario with either third or fourth scenarios is low (around 0.228).
• Either cost/student or cost/teacher were used in any of the scenarios because of the high correlation between the two (many members of the consulting or advisory group preferred using average cost per teacher because of the variation in teacher cost from one school to another).
The results indicate that changing the combinations of outputs and inputs affected and hence, significantly altered the school rankings with regard to efficiency. Selecting one of the scenarios to conduct sensitivity analysis would yield outcomes unique to that scenario. For the input minimization analysis, DEA provided actual and targets for each resource (the input variables). As a result, each school gets the potential improvement it could achieve to be efficient in comparison with its efficient peer (s). The analyses with regard to the fourth scenario is shown in Table 7.
Table 7. Actual and targets under the 4th scenario (Minimization of inputs) School
name Efficiency
EMSA Cost per teacher Thanawiyah
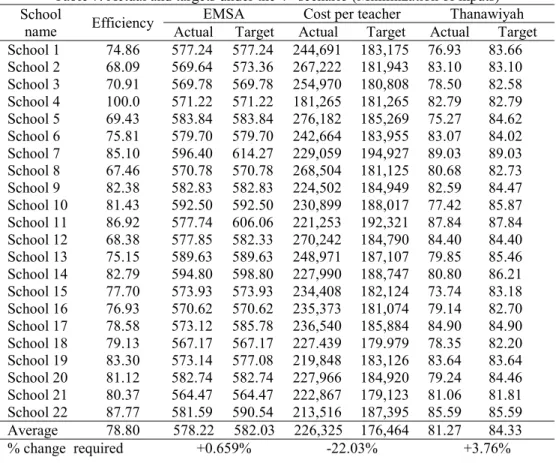
Actual Target Actual Target Actual Target School 1 74.86 577.24 577.24 244,691 183,175 76.93 83.66 School 2 68.09 569.64 573.36 267,222 181,943 83.10 83.10 School 3 70.91 569.78 569.78 254,970 180,808 78.50 82.58 School 4 100.0 571.22 571.22 181,265 181,265 82.79 82.79 School 5 69.43 583.84 583.84 276,182 185,269 75.27 84.62 School 6 75.81 579.70 579.70 242,664 183,955 83.07 84.02 School 7 85.10 596.40 614.27 229,059 194,927 89.03 89.03 School 8 67.46 570.78 570.78 268,504 181,125 80.68 82.73 School 9 82.38 582.83 582.83 224,502 184,949 82.59 84.47 School 10 81.43 592.50 592.50 230,899 188,017 77.42 85.87 School 11 86.92 577.74 606.06 221,253 192,321 87.84 87.84 School 12 68.38 577.85 582.33 270,242 184,790 84.40 84.40 School 13 75.15 589.63 589.63 248,971 187,107 79.85 85.46 School 14 82.79 594.80 598.80 227,990 188,747 80.80 86.21 School 15 77.70 573.93 573.93 234,408 182,124 73.74 83.18 School 16 76.93 570.62 570.62 235,373 181,074 79.14 82.70 School 17 78.58 573.12 585.78 236,540 185,884 84.90 84.90 School 18 79.13 567.17 567.17 227.439 179.979 78.35 82.20 School 19 83.30 573.14 577.08 219,848 183,126 83.64 83.64 School 20 81.12 582.74 582.74 227,966 184,920 79.24 84.46 School 21 80.37 564.47 564.47 222,867 179,123 81.06 81.81 School 22 87.77 581.59 590.54 213,516 187,395 85.59 85.59 Average 78.80 578.22 582.03 226,325 176,464 81.27 84.33 % change required +0.659% -22.03% +3.76%
In a presentation to the executive committee in ADEC, much of the discussions focused around the fourth scenario. The scenario concentrates on the Thanawiyah score and the EMSA Math scores. Both scores are major KPI’s in ADEC’s strategic plan. In addition, the fourth scenario incorporates average cost per teacher. For each school, Table 7 shows the actual and the targets for each of the resources used and the output produced under the fourth scenario (such analysis could be carried out for each of the four scenarios). Under the fourth scenario, school 4 maintains 100% efficiency; as a result, no improvements are necessary. Results show that some schools require extensive improvements if they are to reach 100% efficiency. On average, cost per teacher could improve 22.03%, and the Thanawiyah scores could improve 3.76%. The most inefficient schools require more improvements.
4.4 Regression analysis
Regression analysis was run where the efficiency scores of the fourth scenario was treated as the dependent variables, and the three variables of average teacher cost, EMSA Math, and Thanawiyah as independent variables. The model yields an adjusted R-square of 0.977, with an significant F value of 302.961. The regression coefficients are given in Table 8. Results show that all four independent variables are significant.
Table 8. Regression analysis results
Variables Unstandardized coefficients Standardized coefficients
B Standard error Beta t-value Sig.
Constant 77.236 17.006 ---- 4.542 .0001
Cost/teacher .000 .000 -0.942 -27.722 .0001
EMSA Math .112 .028 .1318 3.961 .001
It should be noted however with caution that to identify the determinants of efficiency, the authors used the efficiency scores as the dependent variable and the inputs and outputs as independent variable (Table 8). Among these independent variables were those which had been used to calculate efficiency scores. This might pose certain specification problem of the regression model (see for example the work of Simar and Wilson, 2007). However, this study has an exploratory feature only. Results would only enhance our understanding of DEA to decision-makers in public schools in Abu Dhabi.
4.5 Testing differences
Analysis of variance is performed where the school efficiency related to the fourth scenario is tested with regard to school location, gender, and type.
With regard to school type (PPP vs. model schools), the ANOVA results show that the F-ratio is 5.82047, with a P-value of the F-test of 0.0256, meaning that there is a statistically significant difference between the mean school efficiency from one level of school type to another at the 95.0% confidence level. We should note too that the efficiency mean for model schools is 95.9108 and for PPP schools are 82.2715. We need to be careful when interpreting this result because there are only 20 PPP schools, while there are only 2 Model schools.
With regard to school location, the ANOVA results provide an F-ratio of 6.77151 with a P-value of 0.006, meaning that there is a statistically significant difference between the mean efficiency from one level of school location to another at the 95.0% confidence level. The efficiency mean of Abu Dhabi schools is 86.6562, the Al Ain School is 76.8935, and the Gharbiah schools are 95.5731. We need to note that there are 13 schools located in Abu Dhabi, 8 in Al Ain, and only 1 in Gharbiah.
With regard to school gender, the ANOVA results provide an F-ratio of 0.32 with a P-value of 0.5779, meaning that there is no statistically significant difference between the mean efficiency from one level of school gender to another at the 95.0% confidence level. The efficiency mean of male schools is 84.5478, while for female schools is 82.4571. There are 11 male schools and 11 female schools in the analysis.
The results show that the factors of school type, gender, and location are significant when examining schools’ efficiencies. Such results indicate that the schools are not homogeneous. In future efficiency analysis, such exogenous factors should be considered too. Separate DEA analysis for each of those categories might be more effective given that the sample size is justified.
5. Discussions
As presented earlier, DEA was utilized in measuring school efficiencies in many countries (Coelho et al., 2007; Ng and Lee, 2009; Muniz, 2002). Abu Dhabi public school settings present a unique setting with distinct features. These included the fact that it was going through a reform where many schools were to experience changes in its school management and decision-making practices.
Since the number of available input and output variables (15) was large relative to the number of schools (22) in the analysis, it was necessary to reduce the number of variables. Correlation analysis indicated high correlations among many variables. The results and further analysis justified utilizing only 3 output variables and 1 input variable to be retained for further analysis. However, each DEA model were run using only 3 total variables. The number of DMU’s and the number of input/output variables adhered to the acceptable combination rule suggested by others (Colany and Roll, 1989; Cooper et al., 2000).
As in other studies, the current study utilized output variables related to student performance scores ((Du, 2004; Cherchye et al., 2010; Bates, 1997). Two cost related inputs were selected, average cost per teacher and average cost per student. However, because of their high correlation, only a single one was used in each of the models developed. Analysis justified using only one input variable dealing with class capacity standard as a non-cost input variables. According to Mancebon and Molinero (2000), administrative resource allocation and achievements of students, inspired lots of economic studies of educational production, efficiency and cost issues. However, during the discussion of panel of experts, many concerns were raised with regard to this variable. It was decided to omit it from further considerations.
Regression analysis of output variables being dependent while input variables being independent, showed that two cost-related input variables were noticeably significant: average cost per teacher and average cost per student. The expenditure/cost inputs being significant contributors to education outputs is consistent with other studies (Ruggiero and Vitaliano, 1999; Hu et al., 2009). Regression results, also utilized by other studies (Waldo. 2007; Soteriou et al., 1989; Rassouli-Currier, 2007), provided further suggestions that average annual teacher costs have significant effects on school efficiencies. Moreover, it showed that this cost-related variables effected efficiencies in a negative manner.
The current study examined also school’s non-cost variables as suggested by others (Thanassoulis, 1999; Mancebon and Badres, 1999; Rutter and Maughan, 2002). However, it was noted that the schools did not have control over many of those factors as they were significantly affected by other factors such as school
location. The only variable considered was class size. Further analysis and discussions led to use only cost-related factors.
Similar to other studies (Ruggeiro and Vitaliano, 1999), test scores were main output variables for the DEA models used in this study. A total of four scenarios were tested with different combinations of inputs and outputs. The scenario with the lowest estimated mean efficiency of 40.13% was related to the first and second scenarios of one input (average cost per student), and either of two combination of outputs (CEPA and E12Math or Thanawiyah and EMSA E12Math). The analysis and the panel of expert discussions led to selecting the fourth scenario as the one more reflective of the realities on the ground among Abu Dhabi urban public schools.
As an illustration, further analysis was carried out on the 4th scenario since it contained all variables that are included in the KPI list of ADEC’s strategic plan. Under this scenario, results show that schools could reduce average teacher cost by 22.03% and still produce the same output. In addition, inefficient schools could increase their student outcome in Thanawiyah by 3.76%. Results of the fourth scenario identified four schools that attained high efficiency scores (above 85%). Results also identified four schools that were relatively underperforming (below 70%). Only one school attained perfect efficiency of 100%, and identified as best performing school. The results need to be analyzed with caution since other non-cost variables related to schools or socio-economic and environment settings were not included in the analysis.
In 2012, ADEC recognized the four most efficient schools in a major event attended by all Abu Dhabi public school principals. Results confirm that some lower-spending schools are considered to be operating with the best practices, while any extra spending is generally interpreted as a measure of school inefficiency. Groskopf et al., (2001) noted that inefficiency among schools could be reduced by increasing competition amongschools districts. Deller and Rudnicki (1993) suggested that competitive pressure within highly concentrated areas results in a better school performance. Hoxby (2000) founded that competition between private and public schools can increase public schools’ productivity without increasing expenditure.
Since ADEC will gradually provide schools with more responsibilities and control, optimal allocation of resources would become a major force in school performance in the future. As Hu et al., (2009) hints that accountability would become a major phenomenon in the future for publicly funded schools – especially if efficiency is a core school KPI. ADEC intends to publicized student outcomes for each school by end of 2012. This plan would let parents make better informed decision with regard to the school that they might select for their children. It also intends to reward the schools based on their performance.
Utilizing multiple inputs and outputs to calculate school efficiencies would provide a more objective way to assess efficiencies (Beasely, 1995; Brockett et al., 2005; Charnes et al., 1993). DEA, as a benchmarking tool, avoids specification error between the inputs and outputs. As a result, more practitioners could utilize it (Johnes and Johnes, 1995; Hanushek, 1986). The cross efficiency in DEA allows for effective discrimination between niche performers and good overall performers. Moreover, evaluating the performance of schools over time (window analysis) by treating them as a different entity in each period will allow the school to be compared to itself over time.
Analysis of variance results showed that school location and school type have significant effects on school efficiencies. Location of the school was also a major factor in other studies (Du, 2004; Hanushek, 1986; Sarrico et al., 2010; Roggiero, 2004)). This result might have major implications for ADEC. ADEC has invested a significant amount of resources in PPP schools. However, model schools provided superior efficiency results. To be more objective, model schools accept students who are better achievers than other type of schools. Nevertheless, ADEC needs to extensively evaluate PPP performance based on the results obtained in this study. An essential objective of the school reform process in ADEC is to reduce student outcome variations between schools regardless of any other factors. In 2010, a roadmap is recommended where only one school type would exist in Abu Dhabi by 2016 (the New School Model).
6. Conclusion
This study utilized a non-parametric method named DEA to evaluate relative efficiency for 22 schools in Abu Dhabi Emirate. There are many advantages of using DEA to analyze efficiency of comparable units which make it an attractive tool for both public and private organizations. The most important one is that it is able to handle multiple inputs and outputs without prior weights. In this study, there were15 input and output variables for only 22 schools. Correlation analysis and other judgmental processes reduced the number to a total of 4 variables only. DEA is particularly suitable for analyzing the efficiency of schools, where it is difficult or impossible to assign prices to many of the outputs. Hence, student performance is used. Another benefit is that DEA does not require a functional form that relates inputs and outputs. DEA can also optimize each individual observation and compare it with the ‘best practice’ observations, because it can produce a single measure for every DMU which can be easily compared with other DMUs.
The Abu Dhabi school reform has fundamentally changed the conditions under which public education is operated. The responsibility for providing education is gradually being decentralized from ADEC to schools.
One of the aims with the reform was to increase efficiency in education. This paper estimated efficiency for the school year of 2010-2011 using DEA. ADEC’s policy makers could optimally utilize DEA in evaluating schools by performing the following tasks:
• Resource allocation between schools: reallocating from the inefficient school to the efficient school. • Identification of “best practices” in school operations.
• Identification of “poor practices” in school operations. • Setting targets for inefficient schools.
• Monitoring school efficiency changes over time. • Giving rewards for good performing schools.
Today, school managers and policy makers have to cope with and make sense of an enormous amount of data relating to their schools’ operations. The challenge is to somehow derive useful insights from all these numbers that will lead to improvements in the performance of the schools. For ADEC, which has an estimated 300 public schools, the goal of management is to ensure that each school achieves the best possible performance; however, the challenge is deciding on what “the best possible performance” exactly means and the best method to measure it. The outputs of the schools such as student outcomes can be studied and compared. Similarly, a school’s inputs, such as, costs and staff, can be measured. All these attempts to measure performance may; however, produce no overall clear picture as schools may exhibit considerable variation depending on the performance indicator chosen. In other words, it might be difficult to have a homogenous group of comparable schools across the country. This is where DEA helps as it provides a more comprehensive measure of efficiency by taking into account all the important factors that affect a school’s performance.
For ADEC, which is going through a rigorous reform, an important topic for future research is the source of school inefficiencies. ADEC has to have a better grasp of why schools in Abu Dhabi differ in their efficiency scores. As noted by others (Ruggiero and Vitaliano, 1999; Hu et al., 2009), not knowing the sources of inefficiencies in public schools would lead to failures when adopting the various structural reforms being put forward on grounds of greater efficiency. Future research should expand the list of input and output candidates and examine their inclusion in the analysis. Some of the output candidates might include stakeholders’ satisfaction (parents’ satisfaction results, principals’ satisfaction results, teachers’ satisfaction results, etc.). Other variables could be the number of teacher aides and teacher assistants per student, number of computers and classrooms per student, and proportion of teachers with at least a certain amount of training. Future studies could incorporate some discretionary input as suggested by some studies (Muniz, 2002; Ruggiero, 1996), such as student related background.
A major implication of this research for Abu Dhabi is the awareness of the upper management that the operating expenses’ data should be available for each school in details if better reflective score efficiencies are to be measured. Almost all operating expenses were available but on aggregate level (i.e., money spend by schools on professional development, extracurricular activities, stationeries, public events, library expenses, laboratory expenses, etc.). The availability of detailed and school-specific operating expenses will also allow schools, regardless of their size, location, type, and gender to be evaluated all together. As pointed out by others (Charnes et al., 1993; Banker et al., 1989; Bates, 1997; Hu et al. 2009), the availability of data will better lead to the selection of truly representative inputs and outputs for efficiency analysis. The creation of a new financial data system for Abu Dhabi schools will certainly provide many data elements for much better efficiency calculations.
Defining inputs and outputs is crucial in any study. A production process is an economic model and need to be specified properly. Knowledge of the system and of the production process would lead to a theoretically founded model (or few models that compete). Future studies should better identify specific variables to better understand the production process related to schools in Abu Dhabi. This would lead to testable hypothesis about the production process. The study was limited to using a CRS model of DEA. Future studies should not be limited to CRS only. Returns to scale are important as they allow one to determine the school optimal size. It should be mentioned also that in terms of practical application, the presence of different types of schools along with other differences may result in biased comparisons due to data heterogeneity. In view of the applied nature of this work, future studies should be able t