PERSONALIZED EXPERT RECOMMENDATION: MODELS AND ALGORITHMS
A Dissertation by HAOKAI LU
Submitted to the Office of Graduate and Professional Studies of Texas A&M University
in partial fulfillment of the requirements for the degree of DOCTOR OF PHILOSOPHY
Chair of Committee, James Caverlee Committee Members, Frank Shipman Yoonsuck Choe Patrick Burkart Head of Department, Dilma Da Silva
December 2017
Major Subject: Computer Engineering
ABSTRACT
Many large-scale information sharing systems including social media systems, question-answering sites and rating and reviewing applications have been growing rapidly, allowing millions of human participants to generate and consume information on an unprecedented scale. To manage the sheer growth of information generation, there comes the need to en-able personalization of information resources for users — to surface high-quality content and feeds, to provide personally relevant suggestions, and so on. A fundamental task in creating and supporting user-centered personalization systems is to build rich user profile to aid recommendation for better user experience.
Therefore, in this dissertation research, we propose models and algorithms to facilitate the creation of new crowd-powered personalized information sharing systems. Specifi-cally, we first give a principled framework to enable personalization of resources so that information seekers can be matched with customized knowledgeable users based on their previous historical actions and contextual information; We then focus on creating rich user models that allows accurate and comprehensive modeling of user profiles for long tail users, including discovering user’s known-for profile, user’s opinion bias and user’s geo-topic profile. In particular, this dissertation research makes two unique contributions: First, we introduce the problem of personalized expert recommendation and propose the first principled framework for addressing this problem. To overcome the sparsity issue, we investigate the use of user’s contextual information that can be exploited to build robust models of personal expertise, study how spatial preference for personally-valuable exper-tise varies across regions, across topics and based on different underlying social commu-nities, and integrate these different forms of preferences into a matrix factorization-based personalized expert recommender.
Second, to support the personalized recommendation on experts, we focus on mod-eling and inferring user profiles in online information sharing systems. In order to tap the knowledge of most majority of users, we provide frameworks and algorithms to ac-curately and comprehensively create user models by discovering user’s known-for profile, user’s opinion bias and user’s geo-topic profile, with each described shortly as follows:
— We develop a probabilistic model called Bayesian Contextual Poisson Factorization to discover what users are known for by others. Our model considers as input a small frac-tion of users whose known-for profiles are already known and the vast majority of users for whom we have little (or no) information, learns the implicit relationships between user?s known-for profiles and their contextual signals, and finally predict known-for profiles for those majority of users.
— We explore user’s topic-sensitive opinion bias, propose a lightweight semi-supervised system called “BiasWatch” to semi-automatically infer the opinion bias of long-tail users, and demonstrate how user’s opinion bias can be exploited to recommend other users with similar opinion in social networks.
— We study how a user’s topical profile varies geo-spatially and how we can model a user’s geo-spatial known-for profile as the last step in our dissertation for creation of rich user profile. We propose a multi-layered Bayesian hierarchical user factorization to overcome user heterogeneity and an enhanced model to alleviate the sparsity issue by inte-grating user contexts into the two-layered hierarchical user model for better representation of user’s geo-topic preference by others.
DEDICATION
ACKNOWLEDGMENTS
I would like to express my thanks and gratitude to all who have helped or supported me in any way during my PhD life.
First and foremost, I am deeply indebted to my advisor, Dr. James Caverlee, for his unlimited help and support throughout my research. Back in 2012 when I lost my interest in the research of my advisor at that time, he took me in and gave me a platform and an opportunity to work with him. When I was in the hard times trying to find dissertation topics, he was always very patient, kept giving me encouragement and guided me through our countless conversations and meetings. I have benefited so much not only from his in-sightful research suggestions, sharp ideas and clear thinking, but also from his life lessons on how to cope with failures and rejections by seeing the bright side of each and every failure. In that sense, he is not only a great advisor professionally, but also a wonderful mentor, full of cheer and with a big heart. I will always be grateful for his mentorship and support. Without that, this work would not have been possible.
Many thanks to my lab-mates for their support and helpful discussions. Senior lab members, Zhiyuan Cheng, Krishna Kamath, Elham Khabiri, Kyumin Lee, Jeff McGee, welcomed me to the lab and helped me understand how to become a successful researcher. Thanks to Wei, Cheng, Hancheng as fellow colleagues for constructive discussions, ex-change of ideas and collaboration on several projects. Thanks to my office mates over the years, Zhao Xing, Zhang Yin, Sindhuja Venkatesh, for bringing joy to the daily life. I would also like to thank many junior graduate students, Parisa Kaghazgaran, Majid Alfifi, Henry Qiu, Haiping Xue, for bringing fresh ideas and new research insights into the lab.
I would like to thank my parents for their love and support. Without them constantly being there for me, I would not have been able to finish my PhD. I also want to thank
my two big sisters for their care and support. Last but not the least, I want to thank my wife, Wenye, for being in this journey with me together no matter what, and for always believing in and enrouraging me whenever I encounter difficulties in my research. This work would be impossible without her love and support.
I would also like to thank all my committee members for their advice and comments in this dissertation research, and Dr. Ruihong Huang for taking the place of Dr Yoonsuck Choe for the dissertation defense and giving additional feedback.
CONTRIBUTORS AND FUNDING SOURCES
Contributors
This work was supported by a dissertation committee consisting of Professor James Caverlee, Professor Frank Shipman, Professor Yoonsuck Choe of the Department of puter Science and Engineering and Professor Patrick Burkart of the Department of Com-munication.
All other work conducted for the dissertation was completed by the student indepen-dently.
Funding Sources
Graduate study was supported by graduate research assistanship funded in part by Air Force Office of Scientific Research (AFOSR) grant FA9550-12-1-0363, National Science Foundation (NSF) grant IIS-1149383 and Google Research Award.
TABLE OF CONTENTS
Page
ABSTRACT . . . ii
DEDICATION . . . iv
ACKNOWLEDGMENTS . . . v
CONTRIBUTORS AND FUNDING SOURCES . . . vii
TABLE OF CONTENTS . . . viii
LIST OF FIGURES . . . xi
LIST OF TABLES. . . xiii
1. INTRODUCTION . . . 1 1.1 Motivation . . . 1 1.2 Research Challenges . . . 2 1.3 Dissertation Overview . . . 3 2. RELATED WORK . . . 9 2.1 User Profiling. . . 9
2.1.1 User Interests and Expertise . . . 9
2.1.2 User Opinion Bias . . . 10
2.2 Exploiting User Context . . . 12
2.3 Modeling User’s Implicit Feedback . . . 14
3. PERSONALIZED EXPERT RECOMMENDATION . . . 16
3.1 Introduction. . . 16
3.2 Preliminaries . . . 19
3.2.1 Problem Statement . . . 19
3.2.2 Recommendation by Matrix Factorization . . . 20
3.3 Region, Topic, and Social-Based Locality . . . 21
3.3.1 Data and Metrics . . . 21
3.3.4 Social-Based Locality . . . 28
3.3.5 Model Training . . . 31
3.4 Experimental Evaluation . . . 32
3.4.1 Data Preparation and Experimental Setup. . . 33
3.4.2 Baselines . . . 34
3.4.3 Comparison with Baselines . . . 35
3.4.4 Recommendation for Cold-Start Lists . . . 39
3.4.5 Effect of Number of Regions . . . 39
3.5 Conclusion. . . 41
4. USER PROFILING: DISCOVERING USER’S KNOWN-FOR PROFILE . . . 42
4.1 Introduction. . . 42
4.2 Preliminaries . . . 44
4.3 Known-For Profile Discovery . . . 45
4.3.1 Bayesian Contextual Poisson Factorization . . . 46
4.3.2 Prediction . . . 52
4.3.3 Learning with Variational Inference . . . 54
4.3.4 Complexity Analysis . . . 56
4.4 Experimental Evaluation . . . 58
4.4.1 Effectiveness of BCPF . . . 60
4.4.2 Geo-spatial Factor Analysis . . . 62
4.4.3 Social Influence Factor Analysis . . . 64
4.5 Conclusion. . . 66
5. USER PROFILING: DISCOVERING USER’S OPINION BIAS . . . 67
5.1 Introduction. . . 67
5.2 Lightweight Bias Discovery . . . 69
5.2.1 Finding Bias Anchors . . . 71
5.2.2 Bias Propagation Network . . . 75
5.2.3 Optimization Framework. . . 77
5.3 Experimental Evaluation . . . 79
5.3.1 Data . . . 79
5.3.2 Gathering Ground Truth. . . 80
5.3.3 Alternative Opinion Bias Estimators . . . 83
5.3.4 Biased Theme Discovery . . . 84
5.3.5 Comparison with Baselines . . . 89
5.3.6 Multi-Category Classification. . . 92
5.3.7 Case Study: Fracking and Vaccines . . . 93
5.4 Integrating Opinion Bias into User Recommendation. . . 97
5.4.1 Evaluating User Recommendation . . . 98
6. USER PROFILING: DISCOVERING USER’S GEO-TOPIC PROFILE . . . 101
6.1 Introduction. . . 101
6.2 Preliminaries . . . 105
6.3 Bayesian Hierarchical User Factorization . . . 106
6.3.1 Two-layered Hierarchical Model . . . 108
6.3.2 Modeling User’s Contextual Information . . . 111
6.3.2.1 User’s Geo-location Context . . . 111
6.3.2.2 User’s Social Context . . . 113
6.3.2.3 Modeling User’s Contextual Information . . . 114
6.3.3 Inference . . . 115
6.4 Experimental Evaluation . . . 121
6.4.1 Comparison with Baselines . . . 124
6.4.2 Predicting User’s Topical and Geo Profiles . . . 126
6.4.3 Parameter Analysis . . . 128
6.5 Conclusion. . . 131
7. CONCLUSIONS AND FUTURE WORK . . . 133
7.1 Conclusion. . . 133
7.2 Further Research Opportunities . . . 135
LIST OF FIGURES
FIGURE Page
1.1 Overview of the dissertation. . . 4
3.1 Spatial distribution of experts (a, b) and for the users who have listed ex-perts (c, d, e, f) based on geo-tagged Twitter lists. . . 18
3.2 CDF of expert spread (a) for different cities and (b) for different topics. . . 25
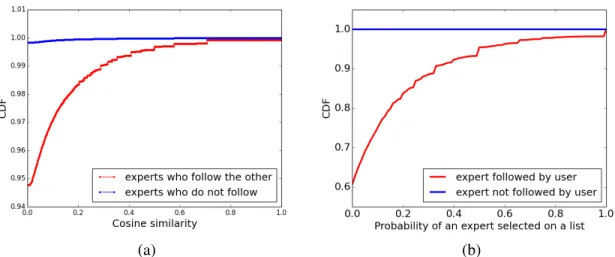
3.3 (a): CDF for similarity between experts; (b) CDF for the probability of an expert on a list. . . 29
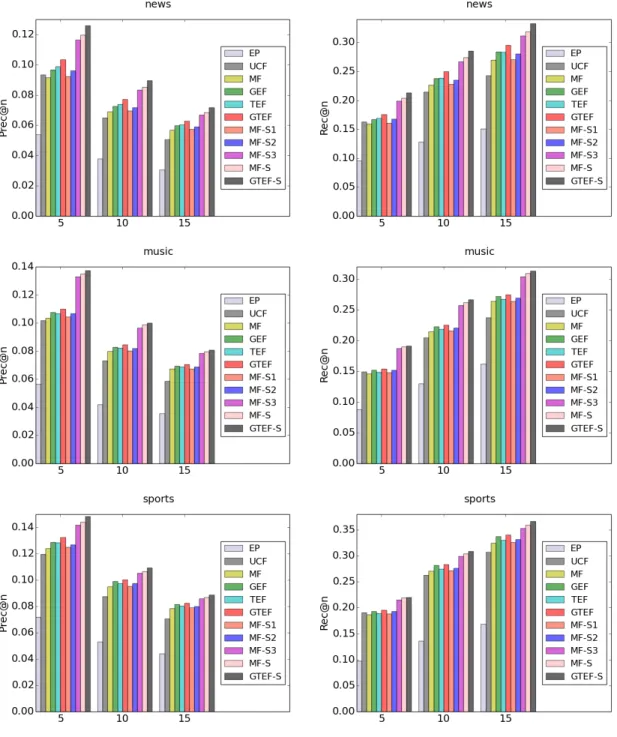
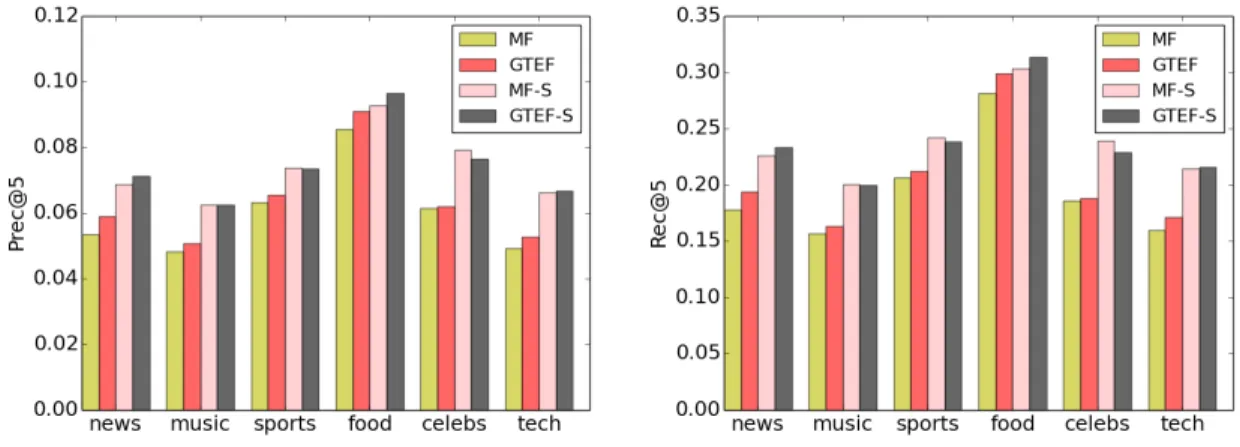
3.4 Evaluating personalized expert recommendation: Precision and Recall at 5, 10, and 15 for six different topics across 11 approaches.. . . 36
3.4 Figure 3.4 Continued. . . 37
3.5 Comparing recommenders for cold start lists. . . 40
3.6 Effect of number of regions. . . 41
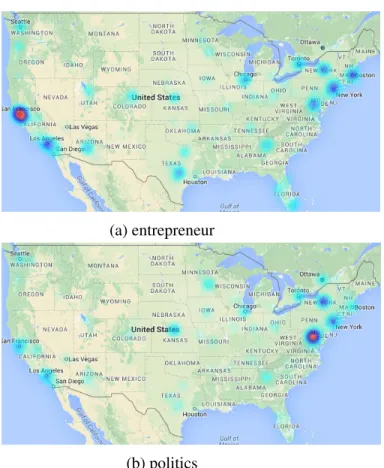
4.1 Geo-spatial distribution of users who are known for “entrepreneur” and “politics”. . . 49
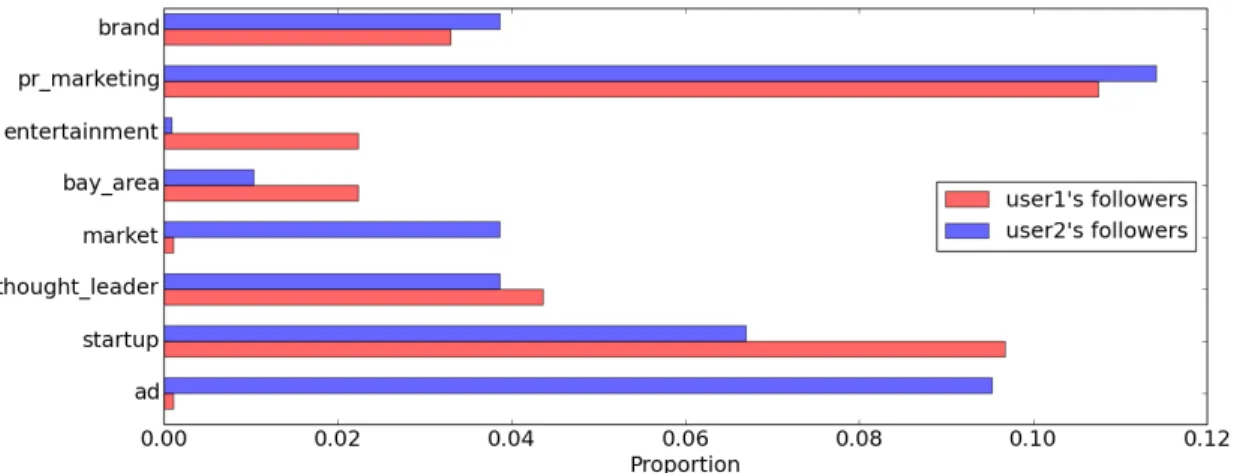
4.2 Proportion of followers who have the same tag in their known-for profile as the users. user1: red; user2: blue. . . 50
4.3 Box plot for precision@5 with respect to the number of regions. . . 63
4.4 Comparative performance of the methods modeling social influence. SC-PF performs best by making it dependent on both friends and tags.. . . 65
5.1 Overall BiasWatch Framework . . . 70
5.2 Effect ofmfor seed expansion via SIG. . . 85
5.3 Effect of seed expansion. . . 87
5.5 Performance for different seed expansion approaches with respect to dif-ferent fraction of retweeting links for all topics.. . . 90 5.6 Temporal volumes of top anti-fracking themes for seed expansions via
co-occurrence (Left) and via SIG (Right). . . 95 5.7 Performance comparison for VSM and OW. . . 99 5.8 Performance at different values of parameterα. . . 99 6.1 Spatial distribution of Twitter users who have listed (a) @MMFlint for
politics; (b) @RoyBlunt for politics; (c) @MMFlint as a filmmaker. . . 103 6.2 a: probability mass function of user’s popularity counts with a grid size of
2.5◦ ×2.5◦ in terms of latitude by longitude. b: histogram of the number of geo-topic tokens for a user. Similar distributions have been observed in other sizes of grids.. . . 107 6.3 Overall generative framework. . . 110 6.4 Left: average users’ geo-topic profile similarities with respect to the
Haver-sine distance between users. Right: boxplots for US GNN, US state, US random, world GNN, world timezone, world random. . . 112 6.5 Precision and recall for predicting user’s topical (top) and geo (down)
pro-file. Left: US. Right: world. . . 127 6.6 Performance comparison with respect to the size of grid. Left: US. Right:
world. . . 130 6.7 Precision@10 and recall@10 with respect toK2. . . 132
LIST OF TABLES
TABLE Page
3.1 Geo-tagged Twitter list data.. . . 22 3.2 Average expert entropy for different cities. . . 24 3.3 Average expert entropy and expert spread (miles) whenCDF = 0.5for
different topics. . . 26 4.1 Geo-tagged Twitter data. . . 58 4.2 Comparison of performance with alternative methods. BCPF generally
gives the best performance by integrating the contextual influence of tex-tual, geo-spatial and social factors, and these factors are able to comple-ment each other. . . 61 4.3 Top ranking tags for different areas obtained from latent location factors
and tag factors. . . 63 4.4 User’s inferred social influenceθf by uSC-PF and social influenceθf tfor
top ranking tags by SC-PF. . . 65 5.1 Top ten themes at different times for “fracking” discovered by seed
expan-sion; red for pro-fracking; blue for anti-fracking. . . 72 5.2 Datasets . . . 80 5.3 Turker labeling results of HITs . . . 81 5.4 Accuracy Comparison with alternative opinion bias estimators. Boldface:
the best result for each topic among all methods. ‘∗’ marks statistically significant difference against the best of alternative opinion bias estimators (with two sample t-test forp≤0.05). . . 91 5.5 AUC Comparison with alternative opinion bias estimators. Boldface: the
best result for each topic among all methods. ‘∗’ marks statistically sig-nificant difference against the best of alternative opinion bias estimators (with two sample t-test forp≤0.05). . . 91 5.6 Multi-category classification performance. . . 94
5.7 Top ten themes at different times for “vaccine”; red for pro-vaccine; blue for anti-vaccine. . . 95 5.8 Sample opinionated users and their corresponding tweets for “fracking”;
positive bias score represents pro-fracking. . . 96 6.1 Pearson correlation coefficient between user’s profile similarity and their
social similarity. . . 114 6.2 Twitter Datasets. . . 122 6.3 Overall comparison for the US dataset. ‘†’ marks statistically significant
difference over the best one-layered baseline. ‘∗’ marks statistically signif-icant difference over bHUF-2. Both are evaluated according to two sample t-test at significant level 0.05. . . 124 6.4 Overall comparison for the world dataset. ‘†’ marks statistically
signifi-cant difference over the best one-layered baseline. ‘∗’ marks statistically significant difference over bHUF-2. Both are evaluated according to two samplet-test at significant level 0.05. . . 124
1. INTRODUCTION
1.1 Motivation
We live in an age of unprecedented access to information and knowledge enabled by many large-scale online sharing systems – from social media services (e.g., Facebook, Twitter and LinkedIn), to question-answering sites sharing knowledge and expertise (e.g., Quora, Yahoo! Answers and Stack Overflow), to online encyclopedia sharing collec-tive knowledge (e.g., Wikipedia), to rating and reviewing applications publishing crowd-sourced reviews and ratings (e.g., Yelp, Foursquare and TripAdvisor).
A key feature of these information sharing systems is their increasing leverage of the power of human crowds: as primary contributors of knowledge and content (e.g., users who answer questions in Quora and share images in Pinterest), as annotators and raters of other resources (e.g., for surfacing high-quality content), as the main channel for infor-mation propagation (as in social media and networks), and so on. For example, Facebook — launched in 2004 — has now over 2 billion monthly active users as of June 30, 2017, generating over 695,000 status updates, 79,364 wall posts and 510,040 comments every minute [1]. Quora, a question-answering website dedicated to sharing knowledge and ex-pertise, has over 190 million monthly users since it is launched in 2009 with about 6,000 questions asked daily across 400 hundred topics [2]. Pinterest, an image-based online sys-tem, has 150 million monthly active users including 70 million users from the US, with 50 billion pins∗ and 1 billion boards already generated [3]. Even for the non-profit encyclo-pedia website Wikiencyclo-pedia, it now has over 5 million English articles as of July 2017 with 671 new articles added every day on average, and a total of about 30 thousand active edi-tors contributing over 3 million edits per month [4]. This evidence showcases the massive ∗A pin is an image that has been uploaded or linked from a website; a board is a collection of pins dedicated to a theme such as travel or food.
scale of human crowds powering these online information sharing systems.
Given these large and growing services, there comes the need to enable personalization of information resources for users in these services to surface high-quality content and feeds, to provide personally relevant suggestions, and so on. For example, Facebook and Twitter have adopted large-scale machine learning techniques to personalize timelines, push notifications, and suggest news feed for users [5, 6]. Quora has resorted to supervised machine learning approaches as well to rank answers [7] to show to viewers. Pinterest has also relied upon state-of-the-art machine learnings models to prioritize pins with high relevance scores and show them at the top of user’s home feed [8]. These personalization systems are often focused on customizing specific items like timelines and news feed based on user profiles, while not focused on the recommendation of users and experts.
Therefore, in this dissertation, we are focused on user-centered personalization in in-formation sharing systems. User-centered personalization is often different from item-centered personalization due to the unique nature and attributes of users, e.g., user’s de-mographic profile, user’s interests and expertise and user’s topical opinion, and thus is facing different sets of challenges. In the rest of the section, we will first present some key research challenges in user-centered personalization, and then describe the main con-tributions of this research, followed by high-level introductions of the rest sections in the dissertation.
1.2 Research Challenges
Previously, we described the massive scale of human crowds present in many infor-mation sharing systems, and how personalization is essential to providing user friendly services and experience by creating rich user models. We now identify some of the re-search challenges associated with these information sharing systems.
connecting the right person with the right resource. Many of the systems are opti-mized towards seeking information from popular experts with broad appeal. Conse-quently, users with specific information needs may not be satisfied with the answers of these general experts. For example, a user may be interested in the expert opin-ions of nearby local foodies, but less interested in the opinopin-ions of globally popular celebrity chefs. Bridging thispersonalization gapis the first key challenge.
• Second, many of these information sharing systems rely on a small pool of active do-main experts or prominent (top-ranked) users as the content contributors or sources of expertise. Consequently, these systems are not able to take advantage of the knowledge or expertise of the vast majority of users at large (long tail users). Fur-thermore, those domain experts or prominent users may become inactive due to retiring or simply loss of interests. Together, these factors may prevent the growth of these systems, with their purpose for information distribution not fully realized. Thus, how to effectively discover long tail users’ profiles is the second key chal-lenge.
• Third, the geo-spatial variations of these information sharing systems are typically not explored or distinguished. User interest or expertise, however, is inherently con-strained within certain geo-scope. For example, a user may be known for some top-ics only locally, while she is known for other toptop-ics more widely across the country. An information sharing system can be improved by uncovering and distinguishing such locality of user’s different topical expertise. Thus, how to effectively model
user’s geo-spatial profileis the third key challenge. 1.3 Dissertation Overview
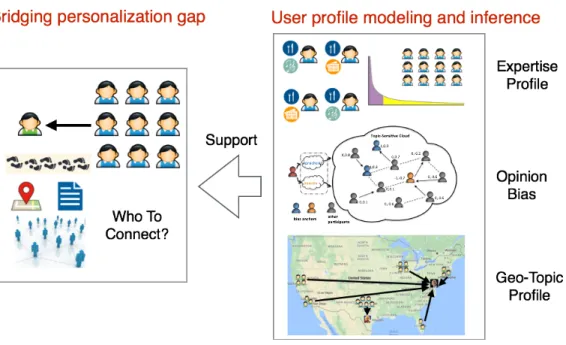
Therefore, in this dissertation research, we propose models and algorithms to facilitate the creation of new crowd-powered personalized information sharing systems. Our vision
Figure 1.1: Overview of the dissertation.
is of an information sharing system where the majority of users, in addition to a few top domain experts and prominent users, are able to provide high-quality information on their knowledge and contribute to the overall knowledge reservoir. The system should be able to automatically match information seekers to knowledgeable users in a personalized fash-ion so that their customized informatfash-ion needs can be met. This user-centric informatfash-ion sharing not only is able to tap the knowledge of most majority of users, but also bridge the gap between general information seeking and more personalized needs. Overall, our models and algorithms are able to provide: (i) personalized user recommendation to match information seekers with customized knowledgeable users based on their previous histor-ical actions and contextual information; (ii) accurate modeling of users’ profiles for long tail users, where our models can reflect user’s salient characteristics such as user’s topical interest, expertise and opinion. Figure 1.1 demonstrates a high level framework of the dissertation. Specifically, this dissertation research makes two unique contributions:
• The first contribution of this dissertation research lies in formalizing the problem of personalized expert recommendation and in proposing the first principled frame-work for addressing this problem. A major challenge for any approach (and indeed, one that has limited prior efforts to typically focus on broad, general experts) is the extreme sparsity of user behaviors that could be leveraged for building personal recommenders. To overcome the sparsity issue, we investigate the use of contex-tual information that can be exploited to build robust models of personal expertise. Through a fine-grained GPS-tagged social media trace, we study how spatial pref-erence for personally-valuable expertise varies across regions, across topics, and based on different underlying social communities, which we denote region, topic, and social-based locality, respectively. We integrate these different forms of prefer-ences into a matrix factorization-based personalized expert recommender, and con-duct extensive experiments. We conclude that our proposed model outperforms sev-eral alternative baselines. Specifically, we show that the integration of region, topic and social-based locality gives better performance over matrix factorization, respec-tively, and that the combination of these influence gives the best result among all, indicating that geo-spatial, topical and social factors are able to complement each other in personalized expert recommendation.
• To support and complement the personalized recommendation on experts, the sec-ond contribution of this dissertation research focuses on modeling and inferring user profiles in online information sharing systems and social media. Our previous re-search establishes a framework of personalized expert recommendation in which users are recommended to connect to experts who are more likely to satisfy their personalized information needs. However, many real-world systems usually rely on a small portion of active domain experts or dominant (top-ranked) users among
all participants, and are not able to take advantage of the knowledge and expertise of the long tail of users. In order to tap the knowledge of most majority of users, we provide frameworks and algorithms to accurately and comprehensively model user profile. Specifically, we have investigated and explored user models to discover user’s known-for profile, user’s opinion bias, and user’s geo-topic profile with each described as follows:
—Discovering user’s known-for profile. We first develop a context-based model called Bayesian Contextual Poisson Factorization to discover what users are known for by others. Our model considers as input a small fraction of users whose known-for profiles are already known and the vast majority of users known-for whom we have little (or no) information, learns the implicit relationships between user’s known-for profiles and their contextual signals, and finally predict known-known-for profiles known-for those majority of users. Our method moves beyond just modeling the content a user generated, and naturally models and integrated additional contextual factors that provide implicit linkages between users for improved known-for profile estimation. —Discovering user’s opinion bias. In a different aspect of user profiling, we ex-plore and investigate user’s topic-sensitive opinion bias for richer user profiles, and demonstrated how user’s opinion bias can be exploited to recommend other users with similar opinion in social media systems. Specifically, we propose a lightweight system called “BiasWatch” for (i) semi-automatically discovering and tracking bias themes associated with opposing sides of a topic; (ii) identifying strong partisans who drive the online discussion; and (iii) inferring the opinion bias of long-tail users. By taking just two hand-picked seeds to characterize the topic-space (e.g., “pro-choice” and “pro-life”) as weak labels, we develop an efficient optimization-based opinion bias propagation method over social/information network. These inferred
opinion bias can be used as a different dimension to augment user’s profiles.
—Discovering user’s geo-topic profile. Finally, we have studied how a user’s top-ical profile varies geo-spatially, how we can model a user’s geo-topic profile, and the implications for personalized user recommendation in information sharing system. Generally, the quality of user’s profile is often dependent on the social-spatial prop-erties of the systems in which they arise. Specifically, our analysis on the impact of geo-location on user’s topical profile indicates the pair-wise interactions between geo-locations and user’s topical profile. Motivated by the observations, we propose the modeling of fine-graineduser geo-topic profiles to capture the aforementioned pair-wise interactions. Concretely, we first propose a multi-layered Bayesian hierar-chical user factorization which can learn a more expressive user model than single-layered models. We then investigate how user’s contextual information, specifically, user’s geo-location and social ties, correlates with one’s geo-topic profile, and then propose to integrate these contexts into the two-layered hierarchical user model for better representation of user’s geo-topic preference by others.
The rest of this dissertation is organized as follows:
• Section 2: In this section, we discuss related work on user profiling, more specifically, on user interests, expertise and opinion bias. We also discuss user context in social systems and how it can be used to improve user profiling. Finally, we discuss some related work on modeling user’s implicit feedback and more generally, on modeling discrete count data.
• Section 3: In this section, we introduce the problem of personalized expert recom-mendation, and propose a principled matrix factorization based approach to effectively recommend personal experts to users. We evaluate the method against several alter-native baselines and study the influence of different localities on the recommendation
performance.
From Section 4 to Section 6, we focus on modeling and inferring user profiles by discov-ering user’s known-for profile, by discovdiscov-ering user’s opinion bias, and by discovdiscov-ering user’s geo-topic profile.
• Section 4:In this section, we introduce the problem of user known-for profile discovery to model and propose a probabilistic generative framework called Bayesian Contextual Poisson Factorization to effectively learn what a user is known for by others. We develop an efficient variational inference to learn latent parameters, evaluate the method against several baselines and study how user’s contextual information affects final performance. • Section 5: In this section, we build a systematic framework – BiasWatch – to discover biased themes and estimate user’s opinion bias quantitatively under the context of con-troversial topics in social media. We propose an efficient optimization scheme to propa-gate opinion bias from prominent users to “regular” users. We then evaluate BiasWatch by comparing against several alternative approaches and study the effect of framework’s parameters on classification performance. Finally, we demonstrate how these inferred opinion bias scores can be exploited to recommend similar-minded users.
• Section 6: In this section, we introduce a multi-dimensional user profiling concept called user’s geo-topic profile, and propose a multi-layered Bayesian hierarchical user factorization to model where users are popular for what topic. We then investigate the impact of user’s contexts on user’s geo-topic profile and propose an enhanced model to integrate their influence. Finally, we evaluate our proposed models against several base-line methods and study the effect of model parameters on final predicative performance. • Section 7: We conclude with a summary of the contributions of this work, and provide
2. RELATED WORK
In this section, we discuss several lines of work related to our dissertation including user profiling, user context, and its application for different tasks in information systems. We also discuss some related work on modeling user’s implicit feedback and more gener-ally, on modeling discrete count data.
2.1 User Profiling
User profiling is an important task, with many efforts building user’s topic interests and demographic profile for personalized search [9, 10, 11, 12], recommender systems [13, 14, 15, 16, 17], expert mining [18, 19, 20] and targeted advertising [21]. User profiles are also used to provide recommendations for online activities such as commenting on news stories [15] and mentions in micro-blogging systems [22].
2.1.1 User Interests and Expertise
Finding user interests and expertise is critical for many important applications. Many of these applications seek to find interests or expertise either explicitly [23, 24, 19, 13] via user relevant features and tags, or uncover latent interest or expertise [21, 16, 17] with models such as matrix factorization. Dou et al. [9] built user interest profile by prede-fined topic categories for personalized webpage re-ranking. Ahmed et al. [21] proposed a statistical framework to extract user’s dynamic interest profile for behavioral targeting.
To increase user base and engagement, many works [24, 25, 26, 27, 28, 16] create rich user models for better user experience in social media. For example, Hong et al. [26] focused on modeling retweeting behavior on Twitter using factorization machines on users and tweets. Zhao et al. [16] proposed a matrix factorization based approach to build topical profiles by distinguishing user behaviors. Jiang et al. [27] presented a
probabilistic matrix factorization model to exploit social context to better predict user adoption behaviors on Weibo. Chen et al. [24] built topic profiles of users with bag-of-words model to recommend conversations in Twitter.
Besides user’s topic interest profile, other works[29, 30, 31] focus on inferring user’s attribute and demographics profile such as gender and education. For example, Mislove et al. [31] proposed community detection based approaches to infer user’s college and major. Li et al. [29] presented a weakly-supervised approach to extract user’s job and education.
Many previous works [32, 33, 34, 35] have focused on finding general topic experts in many domains (e.g., enterprise corporate, email networks), with a recent emphasis on social media and microblogging sites [36, 37, 38]. Weng et al. [38] proposed a PageRank-based approach to find topic experts by taking advantage of both topical similarity between users and social link structure. Pal and Counts [37] introduced a probabilistic clustering followed by a within-cluster Gaussian ranking framework to find topic authorities using nodal and topical features on Twitter. Ghosh et al. [36] proposed and built a system called Cognos to find topic experts by relying on Twitter Lists (though not with any geo-spatial information, as in this work). Recently, Cheng et al. [39] addressed the problem of identifying local experts on Twitter. Our dissertation work extends on these prior efforts by focusing onpersonalized experts for users.
2.1.2 User Opinion Bias
There has been considerable research effort devoted to exploring political polariza-tion, assessing media bias of major news outlets, and assessing user sentiment towards particular topics.
Political polarization has been a topic of great interest in the past decade and studied in news articles [40], online forums [41] and social media [42, 43, 44, 45, 46, 47, 48]. Adamic and Glance [42] demonstrated the divided community structure in the citation network of
political blogs. Conover et al. [45] and Livne et al. [47] showed that there exists a highly segregated network structure using modularity. Guerra et al. [46] compared polarized and non-polarized networks and proposed a new measure to determine whether a network is polarized given that the network is also modular. Since knowing users’ political orienta-tion can be of great importance for understanding the overall political landscape, many approaches have been proposed to classify a user’s political identity. Conover et al. [44] and Pennacchiotti and Popescu [48] exploit text and network features for classification. Akoglu [41] proposed to use signed bipartite opinion networks for the classification and ranking of user’s political polarity on forum data. Zhou et al. [40] applied semi-supervised learning methods to classify news articles and users’ political standing. Cohen et al. [43] employ supervised methods to classify political users into groups with different political activities, and conclude that it is hard to infer “ordinary” users’ political orientation. In our work, instead of simply focusing on the classification of user’s political orientation, we are interested in developing a flexible tool to explore controversial themes and discover their underlying users’ degree of opinion bias on a topic basis. We show that user’s opinion bias can be leveraged to improve other applications such as user recommendation.
Apart from user-oriented political orientation, some works have explored media bias. Groseclose et al. [49] proposed a new measure to quantify media bias by comparing the number of citations to think tanks and policy groups to those of Congress members. Gentzkow et al. [50] also proposed a media bias measure which considers the frequency of phrases quoted by Congressional members of Republican and Democratic parties in newspapers. Lin et al. [51] focused on the measure of coverage quantity to compare the extent of bias between blogs and news media. Wong et al. [52] quantified the political leanings of media outlets on Twitter using aggregated retweeting statistics. Our work differs from these in that we target the opinion bias of “regular” users instead of prominent media, and with respect to different controversial topics instead of only political leanings.
There are also prior works which infer user’s sentiment toward a topic in social media or online forums. Tan et al. [53] proposed a semi-supervised approach to inferring users’ sentiment using social network information. Kim et al. [54] and Gao et al. [55] proposed to use a collaborative filtering like approach to estimate user-level sentiment. Lu et al. [56] proposed to use content and social interactions to discover opinion networks in forum dis-cussions. However, our work has two differences from these and other sentiment-oriented approaches. The first is that many of these works require a significant amount of manually labelled tweets or users as ground truth. In our work, we develop automatic approaches using crowdsourced hashtags as seeds to substantially reduce manual labor. The second is that we focus on intrinsic opinion bias instead of sentiment. Sentiment [57] centers around users’ attitude or emotional state, usually reflected by the use of emotional words. How-ever, opinion bias can also be reflected by the news or factual information she chooses to post, which may lack any prominent emotional words.
2.2 Exploiting User Context
Contextual information in social media has been widely used in previous works [58, 59, 60, 61, 62, 63, 28, 64] to learn better user profiles and improve task performance. Various contextual signals have been exploited to improve learning user’s interests and expertise, including text [65, 63, 66, 67, 68], social networks [27, 60, 14], geographical footprints [69, 70], behavioral signal [13, 71], temporal context [72, 28], emotions and sentiment [73, 74], and linguistic activity [75].
A seminal work by Singh and Gordon [62] proposed collective matrix factorization to simultaneously factor several matrices encoding contextual information for better predic-tion of user-movie ratings. Wang and Blei [63] proposed collaborative topic regression to learn latent user preference by modeling both ratings and content. Similarly, Gopalan et al. [58] also modeled both user’s ratings and content but with Poisson factorization. Jamal
et al. [59] proposed a context dependent factor model to learn general latent factors of entities in social networks for better recommendation. Guy et al. exploited user’s tagging behavior to improve content recommendation [13]. Temporal information has also been used in [28] to learn both user-oriented topics and time-oriented topics. Other contex-tual information used to learn user preference includes domain-specific communities [64] and social relations [60, 61] which are used to regularize latent factors between socially connected users.
Geographical footprints have also been widely explored in many location-based ap-plications [76, 69, 77, 78, 79, 80, 81, 82, 83]. One of the most popular apap-plications is point-of-interest (POI) recommendation on social networks, where geographical influence is combined with user preference for better performance. For example, Ye et al. [84] explored the spatial clustering phenomenon and proposed a unified POI recommenda-tion framework combining user preference, geographical influence, and social influence. Cheng et al. [76] proposed a multi-center Gaussian model to model user’s check-in behav-ior, which is used as input for a generalized matrix factorization framework. Liu et al. [85] proposed a geographical probabilistic factor analysis framework, which jointly models the effect of geographical distance, user preference, POI popularity and user mobility. Another different application that utilizes geographical footprints is the rating prediction problem in Yelp [86], where Hu et al. observed weak positive correlation between a business’s ratings and its neighbor’s ratings, and used this observation to improve rating predictions. Other works have used geographical influence for rating prediction in Yelp [69], activ-ity recommendation with GPS history [83], expert recommendation [80] and event-based group recommendation [82].
2.3 Modeling User’s Implicit Feedback
In recommendations when only implicit feedback is available, one-class collaborative filtering approach [87, 88, 82] can be used for learning rank between items. Rendle et al. [88] proposed a pairwise method called bayesian personalized ranking (BPR) framework which models the order of items. Following this, Rendle et at. [89] extended matrix factorization to tensor factorization for tag recommendation. Chen et al. [87] adapted BPR framework for tweet recommendation by incorporating tweet topic factors, social relation factors and other explicit features. Zhang et al. [82] also used pairwise matrix factorization to recommend event-based groups to users with location features, social features and tags. Krohn-Grimberghe et al. [90] extended this framework to model both user’s feedback and social relations by optimizing weighted loss functions so that social relation is considered as part of objective function.
More generally, user’s implicit feedback is often in the form of binary data, which can also be considered as discrete count more broadly. An emerging line of research [72, 91, 92, 93, 94] has focused on modeling discrete count data with Gamma-Poisson distribution instead of traditional Gaussians for recommender systems [95, 91], topic mod-eling [58], spatial data analysis [93] and political science [96]. For example, Gopalan et al. [91] proposed a hierarchical Poisson matrix factorization for item recommendation to users based on implicit feedback, and later developed collaborative topic Poisson fac-torization [58] by integrating topic modeling for better article recommendation with user clicks. Yu et al. [93] proposed a weakly-supervised labeled Poisson factor model to pre-dict the number of app openings at different locations through aggregated spatial data from mobile app usage. Zhou et al. [94] proposed to use beta-negative binomial process as a non-parametric Bayesian prior for an infinite Poisson factor analysis model. More recently, Schein et al. [96] have generalized two dimensional Poisson factorization to
Bayesian Poisson tensor factorization for inferring multilateral relations to analyze inter-national affairs between countries based on political events data. Zhou et al. [97] proposed Poisson gamma belief network, a multi-layer generative probabilistic framework based on Poisson distribution for modeling two-dimensional discrete count data. In our dissertation work, we exploit Bayesian Poisson factorization to model user’s implicit feedback and user’s popularity counts instead of probabilistic matrix factorization based on Gaussian distribution for better performance.
3. PERSONALIZED EXPERT RECOMMENDATION∗
In this section, we begin to address the first challenge in large-scale information shar-ing system — how to connect the right person with the right resource. To that end, we formalize the problem of personalized expert recommendation, and propose a principled matrix factorization based approach to effectively recommend personal experts to users. 3.1 Introduction
Finding and recommendingexpertsis a critical component for many important tasks. For example, the quality of movie recommenders can be improved by biasing the under-lying models toward the opinions of experts [98]. Making sense of mobile and social in-formation streams such as the Facebook newsfeed and the Twitter stream can be improved by focusing on content contributed by experts. Along these lines, companies like Google and Yelp are actively solicitingexpert reviewersto improve the coverage and reliability of their services [99]. More generally and in contrast to search engines and question-answer systems, experts can provide ongoing help for evolving and ill-specified needs, as well as personalized access to knowledge and experience that only experts possess.
Indeed, there has been considerable effort toward expert finding and recommendation, e.g., [32, 33, 18, 19, 34, 37, 38, 35]. These efforts have typically sought to identify topical experts with broad appeal, e.g., the top Java developer in an enterprise, the best lawyer in Texas. However, there is a research gap in our understanding of both (i) identifying per-sonal experts, that is experts who are of significance and importance to me, but perhaps not viewed so more broadly. For example, I may be interested in the expert opinions of nearby ∗Reprinted with permission from “Exploiting Geo-Spatial Preference for Personalized Ex-pert Recommendation” by Haokai Lu and James Caverlee, 2015. Proceedings of the 9th ACM international conference on Recommender Systems, 67-74, Copyright 2015 by ACM. DOI: http://dx.doi.org/10.1145/2792838.2800189.
local foodies, but less interested in the opinions of globally popular celebrity chefs; and (ii) how spatial preference for personally-valuable expertise varies across topics, across re-gions, and based on different underlying social communities. For example, technologists in Houston, TX may be more interested in the opinions of experts in nearby Austin and in more distant Silicon Valley, but less so in the opinions of experts from New York. Simi-larly, the reach of experts may vary by location, so that tech experts from Silicon Valley have a larger footprint than do experts from other regions.
Hence, in this section, we are interested to study the problem ofpersonalized expert recommendation by integrating the geo-spatial preferences of users and the variation of these preferences across different regions, topics, and social communities. These geo-spatial preferences are increasingly being revealed through the fine-grained geo-geo-spatial footprints of Instagram, Foursquare, and Twitter, among other mobile location sharing platforms. Concretely, we opportunistically leverage a collection of GPS-tagged Twitter users and their relationships in Twitter lists, a form of crowd-sourced knowledge whereby user A may label user B with a descriptor (like “technology”). In isolation these lists allow a user to organize a personal Twitter stream; in aggregate, the many labels applied to a target user in many lists can provide a crowdsourced expertise profile of the target user. Specifically, we propose and evaluate a matrix factorization-based personalized expert recommender that leverages three key factors:
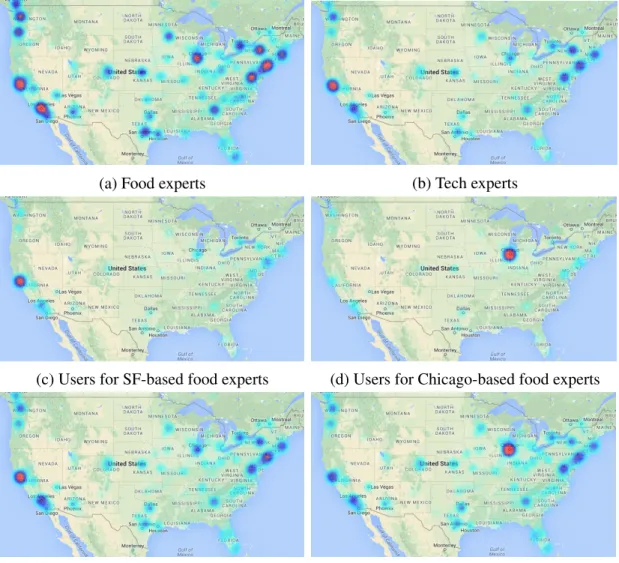
• Region-based locality, reflecting the variation in spatial preference from region to re-gion. For example, Figure 3.1c and Figure 3.1d shows that the preference of users for food experts varies greatly based on the location of the user (in essence, local users pre-fer local foodies). How can these regional difpre-ferences be captured and incorporated into a personalized expert recommender?
(a) Food experts (b) Tech experts
(c) Users for SF-based food experts (d) Users for Chicago-based food experts
(e) Users for SF-based tech experts (f) Users for Chicago-based tech experts Figure 3.1: Spatial distribution of experts (a, b) and for the users who have listed experts (c, d, e, f) based on geo-tagged Twitter lists.
For example, Figure 3.1c and Figure 3.1e demonstrate that spatial preference is much less local for the topic technology than for food. How can this topical variation be integrated into a personalized expert recommender?
• Social-based locality, reflecting the social connections between users and experts. For example, are users who are connected in an underlying social network more “similar” in their preferences for experts? Are experts who are more tightly coupled in the under-lying social network preferred by the same set of users?
Through extensive experimental validation, we find that each of these factors – region, topic, and social-based locality – improves the quality of personalized expert recommen-dation. And together, the proposed model achieves around 24% improvement in precision and 21% improvement in recall versus both a collaborative filtering and a baseline matrix factorization based recommender. Furthermore, we also find that the proposed approach can ameliorate the cold start problem when users have few experts on their lists, leading to more than 20% improvement over the baseline in precision and recall.
3.2 Preliminaries
In this section, we introduce the problem of personalized expert recommendation and outline our core approach.
3.2.1 Problem Statement
We assume there exists a set of usersU ={u1, u2, ..., uN}, whereN is the total number of users. From this set U, there are a number of recognized experts denoted as E = {e1, e2..., eM}, where M is the total number of experts. Each user has a preference over some of these experts, expressed as apersonalized expertise list. For example, Alice may prefer Beth to Candace in the topic of “Java programming”, but have no opinion on Doug. We then define the problem ofpersonalized expert recommendation as: Given a userui, identify the top-npersonally relevant experts toui. That is, can we further identify experts
Eva and Frank that are of personal interest to Alice? 3.2.2 Recommendation by Matrix Factorization
We tacklepersonalized expert recommendationusing latent factor matrix factorization [100]. We assume there is a factorpiassociated with each useruiand a factorqjassociated with each expert ej. The model defines a rating score between the list and the expert, denoted asyij, and factors the score into a latent space throughpi andqj as follows:
yij =pTi qj +bj (3.1)
Through this factorization, we can think of qj as the latent properties for expert ej, pi as the latent preference of user ui and bj as the popularity bias for ej. However, unlike the standard recommendation task, we do not have a rating score for each expert on the lists. Instead, we only have the implicit feedback for a list, which assumes a user prefers an expert who is already on the list to an expert who is not. Accordingly, the learning objective should be based on the pair-wise ranking between experts. In recommendations when only implicit feedback is available, the one-class collaborative filtering approach [87, 88, 82] can be used for learning a rank order among items. Similar efforts have been targeted at tag recommendation [89], tweet recommendation [87], and event-based groups [90, 82]. Here, we adapt the Bayesian Personalized Ranking (BPR) criterion proposed by Rendle et al. in [88] to our problem.
Formally, for a userui, an expert ek and an expert eh, suppose ui putsek on the list while noteh, we denote this pair aseui
k e ui
h , and the likelihood for this preference under BPR can be written as:
p(eui k e ui h ) =σ(yik−yih)whereσ(x) = 1 1 +e−x
Therefore, the likelihood for all users could be written as: p(R|Θ) = Y euik ∈Pui,euih ∈Nui,ui∈U p(eui k e ui h )
whereR is the set of all preference pairs,Θis the set of all parameters,Pui is the set of
experts included on ui’s list andNui is the set of absent experts forui. If Θhas a prior densityp(Θ), we can derive a bayesian version of the likelihood, where the prior is used to prevent the overfitting of the parameters as a form of regularization. Thus, the posterior log-likelihood to maximize is
p(R|Θ) = X
euik ∈Pui,euih∈Nui,ui∈U
ln(σ(yik−yih))−regularization
which can be learned through stochastic gradient descent (SGD) by iterating each of the preference pairs and updating the corresponding parameters.
3.3 Region, Topic, and Social-Based Locality
While promising, the baseline matrix factorization approach ignores the geo-spatial preferences of users and the variation of these preferences across different topics, regions, and social communities (as suggested by Figure 3.1’s intuitive support for these notions). Hence, we turn in this section to demonstrating how these factors manifest in real-world Twitter-based data and how each of these factors can be incorporated into a new personal-ized expert recommendation matrix factorization framework.
3.3.1 Data and Metrics
We begin by highlighting the data used here and two statistical measures – expert entropy and expert spread – to characterize region and topic-based locality. We then turn to the social properties of the dataset to demonstrate social-based locality.
Table 3.1: Geo-tagged Twitter list data.
topic # of lists # of experts # of listings sparsity(%)
news 35,539 20,295 287,321 0.04 music 17,945 7,896 160,286 0.11 sports 16,018 5,395 139,838 0.16 food 10,476 5,485 96,661 0.17 celebs 9,783 4,090 104,004 0.26 tech 13,046 10,760 125,178 0.26 general 30,000 36,217 289,528 0.03
Data. We use the geo-tagged Twitter lists collected in [18]. In total, there are about 12 million crowd-generated lists and 14 million geo-tagged listings, where a geo-tagged list-ing indicates a direct link from a list creator to an expert where both of their geo-locations are known. That is, each userui ∈U is associated with geographical coordinatescoordui.
Furthermore, for each list, there exist associated labels that list creators use to indicate the topic of that list. In the following analysis, we selected lists which include the most frequent unigram labels indicating typical topics as follows: news, music, tech, sports, celebs, and food. Additionally, we randomly sampled lists which include any unigram occurring more than 200 times in list labels. We denote this randomly sampled list data as “general”. Furthermore, we excluded experts who have only occurred in one list and also excluded lists which includes only one expert. After filtering, we have the geo-tagged Twitter list data statistics shown in Table 6.2. In the following sections, we refer to list creators asusersand list members asexperts.
Metrics. We discretize the continental US surface with a1◦by1◦geodesic grid to map the coordinates to discrete regions.∗ Formally, we have a total number ofK grids, which we call regions. We denoteK regions asR ={ri|i = 1,2, ..., K}, to which each coordinate ∗1◦by1◦is approximately 70 miles by 50 miles at latitude40◦. We also tested a finer mesh of0.1◦by0.1◦, which gave
inside the US can be mapped. Furthermore, we assume for an expert e, there are totally neusers who put eon their lists. Among them, we letUe be the set of users for experte, andUe
ri be the set of users from the regionri. Thus, the probability of experte’s user from
the regionrican be defined asperi =
|Ue ri|
P
ri∈R|Urie|. With these preliminaries, we quantity the
geographical characteristics of expertise with: Expert entropy. Theexpert entropyis defined as
H(e) =−X ri∈R per ilog(p e ri)
This measure indicates the degree of randomness in spatial distribution of the users for an expert. It ranges from 0 when all users for the expert are only from one region, tologK when user’s distribution is uniform across all regions. Thus, it implicitly reflects the level of an expert’s recognizability across the entire country.
Expert spread. While entropy provides insights into the spatial distribution of users, it lacks explicit consideration for the distance between a user and an expert. Hence, we define another measure calledexpert spreadas follows:
S(e) = M edianui∈Ue(d(coorde, coordui))
whered is the distance between two locations, computed with Haversine function to ac-count for the shape of the earth as follows:
d= 2rarcsin(phaversin(φ2−φ1) +cos(φ1)cos(φ2)haversin(ψ2−ψ1))
wherehaversin(θ) = sin(θ/2)2 is the Haversine function, r is the redius of the earth,φ
represents the latitude and ψ the longitude. The expert spread indicates how far a typical labeler is from an expert, thus can be considered as the localness of an expert.
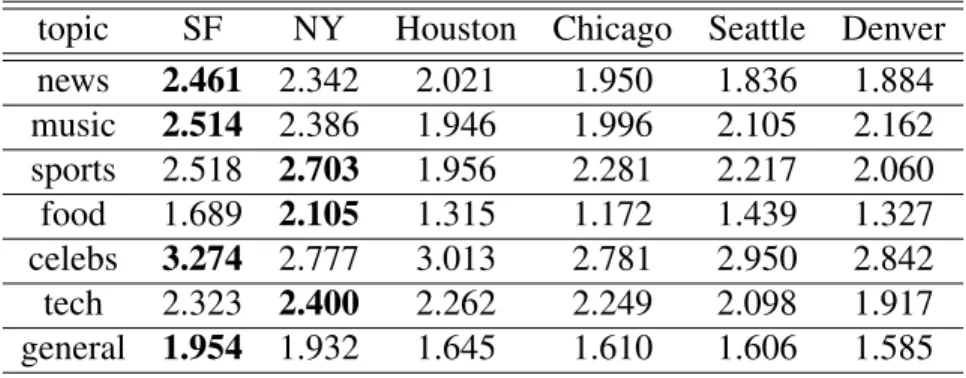
Table 3.2: Average expert entropy for different cities. topic SF NY Houston Chicago Seattle Denver news 2.461 2.342 2.021 1.950 1.836 1.884 music 2.514 2.386 1.946 1.996 2.105 2.162 sports 2.518 2.703 1.956 2.281 2.217 2.060 food 1.689 2.105 1.315 1.172 1.439 1.327 celebs 3.274 2.777 3.013 2.781 2.950 2.842 tech 2.323 2.400 2.262 2.249 2.098 1.917 general 1.954 1.932 1.645 1.610 1.606 1.585 3.3.2 Region-Based Locality
In Figure 3.1c and 3.1d, we observed that food experts from San Francisco and Chicago are preferred by users nearby. How does this observation manifest according to our sta-tistical measures? To that end, we select experts from the following cities: San Francisco (SF), New York (NY), Chicago, Houston, Denver and Seattle. We first show the average expert entropy for these cities with respect to different topics in Table 3.2. As can be observed from the table: (i) Experts from different geo-locations have different levels of recognizability across the country; and (ii) Generally, experts from SF and NY are popular in more regions than those from other geo-locations, indicating that SF and NY have a greater impact on expertise curation for users on Twitter.
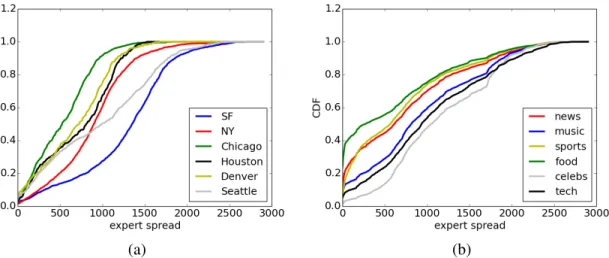
In Figure 3.2a, we examine expert spread for these cities. We can see that generally, experts from different geo-locations have different levels of locality, with experts from Chicago and SF having the smallest and largest expert spread. This indicates that com-pared to other cities, Chicago has the most local influence on expertise curation while SF reaches the farthest. Combined with the observations from Table 3.2, we conclude that
experts from different regions may have different levels of locality, i.e., some may reach a wider geographical scope but others may be only locally popular.
(a) (b)
Figure 3.2: CDF of expert spread (a) for different cities and (b) for different topics.
Integrating region-based locality. Since the observed region-based locality reflects col-lective opinion, how can we integrate it into personalized expert recommendation? That is, if we know the geo-location of a user, can we recommend experts who are popular around the user’s geo-location? As can be observed in Figure 3.1, an expert’s popularity is not necessarily linear in the distance between user and expert; rather, it is often in the form of “clusters”, i.e., experts may be popular in one region but not in other regions. Thus, we introduce the concept of “regional popularity”, where we parameterize the popularity of each expert by regions, with the regional popularity to be learned from training.
Concretely, we assume the geographical space is partitioned into K regions. For an expertej and a regionri, we assume there is a popularity parametersij associated withri andej. This parameter is used to capture the degree of popularity that expertej receives in region ri. Thus, if we have a total ofM experts, the popularity parameters constitute the matrixS of dimensionK byM, which represents regional popularity for all experts. Each columns.jrepresents the popularityej receives in all regions. Then, given a userui, the popularityej receives at the region whereuiis from is denoted assc(ui)j, wherec(x)is
Table 3.3: Average expert entropy and expert spread (miles) whenCDF = 0.5for differ-ent topics.
topic food news tech sports music celebs entropy 1.661 2.048 2.235 2.247 2.267 2.868
spread 290 630 950 580 830 1060
a function mapping a user to its region. We usescij instead ofsc(ui)j for convenience. By
integrating the matrixSto the original matrix factorization, we have:
yij =pTi qj+scij (3.2)
We denote Equation 3.2 as the Geo-Enhanced factorization (GEF). Note that GEF is re-duced to Equation 3.1 when K = 1. The GEF approach has the advantage over the baseline matrix factorization of explicitly capturing and learning expert regional popular-ity.
3.3.3 Topic-Based Locality
In the previous analysis of expertise, we observed that expert entropy can be impacted by geo-locations (see Table 3.2). Additionally, this table also implies that expert entropy can be impacted by the choice of topic. To further observe the geo-spatial distribution of expertise for different topics, we list the average expert entropy for the six sample topics in Table 3.3. As we can see, celebs has the largest entropy, which indicates that users interested in celebrity are most widely spread across the country; while food has the smallest entropy, indicating that users interested in food experts are most concentrated in certain regions. This is intuitively reasonable since a celebrity is very likely to have a better chance of being known in the whole country than a food expert from a certain location.
In Figure 3.2b, we show the cumulative density function against expert spread for dif-ferent topics. We can see that, for a fixed spread value, the topic food gives the largest cumulative probability, indicating that users interested in food are closest to the experts; while users interested in celebrity are farthest. We also show the expert spread when the CDF is 0.5 in Table 3.3. We can see that the topics with increasing expert spread are or-dered as: food < sports < news < music < tech < celebs, with food having the smallest ex-pert spread of 290 miles, and celebs having the largest exex-pert spread of 1060 miles, which is almost half the distance from the west coast to east coast of the US. Combined with the previous observation on expert entropy, we can conclude that the topic food is the most local among all, with users mostly concentrated in local regions of experts, while the topic celebs is the least local, with users scattered across the country. In another word, users interested in food tend to select food expert nearby, while users interested in celebrity do not have such geographical constraints, and users interested in other topics fall in between. Overall, we can conclude thatexpert’s regional popularity can vary by topic; in other words, users may have different regional preference for experts because of their topic interests.
Integrating topic-based locality. Now that we have observed that topic locality can in-fluence user’s preference for experts, it is important that user’s interests should be aligned with the interests of the experts to be recommended. Since each Twitter list is labeled with certain keywords, we can aggregate all of the labels for an expert in all lists he ap-pears. As a result, an expert ej has a description dej consisting of the aggregated labels.
We then introduce a user latent topic factor tui, representingui’s topical preference, and
expert topic factor t¯ej, representing the topical property of ej. Thus, the inner product
tT
uit¯ej indicates an affinity score of user ui and expert ej with respect to topic. Here, ¯tej
is treated as known throughdej, andtui is treated as unknown to be learned. The reason
term label “food” occupy about 60% percent of total lists with any “food” in its labels. But often, a list is very focused on finer aspects of a topic. For example, a list labeled with “food” may include many “wine” experts, implying that we should also consider expert candidates labeled with “wine”. By making tui unknown, we are forcing the model to
learn topic aspects of a user from those of experts she selected. For convenience, we use ti instead oftui and¯tj instead of¯tej afterwards. Thus, our Topic-Enhanced factorization
(TEF) can be written as:
yij =pTi qj+tTi ¯tj (3.3)
Here, we treat each label as a dimension oft¯j. Through the explicit handling of each user’s topic aspects, it is expected that user’s interests are aligned with the interests of the experts to be recommended.
Fusion of region and topic-based locality. Naturally, we can integrate both region and topic-based locality into the model. We adopt a linear model for the integration of Equa-tion 3.2 and EquaEqua-tion 3.3, resulting in our Geo-Topic Enhanced factorizaEqua-tion (GTEF):
yij =pTiqj +scij +t
T
it¯j (3.4)
The intuition is when we know the region of a user and her topic aspects (by looking at the labels of her selected experts), we can recommend an expert both topically and geographically relevant.
3.3.4 Social-Based Locality
In addition to the modeling of region and topic based locality, we are also interested to explore if social connections among users and experts can improve expert recommen-dation. Our intuition is that (i) people who are connected by social ties have a higher probability to have similar interests; (ii) people who are socially related may have a higher
(a) (b)
Figure 3.3: (a): CDF for similarity between experts; (b) CDF for the probability of an expert on a list.
probability to select who they follow as experts.
As evidence of social-based locality, in Figure 3.3a, we compare the similarity of ex-perts for two cases: (i) when one expert follows the other; (ii) when no tie exists between two experts. Here, similarity of experts is defined as the cosine similarity computed by viewing each expert as a vector of all users, with each element being a value indicating whether the expert is listed by the user or not. Thus, a large similarity of two experts in-dicates that they often occur on the same list. We can observe that experts who follow the other generally have a larger similarity. We also compare the probability of an expert se-lected on a list in Figure 3.3b for two cases: (i) when experts are followed by the user; and (ii) when experts are not followed by the user. We can see that the chance for an expert to be listed by a user is boosted significantly when that expert is already followed by the user. Based on these observations, we individually model three kinds of social relationships: User-user relationship. In this case, the following relationship is from a list creator to another list creator. When one user follows another, we assume that their preference is more similar to each other than those who do not. In terms of modeling, we adopt the
approach of regulating their latent factors as in [101]. Formally, suppose there are userui anduj, assumeFu
i is the set of usersui follows, the social regularization incurred by user user relationship can be written as:
N X i=1 X f∈Fu i w(ui, uf)||pi−pf||2
wherew(ui, uf) represents the similarity between ui anduf. Thus, ifui anduf is more similar, the latent preference factorpiandpf is also closer. Here, we use cosine similarity of users as the weighting scheme. The cosine similarity of users is computed by viewing each user as a vector of all experts, with each element taking a value — 1 if the expert is on the list, 0 if not.
Expert-expert relationship. In this case, the following relationship is from an expert to another expert. Using a similar approach as in the previous case, we regulate their latent factors so that experts following the other have similar latent factors. Formally, assume Fe
i is the set of experts ei follows, the social regularization incurred by expert expert relationship can be written as:
M X j=1 X f∈Fe j w(ej, ef)||qj −qf||2
where w(ej, ef) represents the similarity between ej and ef. Here, we also use cosine similarity of experts as the weighting scheme.
User-expert relationship. In this case, the following relationship is from a user to an expert. Unlike the previous two kinds of social ties, this relationship links two different entities, and so the regularization approach is ill-suited here. Instead, we explicitly model
these relationships with a bias term added to Equation 3.4 as follows:
yij =pTi qj+scij +t
T
i ¯tj +θibij (3.5)
wherebij takes a boolean value 1 ifuifollowsej, and 0 if not. θiis a weighting parameter to be learned. Thus, by adding a personalized bias term for each user, the model can take advantage of the following ties between user and expert.
3.3.5 Model Training
Combining the social regularization and Equation 3.5, the final objective function to maximize can be written as:
X euik ∈Pui,euih∈Nui,ui∈U ln( 1 1 +e−(yik−yih)) − β1 2 N X i=1 X f∈Fu i w(ui, uf)||pi−pf||2 − β2 2 M X j=1 X f∈Fe j w(ej, ef)||qj −qf||2−regularization
where L2-norm regularization is adopted, with β1 and β2 as the corresponding
regu-larization parameters. In summary, the parameter set Θ to be learned through SGD is {pi, qj, ti, θi, s.j}. For each iteration of SGD, we need to sample a userui, and fromui’s list, an expert ek. Due to the large size of absent experts for each user, we also need to sample the set Nui. Here, we adopt the strategy of random sampling. Then, for each
sampled triplet< li, ek, eh >, we update each parameter value by taking a step along its gradient ascending:
Θt+1 = Θt+∂Likh ∂Θ
where Likh is the posterior log-likelihood for the triplet < li, ek, eh >, and is the step size.
Update of S. For expertekandeh, the corresponding parameters to update ares.kands.h. If the region ofui isci, then the parameters.k ands.hcan be updated with
∂Likh
∂sjk =−I(j =ci)ˆe+βscik,
∂Likh ∂sjh
=I(j =ci)ˆe+βscih
whereeˆ= e−(yik−yih)
1+e−(yik−yih), I(j = ci)is a Kronecker delta function that gives value 1 if and
only ifj =ci, forj = 1, ..., K, andβ is a regularization parameter.
Update ofti andθi. Similarly, we have the gradient fortiandθias follows: ∂Likh
∂ti =−ˆe(¯tk−¯th) +βti, ∂Likh
∂θi =−ˆe(bik−bih) +βθi
Update of pi, qk and qh. Since p andq are socially regularized, we have the following socially regularized gradients:
∂Likh ∂pi =−ˆe(pk−ph) +βpi+β1 X f∈Fu i w(ui, uf)(pi−pf) ∂Likh ∂qk =−ˆepi+βqk+β2 X f∈Fe i w(ek, ef)(qk−qf)
The gradient forqh can be obtained similarly asqk. 3.4 Experimental Evaluation
In this section, we report on experiments to evaluate the proposed Geo-Topic Enhanced Factorization with Social ties (GTEF-S) for personalized expert recommendation.
Specif-ically, we seek answers to the following questions:
• How well does the proposed method perform compared to alternative baselines? Does region, topic and social-based locality give improvement individually, and if they do, do they complement each other?
• How well does it perform in cold-start situation, i.e., for users who have very few experts on their lists?
• Does the number of regions affect performance? If so, how? 3.4.1 Data Preparation and Experimental Setup
For evaluation, we randomly partition experts for a user into 50% for training and 50% for testing. To determine the number of negative experts for each user, we experimented with{50,100,150,200,250}and selected 150 for a tradeoff between accuracy and com-putational efficiency. For latent factor dimension, we empirically select 20 for all methods. For regularization parametersβ, β1 andβ2, we use cross-validation for tuning and select
0.02, 0.01 and 0.015, respectively. For gradient step, we initialize it with the step size 0.025, and decrease it to its 98% after each pass throughout all triples. This strategy is shown to be effective in reducing the number of iterations for the method to converge [69]. In the modeling of region locality, it is assumed that the continental US has been parti-tioned intoKregions. Instead of using a gridding approach, we resort tok-means cluster-ing to obtain the partitions by clustercluster-ing the geo-locations of the entire set of usersU. We choose a clustering approach based on Euclidean distance because the geo-spatial distribu-tion of users exhibits a clustering effect, as shown in Figure 3.1, and can be satisfactorily captured byk-means clustering. In section 3.4.5, we evaluate the effect of the number of regionsK. For other experiments, we selectK to be 80.
For evaluation metrics, we adopt Precision@k (Prec@k) and Recall@k (Rec@k). Prec@krepresents the percentage of correctly recommended experts out of the topk