IJEDR1804101
International Journal of Engineering Development and Research (
www.ijedr.org
)
565
Misaligned Image Integration Technique with Local
Linear Model using Bilinear Interpolation
1Dr. S. Panneer Arokiarj, 2Vinumon Jacob 1Associate Professor, 2Assistant Professor
1Periyar E.V.R College(Autonomous), Tiruchirapalli, 2Girideepam Institute Of Advanced Learning, Kottayam
_____________________________________________________________________________________________________
Abstract - The purpose of medical image fusion is to extract and synthesize the main features of multimodality images; therefore, the quality of image fusion highly depends on the performance of image feature extraction. In this project BOX Filtering is applied to a single source images. Box filtering involves replacing each pixel of an image with the average in a box propose a novel explicit image filter called guided filter for image fusion which is derived from a local linear model, the guided filter computes the filtering output by considering the content of a guidance image, which can be the input image itself or another different image. The fused image can be again denoised by Bilinear Interpolation. Bilinear interpolation is often used to improve image quality after performing spatial transformation operations such as digital zooming or rotation. The necessity of rescaling images arises in many different situations. For instance, in the adjustment of an image to a screen, in the configuration of an image to be printed orin a simple zoom done on a display are examples of common rescaling situations. Basically there are two different kinds of rescaling depending on whether we are interested on enlarge or shrink the original image. In both cases, the most common procedures use interpolation methods. There are many different interpolation methods for image processing. The most widely used are the Nearest Neighbor Interpolation, BilinearInterpolation, Bicubic Interpolation and Lanczos Interpolation.
Keywords - Image Integration, Image Fusion, Box Filtering, Guided Filtering, Bi-linear Interpolation
_____________________________________________________________________________________________________
1. Introduction
1.1 Image Processing
Image processing is a method to perform some operations on an image, in order to get an enhanced image or to extract some useful information from it. It is a type of signal processing in which input is an image and output may be image or characteristics/features associated with that image. Nowadays, image processing is among rapidly growing technologies. It forms core research area within engineering and computer science disciplines too.
There are two types of methods used for image processing namely, analogue and digital image processing. Analogue image processing can be used for the hard copies like printouts and photographs. Image analysts use various fundamentals of interpretation while using these visual techniques. Digital image processing techniques help in manipulation of the digital images by using computers. The three general phases that all types of data have to undergo while using digital technique are pre-processing, enhancement, and display, information extraction. Since digital image processing has very wide applications and almost all of the technical fields are impacted by DIP, we will just discuss some of the major applications of DIP. Digital Image processing is not just limited to adjust the spatial resolution of the everyday images captured by the camera. It is not just limited to increase the brightness of the photo.
1.1.1 Applications of image processing
The field of digital image processing has experienced continuous and significant expansion in recent years. The usefulness of this technology is apparent in many different disciplines covering medicine through remote sensing. The advances and wide availability of image processing hardware has further enhanced the usefulness of image processing. Medical applications, Restorations and enhancements, Digital cinema, Image transmission and coding, Color processing, Remote sensing, Robot vision, Hybrid techniques, Facsimile, Pattern recognition
1.2 Medical Imaging
Medical imaging is the technique and process of creating visual representations of the interior of a body for clinical analysis and medical intervention, as well as visual representation of the function of some organs or tissues (physiology). Medical imaging seeks to reveal internal structures hidden by the skin and bones, as well as to diagnose and treat disease. Medical imaging also establishes a database of normal anatomy and physiology to make it possible to identify abnormalities. Although imaging of removed organs and tissues can be performed for medical reasons, such procedures are usually considered part of pathology instead of medical imaging.As a discipline and in its widest sense, it is part of biological imaging and incorporates radiology which uses the imaging technologies of X-ray radiography, magnetic resonance imaging, medical ultrasonography or ultrasound, endoscopy, elastography, tactile imaging, thermography, medical photography and nuclear medicine functional imaging techniques as positron emission tomography (PET) and Single-photon emission computed tomography (SPECT).
IJEDR1804101
International Journal of Engineering Development and Research (
www.ijedr.org
)
566
the measurement locations. In a limited comparison these technologies can be considered as forms of medical imaging in another discipline.Medical imaging modalities include:•
Computed Tomography (CT)Computed Tomography (CT), also commonly referred to as a CAT scan, is a medical imaging method that combines multiple X-ray projections taken from different angles to produce detailed cross-sectional images of areas inside the body. CT images allow doctors to get very precise, 3-D views of certain parts of the body, such as soft tissues, the pelvis, blood vessels, the lungs, the brain, the heart, abdomen and bones. CT is also often the preferred method of diagnosing many cancers, such as liver, lung and pancreatic cancers.
• Magnetic Resonance Imaging (MRI)
Magnetic Resonance Imaging (MRI) is a medical imaging technology that uses radio waves and a magnetic field to create detailed images of organs and tissues. MRI has proven to be highly effective in diagnosing a number of conditions by showing the difference between normal and diseased soft tissues of the body.
• Positron Emission Tomography (PET)
Positron Emission Tomography (PET) is a nuclear imaging technique that provides physicians with information about how tissues and organs are functioning. PET, often used in combination with CT imaging, uses a scanner and a small amount of radiopharmaceuticals which is injected into a patients vein to assist in making detailed, computerized pictures of areas inside the body.
•
PET-CTFor added precision, physicians use a medical imaging technique that combines PET and CT. This allows images acquired from both devices to be taken sequentially and combined into a single superposed image. PET-CT serves as a prime tool in the delineation of tumor volumes, staging and the preparation of patient treatment plans. The combination has been shown to improve oncologic care by positively impacting active treatment decisions, disease recurrence monitoring and patient outcomes, such as disease-free progression.
•
ULTRASOUNDDiagnostic ultrasound, also known as medical sonography or ultrasonography, uses high frequency sound waves to create images of the inside of the body. The ultrasound machine sends sound waves into the body and is able to convert the returning sound echoes into a picture. Ultrasound technology can also produce audible sounds of blood flow, allowing medical professionals to use both sounds and visuals to assess a patient’s health
•
X-RAYX-ray technology is the oldest and most commonly used form of medical imaging. X-rays use ionizing radiation to produce images of a person’s internal structure by sending X-ray beams through the body, which are absorbed in different amounts depending on the density of the material. In addition, included as x-ray type devices are also mammography, interventional radiology, computed radiography, digital radiography and computed tomography (CT). Radiation Therapy is a type of device which also utilizes either x-rays, gamma rays, electron beams or protons to treat cancer.
1.3 Image Fusion
Image processing is the analysis and manipulation of a digitized image, in order to improve its quality [1]. Image Fusion can be defined as the process of combining multiple input images into a single fused image without the introduction of the distortion or the loss of the information.Multi sensor data fusion has become a discipline which demands more general formal solutions to a number of application cases. Several situations in image processing require both high spatial and high spectral information in a single image. This is important in remote sensing. However, the instruments are not capable of providing such information either by design or because of observational constraints. One possible solution for this is data fusion.The images used in image fusion should already be registered. Misregistration is a major source of error in image fusion.
Image fusion has become a common term used within medical diagnostics and treatment.[6] The term is used when multiple images of a patient are registered and overlaid or merged to provide additional information. Fused images may be created from multiple images from the same imaging modality,[7] or by combining information from multiple modalities,[8] such as magnetic resonance image (MRI), computed tomography (CT), positron emission tomography (PET), and single photon emission computed tomography (SPECT). In radiology and radiation oncology, these images serve different purposes. For example, CT images are used more often to ascertain differences in tissue density while MRI images are typically used to diagnose brain tumors.
2. Related Works.
This reviews previous published works on basic image fusion techniques. It also contains a study of the quality measurements that can be defined for gray scale images.In the field of remote sensing, medical imaging, computer vision, robotics and machine vision the multi-sensor data may have multiple images of the same scene providing different information. It is not possible to have a single image that contains all the information of objects in the image, so image fusion is required. There are two image fusion methods:
1.
Spatial Domain Fusion Method2.
Transform Domain Fusion MethodIJEDR1804101
International Journal of Engineering Development and Research (
www.ijedr.org
)
567
fusion requires the extraction of special features which are depending on their environment such as pixel intensities, edges or textures. These similar features from the input images are fused. Decision level fusion is higher level of fusion. Input images are processed individually for information extraction[10]. Generally these algorithms can be categorized into spatial domain fusion and transform domain fusion. The DCT, DWT are transforming techniques. Basic image fusion techniques like simple minimum, simple maximum and simple average, PCA uses spatial domain techniques.2.2 IMAGE FUSION TECHNIQUES
Principle Component Analysis (PCA)
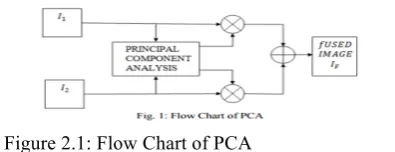
Figure 2.1: Flow Chart of PCA
PCA is subspace method which reduces the multi dimensions data sets in to lower dimensions for analysis. Basically it is a technique in which numbers of correlated variables are transformed into number of uncorrelated variables called principle component.
Transform Domain Fusion Method Discrete Wavelet Transforms
This transform are multi resolution image decomposition tool that provide variety of channels representing the image feature by different frequency sub bands at multi-scale.
Its analyse signals that divides in horizontal and vertical lines.
Figure 2.2: Flow Chart of DWT
•
Guided Image FilteringKaiming He, Member, IEEE, Jian Sun, Member, IEEE, and Xiaoou Tang, Fellow,IEEE
Novel explicit image filter called guided filter. Derived from a local linear model, the guided filter computes the filtering output by considering the content of a guidance image, which can be the input image itself or another different image. The guided filter can be used as an edge-preserving smoothing operator like the popular bilateral filter [1], but it has better behaviors near edges. The guided filter is also a more generic concept beyond smoothing: It can transfer the structures of the guidance image to the filtering output, enabling new filtering applications like dehazing and guided feathering. Moreover, the guided filter naturally has a fast and nonapproximate linear time algorithm, regardless of the kernel size and the intensity range. Currently, it is one of the fastest edge-preserving filters. Experiments show that the guided filter is both effective and efficient in a great variety of computer vision and computer graphics applications, including edgeaware smoothing, detail enhancement, HDR compression, image matting/feathering, dehazing, joint upsampling, etc
•
A Versatile Edge Preserving Image Enhancement Approach For Medical Images Using Guided FilterRahul Rajendran Department of Electrical and Computer Engineering The University of Texas at San Antonio One UTSA Circle, San Antonio, TX-78249 [email protected]
This technique draws out different organs and tissues by using strong magnetic fields and non-ionizing radiations. In multi-slice MRI, a 3D model of a desired section can be constructed using multiple 2D multi-slices. However, a tradeoff exists between the resolution of the images and the time needed for acquisition as well as noise reductionintroduced a new enhancement method to enhance low resolution medical images. The method comprised the use of guided filtering, edge enhancement, contrast stretching, and image fusion to improve the image quality. The method was able to accurately enhance the images and provide us with a desired output. The obtained simulation results demonstrate the superiority of the proposed enhancement method over the method [1]. As a part of future work, the algorithm can be improved in two ways. Firstly, the enhancement method should focus on enhancing specific areas, such as kidney, liver, heart, etc., and secondly, the enhancement method should help distinguish malignant regions from benign
region.
•
Bilinear Interpolation over fuzzified images:PetrHurtik Institute for Research and Applications of Fuzzy Modeling University of Ostrava, Czech Republic [email protected]
The paper explores Bilinear Interpolation applied to image enlargement after a fuzzification pre-processing. On the one hand, and from a theoretical point of view, we show some interesting relationships between Bilinear Interpolation and the Fuzzification. On the other hand, from an applied point of view we apply the interpolation obtained to enlargement and show that the obtained results are firstly, faster and secondly, comparablewith the standard interpolation procedures.We have extended Bilinear Interpolation with a fuzzification processing and we have shown that the relationship between the results obtained by considering the fuzzification procedure like a preprocessing or like a post-processing.
IJEDR1804101
International Journal of Engineering Development and Research (
www.ijedr.org
)
568
G.UmaVetriSelvi, R.Nadarajan new lossyimagecompression algorithm for DI-COM ( Digital Imaging and Communications in Medicine) images using Bilinearinterpolation. This method presents a technique for classification of the image blocks on the basis of threshold value of variance.The proposed method does not increase heavy computational complexity in achieving a higher compression ratio. Therefore, it is an efficient information processing technique in the field of Medical signal processing.
•
A Review on Different Image Interpolation Techniques for Image EnhancementVaishali Patel1, Prof.Kinjal Mistree2 1Student of M.Tech Computer Engineering in ChhotubhaiGopalbhai Patel Institute of Technology, Bardoli 2Assistant Professor, Department of Computer Engineering, ChhotubhaiGopalbhai Patel Institute of Technology, Bardoli
Image enhancement is an important processing task in image processing field. By applying image enhancement, blur or any type of noise in the image can be removed so that the resultant image quality is better. Image enhancement is used in various fields like medical diagnosis, remote sensing, agriculture, geology, oceanography. There are numbers of techniques for image enhancement. Image interpolation is used to do enhancement of any image. This paper gives overview about different interpolation techniques like nearest neighbor, bilinear, bicubic, new edge-directed interpolation (NEDI), data dependent triangulation (DDT), and iterative curvature-based interpolation (ICBI).we have study different image interpolation techniques like non-adaptive and adaptive techniques.
We also study that adaptive techniques are better in terms of visual appearance of image but it take more computational time. When time is not an obstacle then we choose the adaptive technique otherwise non-adaptive techniques are preferable. Based on our application we used either of these interpolation techniques.
In future, we will try to combine these adaptive and non-adaptive techniques to overcome their individuals disadvantages and make the resulting image better in terms of visual appearance and in terms of computational time.
•
Multimodal Sensor Medical Image Fusion Based on Type-2 Fuzzy Logic in NSCTDomain Yong Yang, Member, IEEE, YueQue, Shuying Huang, Member, IEEE, and Pan LinMultimodal medical image fusion plays a vital role in different clinical imaging sensor applications. This paper presents a novel multimodal medical image fusion method that adopts a multiscale geometric analysis of the nonsubsampledcontourlet transform (NSCT) with type-2 fuzzy logic techniques. First, the NSCT was performed on preregistered source images to obtain their highand low-frequency subbands. Next, an effective type-2 fuzzy logic-based fused rule is proposed for fusion of the high-frequency subbands. In the presented fusion approach, the local type-2 fuzzy entropy is introduced to automatically select high-frequency coefficients.Novel multimodal sensor medical image fusion method based on type-2 fuzzy logic in NSCT domain is proposed. To overcome the limitations of the traditional fusion methods, a new couple of fusion rules based on type-2 fuzzy logic and LE are used to preserve more useful information and improve the quality of the fused images.
3. Methods
The proposed system combines the box filtering and guided filtering with bilinear interpolation. It is aimed to produce an enhanced image fusion technique using box filtered images using guided filtering.
Guided filter is used to make full strong correlation between the neighbourhood pixels. The result shows that the proposed method can well preserve the original and the complementary information of the input images[2]. The benefit of the proposed method is that it removes noise without altering the underlying structures of the image.
Guided filtering method is also known as edge preserving filtering. While using other kinds of filters the edges of output image looks blurred which will affect the quality.A major drawback of guided filtering based image fusion is that it may oversmooth the resulting weights, which is not good for image fusion. To solve the problem mentioned above, an image fusion method with box filtering is proposed here. The proposed method is very robust to image registration and is
computationally efficient, making it quite qualified for real applications.Experimental results shows that the when PSNR value is calculated, the noise ratio is found to be very low for the resultant fused image. The project also compares image fusion techniques like guided filtering with box filter and multi focus method.
Flow chart for box filtering with guided filter
IJEDR1804101
International Journal of Engineering Development and Research (
www.ijedr.org
)
569
3.2 EVALUATION PARAMETERS OF METHODS
The general requirements of an image fusing process are that it should preserve all valid and useful pattern information from the source images, while at the same time it should not introduce artifacts that could interfere with subsequent
analyses[23]. The performance measures used in this project provide some quantitative comparison among different fusion schemes, mainly aiming at measuring the definition of an image.
1. PEAK SIGNAL TO NOISE RATIO (PSNR) PSNR is the ratio between themaximum possible power of a signal and the power of corrupting noise that affects the fidelity of its representation. The PSNR measure is given by:-
R is the maximum fluctuation in the input image data type. For example, if the input image has a double precision floating-point data type, then R is 1. If it has an 8-bit unsigned integer data type, R is 255, etc.
2. MEAN SQUARED ERROR (MSE) The mathematical equation of MSE is given by the equation.
Where, I1- the perfect image,I2 - the fused image to be assessed, i- pixel row index, j- pixel column index, m, n- No. of row and column.
3.3. SYSTEM MODELING
MOST applications in computer vision and computer graphics involve image filtering to suppress and/or extract content in images. Simple linear translation-invariant (LTI) filters with explicit kernels, such as the mean, Gaussian, Laplacian, and Sobel filters, have been widely used in image restoration, blurring/sharpening, edge detection, feature extraction, etc.
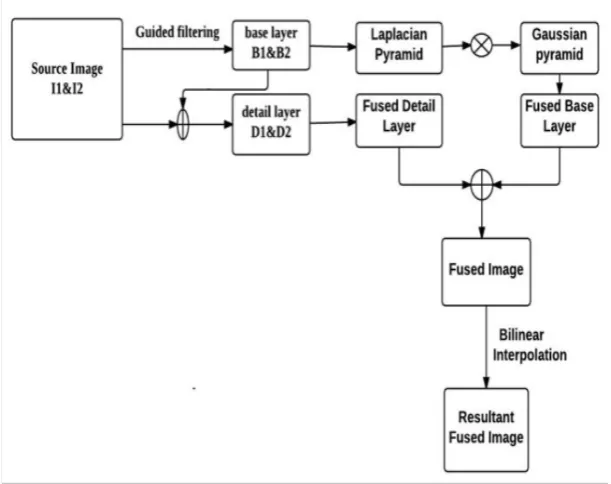
Figure 3. 4: Block Diagram for guided filter 3.3.1 IMPLEMENTATION STEPS
step 1. Start
step 2. Read image 1, image 2which are grey scale, square and of same size. step 3. Call box filter for boththe images image 1 and image 2
step 4. Set guide image1, input=image2 step 5. Call guided filter
step 6. Use bilinear interpolation to get the final fused image. step 7. Calculate PSNR step 8. Display fused image
IJEDR1804101
International Journal of Engineering Development and Research (
www.ijedr.org
)
570
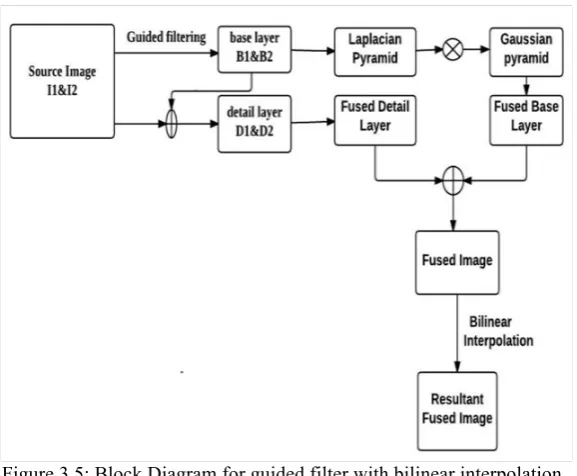
Figure 3.5: Block Diagram for guided filter with bilinear interpolation3.3.1.1 IMPLEMENTATION STEP FOR GUIDED FILTER
Let input and guide be the images to be fused. win size is used to find the number of pixels. Its the square of win size. epsilon is used in the calculation of linear coefficients
1.
Decomposition of image into two-scale.2.
Construction of weight map using laplacian and gaussian pyramid.3.
Reconstruction of two-scale imageProcedure guided filter(input, guide, epsilon, winsize)
1.
Find average value in every win size-by-win size window of the input image.2.
Find average value in every win size-by-win size window of the guide image.3.
Calculate variance in every window of the guide image.4.
Compute cross term of the guide and input image in every window.5.
Construct denominator image.6.
Calculate sum over each window by shifting and adding.7.
Calculate average, variance and cross terms.8.
Calculate average a ,mua = mua ./ denom; and b, mub = mub ./ denom;9.
filtered image, filtered = mua .* input + mub;10.
End procedure3.3.1.2 STEPS FOR BOX FILTER functionimDst := boxfilter(imSrc,r)
1.
// box filtering using cumulative sum2.
// - Definition imDst(x, y):=sum(sum(imSrc(x-r:x+r,y-r:y+r)));3.
// - Running time independent of r;4.
// - Equivalent to the function: colfilt(imSrc, [2*r+1, 2*r+1], ’sliding’, @sum);5.
// - But much faster.6.
[hei, wid] := size(imSrc);7.
imDst := zeros(size(imSrc));8.
//cumulative sum over Y axis9.
imCum := cumsum(imSrc, 1); end function 10. //difference over Y axis11.
imDst(1:r+1, :) := imCum(1+r:2*r+1, :);12.
imDst(r+2:hei-r, :) := imCum(2*r+2:hei, :) - imCum (1:hei-2*r-1, :);13.
imDst(hei-r+1:hei, :) := repmat(imCum(hei :), [r, 1]) - imCum(hei-2*r:hei);14.
//cumulative sum over X axis3.4. QUANTITATIVE COMPARISONS
3.4.1 PERFORMANCE EVALUATION OF FUSION
IJEDR1804101
International Journal of Engineering Development and Research (
www.ijedr.org
)
571
truthfulassessment of the fusion product some quantitative measures (indicator) isrequired. Two different measures are used in this project to evaluate the results of fusion process. They are Information Entropy andRoot Mean Square ErrorEntropy
One of the quantitative measures in digital image processing is Entropy.Claude Shannon introduced the entropy concept in quantification of informationcontent of messages. Although he used entropy in communication, it can be alsoemployed as a measure and quantify the information content of digital images. Adigital image consists of pixels arranged in rows and columns. Each pixel isdefined by its position and by its grey scale level. For an image consists of L greylevels, the entropy is defined as:
where is the probability (here frequency) of each grey scale level. As an example adigital image of type uint8 (unsigned integer 8) has 256 different levels from 0(black) to 255(white).
It must be noticed that in combined images the number of levels is very large and grey level intensity of each pixel is a decimal, doublenumber. But the equation is still valid to compute the entropy. For images withhigh information content the entropy is large. The larger alternations and changesin an image give larger entropy and the sharp and focused images have morechanges than blurred and misfocused images. Hence, the entropy is a measure toassess the quality of different aligned images from the same scene.
Root Mean Square
The Root Mean Square Error between the reference image,I and the fusedimageisdefined as: F
for applications where their meaning is clearer. reflects such an application: fusion of two images of differing focus to produce animage of maximum focus. Firstly, a ground truth image needs to be created thatcan be quantitatively compared to the fusion result images. This is produced usinga simple cut-and-paste technique, physically taking the in focus areas from eachimage and combining them. The quantitative measure used to compare the cut-and-paste image to each fused image wastaken from where andi j denotes the spatial position of pixels,M and are the dimensions of the images.N This measure is appropriate for a pair of images containing twoobjects. First a reference, everywhere-infocusimageI is taken. Then two imagesare provided from this original image. In one image the first object is focused andthe second one is blurred. In the other image the first object is blurred and another one is remained focused. Often the perceptual quality of the resulting fused image is of primeimportance. In these circumstances, comparisons of quantitative quality can oftenbe misleading or meaningless. However, a few authors have attempted togenerate such measures.
Experimental Results
The CT and MRI Images are of size 256 by 256 pixels with different content. Note that, many Note that, many registration methods have been proposed in literatures. Therefore, our study in this paper just focuses on the image fusion and Denoising.First the two sets of source images are denoised with box filters to sharpen, emboss, edge-detect, motion-blur then guided filter algorithm is used to fuse the filtered images.Guided filter is used for smoothening and also used for edge preserving.The fused image is again denoised by bilinear interpolation.
IJEDR1804101
International Journal of Engineering Development and Research (
www.ijedr.org
)
572
Box filtering is applied to the single CT image .Box filtering is a method to obtain a high quality image from a number of low quality images using image fusion. Smoothing an image by equally weighting a rectangular neighbourhood of pixels is called using abox filter.The resultant box filtered images are fused with guided filter. Guided filter is used to decompose the source images into base layer and detail layer. A weight map of the base layer is computed by applying Gaussian and laplacian pyramidal approach. A fused base layer and detail layer are computed from the weight map of the base layer and decomposed source image output obtained detail layer respectively. The fused base layer and fused detail layer are combined to obtain the fused image and bilinear interpolation is applied to get the resultant fused image.
PERFORMANCE EVALUATION
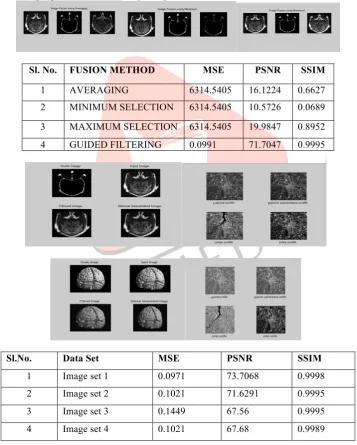
There are many medical image fusion methods including: pixel-based image fusion method, Averaging, Laplacian, Discrete wavelet transform, etc. Figure 4.6 shows the result of image fusion using Averaging method, Figure 4.7 shows the result of image fusion using Minimum method, Figure 4.8 shows the result of image fusion using Averaging method.
Table 4.1 shows the analysis of different fusion techniques such as Averaging, Selection using Minimum, Selection using Maximum and guided filtering on the CT and MRI dataset. The evaluation parameters used are PSNR, MSE and SSIM. As the results shows other filters failed to preserve the edges of the input images. Guided filter have the highest PSNR and SSIM compared to other filters. Hence guided filtering method protects the edges and produced a fused image of fine quality. Guided filtering on box filtered images performs well on images. It preserves most of the useful information in source images.
Sl. No. FUSION METHOD MSE PSNR SSIM
1 AVERAGING 6314.5405 16.1224 0.6627
2 MINIMUM SELECTION 6314.5405 10.5726 0.0689 3 MAXIMUM SELECTION 6314.5405 19.9847 0.8952 4 GUIDED FILTERING 0.0991 71.7047 0.9995
Sl.No. Data Set MSE PSNR SSIM
1 Image set 1 0.0971 73.7068 0.9998
2 Image set 2 0.1021 71.6291 0.9995
3 Image set 3 0.1449 67.56 0.9995
4 Image set 4 0.1021 67.68 0.9989
Conclusion
IJEDR1804101
International Journal of Engineering Development and Research (
www.ijedr.org
)
573
fusion application.A novel and effective guided filter and bilinear interpolation for multimodal medical image fusion and denoising has been presented.The bilinear interpolation is integrated into the multimodal medical image fusion It can effectively extract the main characteristics from noisy input medical images, preventing noise interference.Encouragingly, the proposed method can greatly suppress noise while well preserving the complementary information and main features of noisy input medical images. Future research will be done for the adaptability of the parameters.Imagedenoising is an important task in many medical imaging applications. There have been many developed algorithms such as gaussian kernel based filtering, anisotropic diffusion, bilaterial filtering, non local means filtering, and total variation based denoising. At present, images with two dimensions or grayscale images are considered for filtering techniques. Integration is done by well known image fusion algorithm, guided filtering. Before subjected to integration each source is individually applied box filtering and after integration enhancement is made by removing the noise by means of bilinear interpolation.
The work can be extended I future by adding more dimension or by using color images. Now images in dataset are of limited size and it can be further extended to large size images as well as videos. Instead of images, videos can be integrated to get a good quality one. In the computer vision community, the guided image filtering (GF) has been introduced, which demonstrated powerful denoising performance and fast computation time. GF was also extended to Iterative GF to improve the filter output quality (e.g. rolling guidance filtering or RGF). Recently, GF was applied to PET denoising problem in simultaneous PETMR with matched spatial resolution of MR.
References
[1] SusmithaVekkot, and PanchamShuklaA Novel Architecture for Wavelet basedImage Fusion. World Academy of Science, Engineering and Technology 57 2009.
[2] StavriNikolov Paul Hill David Bull NishanCanagarajah WAVELETS FOR IMAGE FUSION.
[3] Anjali Malviya, S. G. Bhirud . Image Fusion of Digital Images InternationalJournal of Recent Trends in Engineering, Vol 2, No. 3, November 2009.
[4] Y. Yang, Y. Que, S. Huang, and P. Lin, Multimodal sensor medical image fusionbased on type-2 fuzzy logic in NSCT domain, IEEE Sensors J., vol. 16, no. 10, pp. 37353745, May 2016.
[5] Y. Zhang, Z. Xie, Z. Hu, S. Zhao, and H. Bai, Online surface temperature measurement of billets in secondary cooling zone end-piece based on data fusion, IEEE Trans. Instrum. Meas., vol. 63, no. 3, pp. 612619, Mar. 2014.
[6] L. Gondara. (2016). Medical image denoising using convolutional denoisingautoencoders. [Online]. Available: https://arxiv.org/abs/1608.04667.
[7] S. P. R. Rahul Rajendran, Sos S Agaian, Michael Liss ”A Novel Technique toEnhance Low Resolution Magnetic Resonance Images in Cloud+, ” presented at the The IEEE International Conference on Smart Cloud 2016 (SmartCloud 2016) - Paper under review.
[8] I. Bankman, Handbook of medical image processing and analysis: academicpress, 2008.
[9] L. Parthiban and R. Subramanian, ”Speckle noise removal using contourlets,” in2006 International Conference on Information and Automation, 2006, pp.250-253.
[10]Franklin C. Crow, Summed-area tables for texture mapping, in Proceedings of SIGGRAPH, 1984, vol. 18, pp. 207212. [11]Paul Viola and Michael J. Jones, Robust real-time face detection, InternationalJournal of Computer Vision, vol. 57, no.
2, pp. 137154, 2004.
[12]Qiang Zhu, ShaiAvidan, Mei-Chen Yeh, and Kwang-Ting Cheng, Fast human detection using a cascade of histograms of oriented gradients, in Proceedings of the IEEE Computer SocietyConference on Computer Vision and Pattern Recognition, CVPR06, 2009.
[13]Peter Kovesi, Arbitrary Gaussian filtering with 25 additions and 5 multiplications per pixel, Tech. Rep. UWA-CSSE-09-002, The University of Western Australia, September 2009.
[14]K.-T. Chang, Introduction to geographic information systems. McGraw-Hill, 2008. [15]R. Keys, Cubic convolution interpolation for digital image processing,IEEE
[16]Transactions on Acoustics, Speech and Signal Processing, vol. 29,no. 6, pp. 11531160, Dec 1981.
[17]N. Madrid and P. Hurtik, Lane departure warning for mobile devicesbased on afuzzy representation of images, Fuzzy Sets and Systems,vol. (submitted), 2015.
[18]X. Hou and L. Zhang, Saliency detection: A spectral residual approach,inIEEEConference on Computer Vision and Pattern Recognition.CVPR 07., June 2007, pp. 18.
[19]B. Ramakrishnan and N. Sriraam, ”Internet transmission of DICOM imageswith effective low bandwidth utilization,” Digital Signal Process, vol. 16,no.6, pp. 825831, Nov 2006.
[20]Shih-Gu Huang, Wavelet for Image Fusion
[21]YufengZheng, Edward A. Essock and Bruce C. Hansen, An Advanced ImageFusion Algorithm Based on Wavelet Transform Incorporation with PCA and Morpho- logical Processing.
[22]StavriNikolov Paul Hill David Bull NishanCanagarajah WAVELETS FOR IMAGE FUSION
[23]V.P.S. Naidu and J.R. Raol, Pixel-level Image Fusion using Wavelets and Principal Component Analysis. Defence Science Journal, Vol. 58, No. 3, May 2008, pp. 338-352 2008, DESIDOC
[24]Y. Zhang, Z. Xie, Z. Hu, S. Zhao, and H. Bai, Online surface temperaturemeasurement of billets in secondary cooling zone end-piece based on data fusion, IEEE Trans. Instrum. Meas., vol. 63, no. 3, pp. 612619, Mar. 2014.
IJEDR1804101
International Journal of Engineering Development and Research (
www.ijedr.org
)
574
[26]P. Perona and J. Malik, Scale-space and edge detection using anisotropic diffusion, IEEE Transactions on PatternAnalysis and Machine Intelligence, vol. 12, no. 7, pp. 629639, Jul. 1990.
[27]C. Tomasi and R. Manduchi, Bilateral filtering for gray and color images, inIEEE 6th International Conference on Computer Vision.Bombay: Narosa Publishing House, 1998, pp. 839846.
[28]A. Buades, B. Coll, and J. M. Morel, A review of image denoisingalgorithms,with a new one, Multiscale Modeling Simulation, vol. 4,no. 2, pp. 490530, Jan. 2005.
[29]L. I. Rudin, S. Osher, and E. Fatemi, Nonlinear total variation based noiseremoval algorithms, Physica D Nonlinear Phenomena, vol. 60, no. 1-4, pp. 259268, 1992.
[30]K. He, J. Sun, and X. Tang, Guided Image Filtering, in ECCV, Lecture Notes inComputer Science, 2010, pp. 114. [31]W. P. Segars, G. Sturgeon, S. Mendonca, J. Grimes, and B. M. W. Tsui, 4DXCAT phantom for multimodality imaging