EEG-based Mind Driven Type Writer by Fuzzy
Radial Basis Function Neural Classifier
Snehalika Lall1, Anuradha Saha1, Amit Konar1, Mousumi Laha1, Anca L. Ralescu2, Atulya K. Nagar3 Jadavpur University1, Electronics & Telecommunication Engineering Department1
Kolkata-700032, India1
Department of Computer Science2, University of Cincinnati2 Department of Math and Computer Science Liverpool Hope University
Liverpool, UK3
[email protected], [email protected]1, [email protected]1, [email protected]1, [email protected]2 [email protected]
Abstract—EEG based vowel classification is currently gaining importance for its increasing applications in the next generation mind-driven type-writing. This paper addresses a novel approach to classify the mentally uttered alphabets in a specific three lettered format, where the first and the last letter represent two vowel sounds and the middle is a space, where no character is imagined. Such formatting helps recognizing 26 alphabets in English language using seven vowel sounds only. To eliminate the possible infiltration of noise by parallel thoughts we used a specialized neuro-fuzzy classifier, where the first layer of the classifiers realized with fuzzy logic eliminates the possible creeping of noise due to side active channel interference. Two models of fuzzy pre-processing are used. The first one is realized with type-1 fuzzy logic, whereas the second model is realized with interval type-2 fuzzy sets. The latter model can take care of both intra- and inter-personal level uncertainty in measurements. Experiments undertaken reveal that the proposed type-2 fuzzy classifier outperforms both type-1 and traditional neural classifiers by a significant margin.
Keywords— Vowel Classification, EEG, Fuzzy based Radial Basis Function, Perceptron Neuron Network, Principal Component Analysis.
I. INTRODUCTION
Mind-driven type-writing (MD-TW) is one of the cutting edge technological innovations of modern Brain-Computer Interfacing (BCI) [1]. There are so many research work based on real time EEG-based human emotion recognition [2], [3] and EEG based stress monitoring is described in paper [4]. In paper [5], one channel of ICA data is taken as input which increases classification accuracy to 87%. Although commercial product level design of MD-TW is still far from reality, the innovations of MD-TW at research level cannot be denied. Previously, there exists various works on EEG based vowel/word classification. However, our proposed techniques and classifiers that have been used in this paper are new. In a recent work by DaSalla [6], classification of imagery speech vowel ‘a’ and ‘u’ has been done using EEG signals, where common spatial pattern (CSP) is used to extract necessary EEG features.
In addition, nonlinear support vector machine (SVM) is used for decoding the vowels, which gives an accuracy of 56-82%.
In another work by Iqbal et al. [7], EEG has been recorded to decode vowels ‘a’ and ‘u’, where variance, mean and normalized energy are considered as important features. Classification has been done using linear, quadratic and nonlinear SVM, where non linear SVM classifier outperforms with classification accuracy of 77.5-100 %. Besides the above two researches, some other works have done byKamalakkannan et al. [8], Riaz et al. [9] and Kim et al. [10]need special mention. In [8] EEG features including variance, mean and standard deviation are extracted for five imagery vowels ‘a’, ‘e’, ‘i’, ‘o’, ‘u’, after which bipolar neural network is used for classification. In [9], a large pool of EEG features is extracted using a variety of feature-extraction techniques using Mel Frequency Cepstral Coefficients (MFCCs) and log variance Auto Regressive (AR) coefficients. Classifier performance is compared between three standard classifiers: i) SVM, ii) Hidden Markov Model (HMM) and iii) k-nearest neighbor (k-NN). Experimental result reveals that their HMM attains the reasonably highest classification accuracy. In [10], multivariate empirical mode decomposition (MEMD) and common spatial pattern are used as feature extractor, whereas linear discriminant analysis (LDA) classifier is used to decode three vowels: ‘a’, ‘i’, ‘u’. Lastly, in
the scalp. It is observed that EEG signals acquired during MD-TW of a normal and healthy subject have significant difference in features, and thus are easily separable. The above principle works well for individual vowel sounds. To include consonants in print, we developed a data dictionary for each consonant represented by two vowel sounds in just-apposition. For example, A_A denotes one consonant, that includes two A and one space (blank) between the two uttering of A. We have presuming seven vowel sounds (A, AA, Aea, EE, UU, Ae, O). However, by combining two vowel sounds we can have as many as 7C
2 =21 consonants. Thus we can cover
26 characters as consonant. The ultimate aim of the paper is to design and develop a stand-alone mind driven type writer. The EEG signals acquired in 0.5 to 70 Hz would be used to classify an alphabet from a mental imagery of two vowel sounds separated by a space (no thought for vowels) to determine the intension about the desired alphabet. The proposed system should be smart enough to complete the classification of individual vowel sounds within an expected duration of 10 ms, so that the user does not have any trouble to complete the imagination task of a character within 30 ms, considering three time slots for a character, as introduced before.
The classifier to be designed should be able to classify seven classes (A, AA, Aea, EE, UU, Ae, O) based on input EEG features. The number of classes being fewer, apparently we can use any standard supervised learning classifier to serve the purpose. Experiments undertaken across different experimental instances on a subject and across different subjects, however, reveal that the feature variance within a class even for the same subject is high (on an average 20-30% of the feature mean). This calls for one level of normalization of features, which in this paper has been performed using a fuzzy mapping of individual feature into a membership value in [0, 1]. Such non-linear mapping helps eliminating the effect of intra-subjective variations in features. Next we feed the normalized features to the input of a 2-layered Radial Basis Function (RBF) neural net, where the RBF neurons are tuned to the mean feature vector of individual class. Naturally, when a feature vector matches with the tuned mean vector of a class, the RBF neuron triggers with an output close to one. Thus the right RBF neuron describing a particular class can be identified. The last layer in the RBF neural net is designed with perceptron neurons. This layer is used to produce a binary encoded class for different mental imageries. The encoding is required to keep a few (three) neurons at the output layer.
Experiments have been undertaken to examine the performance of the proposed classifier with standard back-propagation classifier, recurrent neural classifiers and hierarchical support vector machine classifier. Experimental results envisage that the RBF based classification outperforms traditional classifiers by mean classification accuracy.
The paper is divided into six sections. Section II introduces the overall system integration. In Section III, we present the details on classifier design. Experimental details are introduced in Section IV. Performance analysis is undertaken in section V. Conclusions are listed in Section VI.
II. SYSTEM OVERVIEW
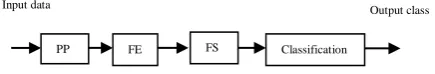
This section introduces an overview of vowel classification technique using EEG signal analysis. The block diagram of the overall system is given in Fig. 1. EEG signals are recorded from the electrodes placed on the scalp of human subjects, when they are asked to observe a set of visual stimulus, each containing one specific vowel sound. As the stimulus appears on the computer screen, subjects are advised to imagine to utter the vowel sounds.
Fig. 1. EEG based vowel classification analysis: PP is Pre-Processing, FE is Feature Extraction, DPS is Data Point Selection, FS is Feature
Selection
First, the acquired EEG signals are pre-processed (PP)/filtered to remove eye-blinking artifacts and other line noise. Next, the pre-processed signal is used to extract its independent features by using Feature extraction (FE) technique [12]. In this paper, we use Approximate Entropy (ApEn) [13] and Power Spectral Density (PSD) [14]as important features. Since, all extracted features do not contain important information; we apply Principal Component Analysis (PCA) [1] to select most significant features as well as to remove the unwanted features. Lastly, selected EEG features are applied to classify vowel sounds using two proposed methods: i) type 1 fuzzy radial basis function (RBF)[16] induced perceptron neural network (PNN)[17] and ii) type 2 fuzzy radial basis function (RBF) induced perceptron neural network (PNN).
III. CLASSIFIER DESIGN
This section introduces the architecture of two proposed neuro-fuzzy classifiers.
A. Model I
The first classifier, called Type-1 fuzzy-RBF classifier includes three layers. The first layer includes type-1 fuzzy membership functions (MFs) to process n dimensional features into n membership values in [0, 1]. We here used Gaussian type MFs, where the mean and the variance of the Gaussian MFs are obtained from the feature mean and variance for a given set of training samples for a given class. The second layer is an RBF layer, where the RBF neurons produce an output close to one, when the input feature vector for an unknown class component-wise matches with the mean vector of an RBF neuron. The response of the i-th RBF neuron is given by equation 1:
yiexp
XiXi
2 (1)It is apparent from the RBF response that if Xi
approaches toXi, then yiapproaches 1. On the other hand,
when the difference between the above vectors is component-wise large, yi is small. Thus only one RBF
neuron, whose mean vector matches sufficiently close to the input vector only triggers to produce an output equal to 1.
Output class
The third layer in the classifier includes 7 perceptron neurons with step type non-linearity. It produces encoded binary classes at the output of this layer. For instance, if the class is 6, it produces the binary code of 6 at the output. The schematic diagram of model I is given in Fig 3.
B. Model II
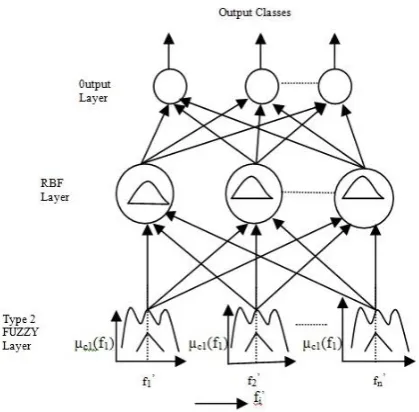
The second model also includes three layers, where the first layer comprises interval type-2 fuzzy MFs (IT2FMFs) [18]. The second and the third layer are similar with that of Model I. The IT2FMFs layer in Model 2 helps in reducing both intra- and inter-personal level uncertainty, whereas the type-1 MF in Model-I takes care of intra-personal level uncertainty only. Construction of IT2MF largely depends on individual type-1 MFs obtained from individual subjects. In fact, the footprint of uncertainty is obtained by taking union of all the type-1
MFS. Let 1A
fi , 2A
fi , … nA ,
fi be the type-1 MFs obtained from n subjects for featurei
, where the fuzzy set A represents CLOSE_TO the middle of the parametric range of variable fi. The interval type-2 fuzzy set is defined by upper membership function (UMF) with equation 2 and lower membership function (LMF) with equation 3, wherei maxi
1
i , 2
i ,..., n
i
,A A A
UMF f f f (2)
LMFi mini
1A
fi ,2A
fi ,...,nA
fi
. (3)Thus for m features, we have IT2FS with UMFi and
i
LMF for i=1 to m.
Now given an unknown measurement of the features:
' ' '
1, 2,..., m
f f f . We obtain the average degree of
membership for the measured feature f'j as (UMFi+
i
LMF )/2. This average degree of membership is transferred to the input of all RBF neurons in the next layer. The schematic diagram of the proposed neuro-fuzzy classifier of model I and Model II are given in Fig. 2 and Fig. 3.
Fig. 2. Schematic diagram of three layered neuro-fuzzy classifier using model I
Fig. 3. Schematic diagram of three layered neuro-fuzzy classifier using model II
IV. EXPERIMENTS AND RESULTS
This section includes two following experiments: i) selection of brain regions, ii) selection of EEG features.
A. Experimental framework
This section includes three following experiments: i) selection of brain regions, ii) selection of EEG features and iii) classifier performance.
The experiment has been performed at Artificial Intelligence Lab, Jadavpur University, where the framework includes a 21-channel stand-alone EEG device having a sampling rate of 200 Hz and resolution of 100µ (Fig. 4). Twelve volunteers with 10 healthy and normal and 2 patients suffering from ear-loss have participated in our said experiments. Of the 10 healthy normal subjects, we selected 6 men and 4 women in the age group 22-35 years. The two subjects with partial ear-loss are both men. They are advised to sit on a comfortable chair with armrest and restrict their movement to eliminate movement-related artifacts. Subjects are shown visual stimuli containing instruction to try to pronounce the specific vowel at a time.
B. Experiment 1: Selection of Brain Regions
EEG signals are captured from 21 electrode positions and are recorded on a separate computer having 8 GB RAM with CPU clock of 3.4 GHz. Fig. 5 shows the scalp maps of the two randomly selected subjects (here, S4 and
S6), as have been recorded during the experiment. It can
be observed from the figure that pre-frontal, motor cortex, parietal and occipital lobes exhibit significant activations during the experiment. Here, occipital lobe is found active because of the visual signal processing, whereas slight activation in the pre-frontal region is associative with eye-blinking. Besides these, parietal and motor cortex regions are found to take significantly active participation during the experiment. Additionally, literature [1-6] reveals that temporal lobe is highly associated with human speech signal processing. Therefore, we select P3, P4 and Pz (from
parietal lobe), T1, T2, T3, T4, T5 and T6 (from temporal
lobe) and C3, C4 and Cz (from motor cortex region) for
extracting necessary information by applying signal processing techniques.
C. Experiment 2: Selection of EEG Features
Selection of correct features is important for EEG classification problem for accurate decoding of mental tasks. Literature reveals a variety of time domain (e.g., Hjorth parameters [19], Autoregressive parameters [20]), frequency domain (e.g., power spectral density) and time-frequency correlated (e.g., Discrete wavelet transform [21]) EEG features. To select the right EEG features for the present problem, we first plot the EEG signal pattern recorded from the specific brain regions. Fig. 6 presents the raw EEG signal acquired from the temporal region during visual stimuli containing 7 different vowel sounds.
It is important to note from Fig. 6 that EEG signal amplitude is enhanced at around certain EEG samples (here, around 250th sample) for every vowel sounds.
Therefore, it is necessary to extract information that results in the rise in signal amplitude. Power spectral density (PSD), which is a well-known frequency-domain EEG feature to extract signal power distribution, is applied on the filtered EEG signal acquired from the parietal, temporal and motor cortex regions. Besides PSD, we too extract a special kind of EEG features namely approximate entropy (ApEn), which can accurately quantify the unpredictable fluctuations of EEG samples. It
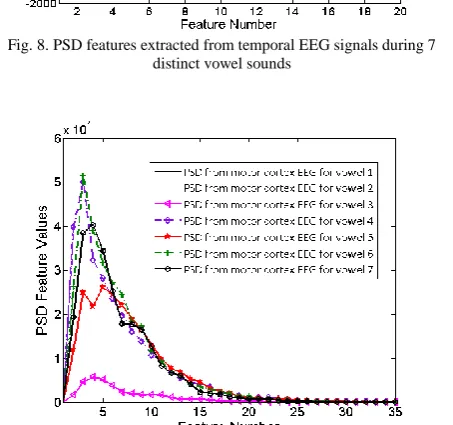
is important to mention here that filtering of EEG signal is done by using a standard Elliptic band pass infinite impulse response (IIR) filter of order 4, which has the pass band frequency of 0.5-70 Hz. The selection is made so because of the superior performance of Elliptic filter as compared to its standard counterparts including Butterworth and Chebyshev [22]. Now, for each subject and each vowel sound, PSD and ApEn extract 10×12×253 and 10×12×1 feature sets respectively (since, here, experiment is repeated 10 times and number of selected electrodes 12). Fig. 7, 8 and 9 present the PSD features extracted from the above brain regions.
Fig. 9. PSD features extracted from motor cortex EEG signals during 7 distinct vowel sounds
Fig. 8. PSD features extracted from temporal EEG signals during 7 distinct vowel sounds
Fig. 7. PSD features extracted from parietal EEG signals during 7 distinct vowel sounds
It has been observed from Fig. 7, 8 and 9 that although PSD extracts 253 features for a particular vowel sound, only a fewer features (e.g., 3rd, 4th, 5th) can discriminate
vowel sounds jointly. In this manner, we finally obtain 12 such features that can be fed to the classifier to decode the vowel sound.
V. CLASSIFIER PERFORMNACE
We examine the classification accuracy of the proposed classifier techniques by observing i) individual class performance during the classifier training and ii) overall classifier performance during testing phase.
1)Individual Class Performance During Training
For individual class performance of different genres, the proposed classification algorithms are trained with 840 trials, one for each vowel sound, repeated ten times on each of 12 subjects. A standard ten-fold cross validation technique is employed to check the consistency of the data, where nine out of ten folds are applied for training purposes and the remaining one fold is used for the validation purposes. Table I provides the individual class performance of 7 vowel sounds.
TABLE I
CLASSIFICATION PERFORMANCE ANALYSIS WITH BOTH TWO PROPOSED MODEL
Vowel Sound
Classification Accuracy (%) using Model 1 for
Classification Accuracy (%) using Model 2 for Worst Average Best Worst Average Best Vowel
1(A)
62.50 74.16 80.3 3
70.83 79.16 91.6 6 Vowel
2(AA)
60.00 69.66 78.3 3
65.00 76.66 83.3 3 Vowel
3(AeA)
64.16 70.83 81.6 6
70.00 80.83 92.5 0 Vowel
4(EE)
63.33 68.33 77.5 0
71.66 75.33 90.8 0 Vowel
5(O)
61.66 73.33 79.1 6
69.66 82.50 89.1 6 Vowel
6(Ae)
65.00 76.66 82.5 0
73.33 87.50 94.1 6 Vowel
7(UU)
60.80 67.50 76.6 6
68.33 85.00 95.0 0 2) Overall Classifier Performance During Testing Phase To study the relative performance, we consider the following two standard classifiers: 1) support vector machine (SVM) [23] and back propagation neural network
(BPNN) [24] along with our two proposed methods. Table II provides the average percentage classification accuracies, where from it can be concluded that the proposed model II outperforms the existing BPNN, SVM and Model I by a significant margin.
TABLE II
PROPOSED CLASSIFIER COMPARISON WITH EXISTING STANDARD CLASSIFIER
Vowel Sound
Subjective Average Classification Accuracies (%) for
SVM BPNN Proposed
Model 1
Proposed Model 2
Vowel 1(A) 71.66 74.16 74.34 79.43
Vowel 2(AA) 73.33 76.66 69.66 76.83
Vowel 3(AeA) 68.33 82.50 70.37 80.40
Vowel 4(EE) 65.00 75.83 68.76 75.33
Vowel 5(O) 65.33 77.33 73.52 82.54
Vowel 6(Ae) 67.50 82.50 76.66 87.50
Vowel 7(UU) 73.33 80.00 67.50 85.08
Consonant using Vowel-blank-Vowel format
63.33 71.66 68.33 74.16
Table III and IV present the statistical test results by applying well-known McNemar’s test[25] using model I and model II algorithms respectively. The z value in McNemar’s test is given by the equation 4:
22 m n 1
z
m n
(4)
TABLE III
STATISTICAL PERFORMANCE TEST FOR MODEL I ALGORITHM WITH
MCNEMAR’S TEST
Classifier name McNemar’s constant (m) McNemar’s constant (n)
Z P
SVM 6 12 1.14 <0.0001
BPNN 7 10 1.45 <0.0012
TABLE IV
STATISTICAL PERFORMANCE TEST FOR MODEL II ALGORITHM WITH
MCNEMAR’STEST Classifier name Mcnemar’s constant (m) Mcnemar’s constant (n)
Z P
SVM 4 17 2.61 <0.0006
BPNN 5 21 2.94 <0.0017
From Table III and IV, z value describes that our proposed model I and II outperform the above two standard classifiers with a wider margin.
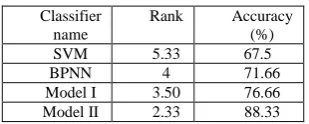
Table V shows Friedman test [26] performance using the proposed algorithms: Model I and Model II. Friedman test is done with four classifiers (SVM, BPNN, Model I, Model II) for each of seven vowel datasets. The statistical measure is given by (5).
2 2
1 12
3 ( 1)
( 1)
t
r t
i
R n t
nt t
(5)
Ris the rank of each vowel database. nis number of
databases, here it is 7. t is number of classifiers, here it is 4. This Friedman test is done on twelve subject databases. Table V describe the rank of each classifier, which is evaluated according to the average classifier accuracy with all stimuli.
From Table V, it can be concluded that our proposed Model I and Model II classifier also provide superior performance than SVM and BPNN classifier in Friedman test.
TABLE V
STATISTICAL PERFORMANCE TEST FOR MODEL I AND MODEL II
ALGORITHMWITH FRIEDMAN TEST
Classifier name
Rank Accuracy (%)
SVM 5.33 67.5
BPNN 4 71.66
Model I 3.50 76.66
Model II 2.33 88.33
Table VI describes the performance analysis of our model algorithms with previous existing methods. We can see that our model I, II classifiers outperform the other existing methods with a wider margin.
TABLE VI
PERFORMANCE COMPARISON WITH PREVIOUS WORKS
Methods Accuracy(%)
DaSalla method (SVM)[2] 82
S.Iqbal (non linear SVM)[3] 77.5 Kamalakkannan (Bipolar NN)[4] 44
Our Model I and II 85-90
VI. CONCLUSIONS
The paper to the best of the authors’ knowledge is one of the early researches on mentally imagined alphabet classification using EEG as the modality. We used classical fuzzy and IT2FS induced RBF neural nets for classification of both
vowel and consonant sound imageries using a three elemental codes, containing vowel, followed by a space, followed by a second vowel. The IT2FS induced RBF neural technique outperforms its type-1 fuzzy induced counterpart, BPNN and SVM classifier based classification by a significant margin. The work is also compared with existing works in classification accuracy, and the results are acceptable with reference to the present technology in EEG research and pattern classifiers.
ACKNOWLEDGMENT
Authors are gratefully acknowledged by University Grant Commission (UGC), the Project: University with Potential for Excellence Program in Cognitive Science (Phase II) granted to Jadavpur University.
REFERENCES
[1] D. Purves , R. Cabeza , S. A. Huettel , Kevin S. LaBar , M. L. Platt , M. G. Woldorff , “Principles of Cognitive Neuro Science,” , second new Edition.
[2] Z. Lan, O. Sourina, L.P. Wang and Yisi Liu, "Real-time EEG-based Emotion Monitoring Using Stable Features," The Visual Computer, vol.32, pp.347-358, 2016
[3] Maja Stikica, Robin R. Johnsona, Veasna Tana, and Chris Berkaa, "EEG-based classification of positive and negative affective states," Brain-Computer Interfaces, vol.1, pp.99-112, 2014.
[4] X. Hou, Y. Liu, O. Sourina, Eileen Y.R. Tan, L. P. Wang, and Wolfgang Mueller-Wittig, "EEG based Stress Monitoring," 2015 IEEE International Conference on Systems, Man, and Cybernetics, Hong Kong, 9-12 Oct, 2015
[5] Andrew X. Stewarta, Antje Nuthmannb, Guido Sanguinettic, "Single-trial classification of EEG in a visual object task using ICA and machine learning," Journal of Neuroscience Methods, vol.228, pp.1-14, 2014. [6] C. S. DaSalla, H. Kambara, M. Sato, Y. Koike, “Single-trial
classification of vowel speech imagery using common spatial patterns,” Elsevier Neural Network, Volume 22, November 2009, pages 1334-1339 [7] S. Iqbal,Y. Uzzaman Khan, O. Farooq, “EEG Based Classification of Imagined Vowel Sounds,” in proc. 2ndIEEE conference of Computing for Sustainable Global Development(India COM),2015,.
[8] R. Kamalakkannan, R. Rajkumar, M. Madan Raj., S. Shenbaga Devi., “Imagined Speech Classification using EEG,” Advances in biomedical science and engineering, volume 1, number 2, december 2014. [9] A. Riaz, S. A. Shanza, A. A. Khan, “Inter comparison of classification
techniques for vowel speech imagery using EEG Sensors,” in Proc. IEEE second international conferences on Systems and Informatics(ICSAI),2014.
[10] J. Kim, Lee SK, Lee B, “Eeg classification in a single-trial basis for vowel speech perception using multivariate empirical mode decomposition, ” J Neural Eng. 2014 Jun;11(3):036010. doi: 10.1088/1741-2560/11/3/036010. Epub 2014 May 8.
[11] S. Chen, C. FN. Cowan and P. M. Grant, “Orthogonal least squares learning algorithm for radial basis function networks,” IEEE Transactions on Neural Network, vol. 2, no. 2 pp. 302-309, 1991. [12] L. M. Ai, W. Rui, H. D. Mei and Y. 1. Fu, “Feature extraction and
classification of mental EEG for motor imagery,” in proc. IEEE Fifth international Conference on Natural Computation, vol. 2, pp. 139 143, Tianjian, China, 2009.
[13] S. M. Pincus, “Approximate entropy as a measure of system complexity,” Proceedings on the National Academy of Sciences, vol. 88, no. 6, pp. 2297-2301,1991.
[15] H. Zhao, P. C. Yuen and J. T. Kwok, “A novel incremental principal component analysis and its application for face recognition,” IEEE Transactions on Systems, Man, and Cybernetics, Part B:Cybernetics, vol. 36, no. 4, pp. 873-886, 200.
[16] S. Chen, C. FN. Cowan and P. M. Grant, “Orthogonal least by squares learning algorithm for radial basis function networks,” IEEE Transactions on Neural Network, vol. 2, no. 2 pp. 302-309, 1991. [17] J. M. Nazzal, I. M. El-Emary and Salam A. Najim, “Multilayer
Perceptron Neural Network (MLPs) For Analyzing the Properties of Jordan Oil Shale,” World Applied Sciences Journal 5 (5): 546-552, 2008, ISSN 1818-4952
[18] Q. Liang and J. M. Mendel, “Interval Type-2 Fuzzy Logic Systems: Theory and design,” IEEE transaction on Fuzzy System, vol 8, No. 5, October 2000
[19] A. R. Suleiman, T. Fatehi, “Feature extraction Technique of EEG Signal for BCI Applications,” .
[20] W. Wong, G. Bian, “Estimating Parameters in Autoregressive Models with Asymetric Innovation,” working paper no. 0408, Department of ecomics.
[21] M. Mozammel Hoque Chowdhury and Amina Khatun, “Image Compression Using Discrete Wavelet Transform,” IJCSI International Journal of Computer Science Issues, Vol. 9, Issue 4, No 1, July 2012
[22] A. Saha, A. Konar, A. Chatterjee, A. K. Nagar, A Ralescu, “EEG Analysis for Olfactory Perceptual-Ability Measurement Using a
Recurrent Neural Classifier,” IEEE transaction of Human Machine System, Volume 44, issue 6.
[23] D. K Srivastava, L. Bhambhu, “ Data Classification using Support Vector Machine,” ,in proc. of JATIT, 2005.
[24] V.N.P. Rao, Rao Vemuri , “A Performance Comparison of Different Back Propagation Neural Networks Methods in Computer Network Intrusion Detection,”
[25] X. Sun, , Z. Yang, “ Generalized McNemars Test for Homogeneity of the marginal distribution,” , in proc. of SAS global Forum, paper 382, 2008.
![Table III and IV present the statistical test results by applying well-known McNemar’s test[25] using model I and model II algorithms respectively](https://thumb-us.123doks.com/thumbv2/123dok_us/1098855.1610573/5.595.310.554.547.767/table-present-statistical-results-applying-mcnemar-algorithms-respectively.webp)