R E S E A R C H
Open Access
Adaptive image enhancement algorithm
based on the model of surface roughness
detection system
Jie Tian and Xijie Yin
*Abstract
In view of the relatively high noise interference and halo phenomenon of the traditional adaptive image enhancement algorithm based on the unsharp masking method, a kind of adaptive image enhancement algorithm based on the integration of the model of surface roughness detection system (hereinafter referred to as MSRDS for short) is put forward in this paper. Through the design of the model of the surface roughness detection system, non-linear segmentation, denoising, and adaptive amplification are carried out on the details of the image under this system model. The dynamic range compressed image base layer and the adaptively enhanced image detail layer are non-linearly superimposed to obtain the final enhanced image. Finally, through the comparative experiment analysis, it demonstrates that the method put forward in this paper can suppress the interference noise and the halo phenomenon of the image very well while carrying out dynamic range compression and detail amplification of the adaptive image effectively. And the result thus obtained is very suitable for the back-end image processing of the actual thermal infrared imager.
Keywords: Adaptive image, Image enhancement, Surface roughness detection, Image processing
1 Introduction
With the development of industrial production technol-ogy, there is an increasing demand for product precision and surface roughness of parts. The traditional surface roughness measurement method is mainly compared with the sample block and compared with the measured surface according to vision or touch. According to differ-ent comparison methods, it is divided into comparative method, impression method, stylus method, interference method, and light-cut method. Nowadays, these trad-itional measurement methods are more and more unable to meet the demand of surface roughness detection of today’s production, so continuing a one of a kind is a new way to solve this problem. The image detection method belongs to a non-destructive technology detec-tion method. Since image processing and informadetec-tion processing can be used, more and more researchers are now studying how to use the image processing method to measure the surface roughness.
With the maturity of the surface roughness detection technology, all the thermal infrared imagers today have extremely high dynamic range (HDR), which can reach up to 14 bits or even higher (in this paper, 14 bits is adopted as an example) [1, 2]. The relatively high dy-namic range ensures that the thermal imager can still clearly distinguish the details of the temperature change in the scene where the temperature change is extremely great [3–5]. However, high dynamic range can cause a mismatching issue between the original image captured and the back-end device [6, 7]. As the traditional back-end display and processing devices are all based on 8-bit gray scale images, the dynamic range compression (DRC) of the adaptive image is a very important aspect in the back-end image processing of the thermal infrared imager [8–10]. The DRC processing technology has been greatly developed in recent years. Among them, the methods of automatic gain control (AGC) and histogram equalization (HE) have been most widely applied [11, 12]. The AGC method maps 14-bit raw data linearly to 8-bit pixel values after eliminating the interference noise [13,14]. On the other hand, the HE distributes the gray * Correspondence:[email protected]
School of Data and Computer Science, Shandong Women’s University, Jinan 250300, China
level of the probability density function (PDF) of the ori-ginal image to more output gray levels, while merging or compressing the relatively small gray levels of the PDF to enhance the DRC of the image and the contrast. However, the HE method also has some obvious defects [15]. In view of the insufficiency of AGC and HE pro-cessing methods in the detailed control [16], some of the more complex algorithms have also been developed [16–18]. With the increasing application of computer in-formation technology, computer graphics-related know-ledge has been used in many fields, such as film production, games, and computer-intelligent image en-hancement,, where computer intelligent image enhance-ment technology has been applied. In most cases, the resolution of computer intelligent images is relatively high. Generally, the redundant information part needs be removed from the images to improve the efficiency and level of information processing. So far, many image enhancement algorithms are aimed at single, static computer-intelligent images, and there are relatively few studies on dynamically enhanced ones. Through the re-view of related literatures, it can be concluded that there are still many algorithms for image enhancement, which can be divided into vertex deletion, region merging, and repeated edge contraction specifically. Analysis shows that the most widely used is the edge contraction method. In such algorithm, an SAR framework is constructed based on the fusion of computer-intelligent images to achieve effective refinement of images on this basis. Most of the algorithms previously proposed were for static im-ages, and the effects thus obtained were also very promin-ent. However, such algorithms fail to take the time consistency issue into full consideration. Hence, it is diffi-cult to apply them directly to dynamic networks.
In view of the above deficiencies, an adaptive image en-hancement algorithm based on the integration of the sur-face roughness detection system model is put forward in this paper. Through the construction of the surface rough-ness detection system model, the gray levels of input and output are defined under this model to implement the image segmentation, detail adaptive amplification, and dy-namic range compression of the base layer part. In this process, the halo phenomenon is eliminated very well and the interference noise of the image details is suppressed effectively.
2 Method—construction of surface roughness detection model
Through analysis, it can be found that in order to solve this problem, it is necessary to make necessary improve-ments to the segmentation and superimposition processes of the two images. In the actual processing of the images, it is not necessary to follow the inherent addition and sub-traction operations. And some non-linear operations can
be designed in accordance with the actual needs based on the noise level of the actual images and some characteris-tics of the mask itself. In addition, in the design of the homomorphic filter, the image is first subjected to log transformation, that is, after the image data are trans-formed into the logarithmic domain, the post-processing of the image (such as the low-pass filtering) is carried out. The experiment shows that the effect after such process-ing is greatly improved compared with the traditional de-sign methods. Inspired by this method, the image operation in the process is redesigned in this paper. And the basic idea is shown in Fig.1.
In Fig.1,Φ() stands for a function that can be custom-ized. If Φ() is defined as y=x, the above system is not different from the normal operation, that is, the normal linear operation. However, in the actual design, Φ() is generally defined as the non-linear function. At this point, the entire operation block diagram will no longer maintain the normal linear operation properties. There-fore, it can be referred to as the generalized linear oper-ation. Hence, the operation is redefined for this purpose. It is assumed that add;sub;andmult stand for the addition operation, the subtract operation, and the multiplication operation, which is represented by the fol-lowing formula, respectively:
x1addx2¼Φ−1½Φð Þ þx1 Φð Þx2 ; ð1Þ
x1subx2¼Φ−1½Φð Þx1 −Φð Þx2 ; ð2Þ
amultx1¼Φ−1½aΦð Þx1 ; ð3Þ
In the above three equations, x1 and x2 stand for
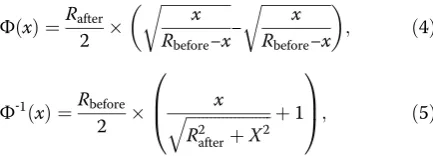
two-channel input signals, and the signals may be one-dimensional or multi-dimensional arrays; α stands for a real number and Φ() defines a non-linear function in accordance with actual needs. In view of the different requirements of the image enhancement, the following Φ() functions are designed, respectively:
Φð Þ ¼x Rafter
2
ffiffiffiffiffiffiffiffiffiffiffiffiffiffiffiffiffi x Rbefore−x r
−
ffiffiffiffiffiffiffiffiffiffiffiffiffiffiffiffiffi x Rbefore−x r
; ð4Þ
Φ‐1ð Þ ¼x Rbefore
2
x ffiffiffiffiffiffiffiffiffiffiffiffiffiffiffiffiffiffiffiffiffi R2afterþX2
q þ1
0 B @
1 C
A; ð5Þ
in which Rbefore stands for the gray level of the input
image and Rafter stands for the gray level after the
operation is completed. In most cases,Rbeforeis equal to
Rafter. However, when some of the calculations involve
the dynamic range compression of the image, Rbefore is
not equal to Rafter. In addition, to facilitate the
under-standing, two variables, Rbefore and Rafter, are extracted
outside the operation. And a model of the original sur-face roughness detection is established, as shown in Fig.2.
After the construction of the surface roughness detec-tion, Eqs. (4) and (5) are converted to the following:
Φð Þ ¼x 1
2
ffiffiffiffiffiffiffiffi x
1−x r
−
ffiffiffiffiffiffiffiffi
1−x x
r !
; ð6Þ
Φ‐1ð Þ ¼x 1
2
x ffiffiffiffiffiffiffiffiffiffiffiffiffi
1þx2
p þ1
; ð7Þ
Equations (6) and (7) are introduced into the Eqs. (1), (2), and (3) to obtain the following:
x1addx2¼
1 2
ffiffiffiffiffiffiffiffiffiffiffiffiffiffiffiffiffiffiffiffiffiffiffiffiffiffiffiffiffiffiffiffiffiffiffiffiffiffiffiffiffiffiffiffiΦð Þ þx1 Φð Þx2
1þðΦð Þ þx1 Φð Þx2 Þ2
q þ1
0 B @
1 C A; ð8Þ
x1subx2¼
1 2
Φð Þx1 −Φð Þx2 ffiffiffiffiffiffiffiffiffiffiffiffiffiffiffiffiffiffiffiffiffiffiffiffiffiffiffiffiffiffiffiffiffiffiffiffiffiffiffiffiffi
1þðΦð Þx1 −Φð Þx2 Þ2
q þ1
0 B @
1 C A; ð9Þ
x1multx2¼
1 2
αΦð Þx1 ffiffiffiffiffiffiffiffiffiffiffiffiffiffiffiffiffiffiffiffiffiffiffiffiffiffiffiffiffiffiffiffiffiffiffi
1þðαΦð Þx1 Þ2
q þ1
0 B @
1 C
A; ð10Þ
3 Adaptive image enhancement algorithm
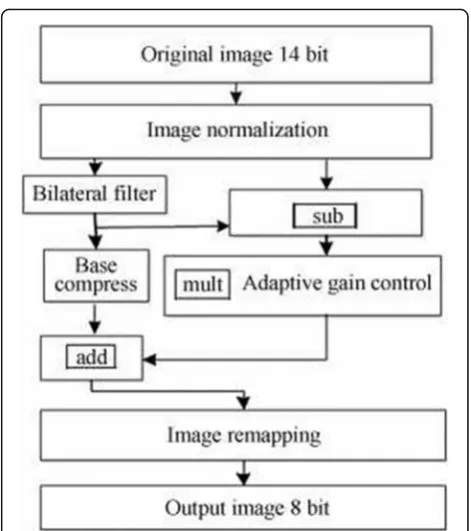
In this paper, a kind of new adaptive image enhancement algorithm is put forward. And the specific process design is shown in Fig.3.
The system first extracts the base layer image of the image through bilateral filtering and then makes use of the model of surface roughness detection system (MSRDS) operation put forward in Section3 to segment the details of the image from the original image. Subse-quently, the dynamic range of the base layer is compressed
and the detail layer is enhanced and amplified. Among them, MSRDS multiplication operation can be used to im-plement DRC at the base layer, and the adaptive incre-mental control is adopted at the detail layer to enlarge detail information. Finally, the detail layer and the base layer images are added together by the MSRDS addition operation to obtain an image after the enhancement.
In the traditional adaptive image enhancement algo-rithm, no matter the subtraction algorithm or the tem-plate matching algorithm is adopted, it is necessary to carry out one-to-one match and calculation on the pixels of the template image and the image to be tested. The error caused by the image offset is a problem that can-not be eradicated. The solution can only be obtained by increasing the image registration and correction algo-rithm, which will result in the impact on the real-time performance of the algorithm. In the residue detection algorithm based on the fusion of the Moore nearest neighbor model, the residue is highlighted, which has ef-fectively avoided the image offset problem. At the same time, the vector machine classification is introduced,
Fig. 2Construction of surface roughness detection model
which has reduced the misjudgment caused by the image offset and improved the detection accuracy.
In the new image enhancement algorithm, three stages are required in general: the core algorithm design, the ex-perimental design and implementation, and the experiment. This is a cyclic process of optimization and improvement, in which multiple aspects of work need to be completed.
Definition 1Core algorithm development researchers are most interested in the modeling of the image en-hancement algorithm and the implementation of its basic programming, which is also referred to as the new algorithm or target algorithm, the“Useful work”Wuseful.
Definition 2Auxiliary development is the basic image algorithm research and development to support the core algorithm development, as well as the GUI visualization development for human-computer interaction, which is “Extra work”Wextra.
Therefore, the development efficiency is ,
in whichWusefulis difficult to change in general, and it is preferable that the algorithm and interface resource re-use and inheritance mechanisms can be proved in the development environment to reduce or avoid theWextra and improve the efficiency.
W有 Wuseful
W额
Wextra
The model put forward in this paper includes the pro-cessing mode and the operating mode.
The visual image enhancement mode flow and the specific steps are as follows.
Step 1: Acquire the original image data
Step 2: Carry out gray scale processing on the original image
The specific process of the gray scale algorithm is as follows: Obtain the R, G, and B components of each pixel; calculate the R, G, and B components of each pixel in accordance with Eq. (11); calculate and obtain the temp overlay on the original pixel; and repeat the afore-mentioned process from the first pixel to the last pixel in continuous loop.
temp¼ðr299þg587þb114þ500Þ=1000:
ð11Þ
Step 3: Carry out median filtering on the gray scale image
The specific process of the median filtering algorithm is as follows: Obtain the gray scale value of nine pixels through a 3 × 3 sliding window; calculate the gray scale value of nine pixels in accordance with Eq. (12); traverse the whole image in turn by theWtemplate; and replace the pixel value at the center point of the template with the median value obtained in the area covered by the template with the size ofW.
g xð ;yÞ ¼medff xð −k;y−lÞ;ðk;l∈WÞg; ð12Þ
in which med stands for the median operation, that is, the pixels in theWtemplate are first sorted by size, and then, the median value of the pixels in the W matrix is obtained. f(x,y) and g(x,y) stand for the original image and the processed image, respectively.
Step 4: Perform three-layer adaptive decomposition on the filtered gray image.
Adaptive transform is the basis of adaptive decompos-ition of images, and the adaptive basis function is as follows:
Ψa;τð Þ ¼t 1ffiffiffi a
p Ψ t−τ
a
a;τ∈R;a>0; ð13Þ
in whichastands for the scaling factor andτstands for the translation factor. Let Ψ(x,y) stand for the two-dimensional basic adaptation, then the two-two-dimensional basic adaptation is defined as follows:
WTfða;b1;b2Þ ¼ f xð ;yÞ;Ψa;b1;b2ðx;yÞ
¼1
a∬f xð ;yÞΨ
x−b1
a ;
y−b2 a
dx;dy;
ð14Þ
in whichΨa;b1;b2ðx;yÞ ¼ 1
a∬fðx;yÞΨ
ðx−b1
a ; y−b2
a Þstands for
the scale expansion and two-dimensional displacement of Ψ(x,y). 1
a stands for the normalization factor
intro-duced to ensure that the energy remains unchanged be-fore and after the adaptation.
After the image is adaptively decomposed, the low-frequency coefficient, horizontal high-frequency coefficient, vertical high-frequency coefficient, and oblique high-frequency coefficient of the image can be obtained.
Step 5: In accordance with Eq. (5), low-frequency
c ið Þ ¼4c ið Þ;c ið Þ>405
c ið Þ ¼0:1c ið Þ;c ið Þ≤405; ð15Þ
in whichc(i)stands for the coefficient after two-dimensional decomposition is carried out on the image.
Step 6: Enhance the image after the Moore nearest neighbor model is applied. The specific calculation in ac-cordance with Eq. (16) is as follows:
g xð ;yÞ ¼ 01;;f xð ;yÞ<threshold
f xð ;yÞ>threshold ð16Þ
in which f(x, y) stands for the image after the adaptive decomposition and reconstruction,g(x, y) stands for the image after the enhancement, and threshold stands for the threshold value selected for the enhancement.
Step 7: Perform statistical calculation on the number of pixels 0 and 1 for the enhanced image and store the statistical data as an array, such as:image½i ¼ fpixel0 nums;pixel1numsg.
Step 8: For cycle steps 1 ~ 7 of multiple images in the same mold cavity, the array of each image is obtained and input into the support vector machine. The property of the arrays with residue is marked as 1, and
those without residue marked as −1 to obtain
the specific method of the two-class classification mathematical judgment model for determining whether there is a residue as follows:
Select the linear kernel functionK(xi,xj) =xi, xjto ob-tain two types of samples(xi,xj),i= 1, 2,…,n, in whichn stands for the number of samples thus obtained. When xifalls under sample classω1that does not contain
resi-dues,yi= 1 and whenxifalls under sample classω2that
does not contain residues, yi =−1, the support vector machine is used for processing to obtain the classifica-tion model as follows:
fðxÞ ¼ sgnfP
n
i¼1a
iyiðxixÞ þbg parameters a∗ and
b∗.
The operating process of the adaptive image enhance-ment algorithm and the specific steps are as follows.
Step 1: Obtain the judgment image data
Step 2: Perform gray scale processing on the judgment image
Step 3: Carry out filtering on the gray scale image Step 4: Perform three-layer adaptation on the filtered gray scale image
Step 5: Apply the Moore nearest neighbor model on the three-layer adaptive image to highlight the contour of the residue
Step 6: Enhance the image after the Moore nearest neighbor model is applied
Step 7: Perform statistical calculation on the number of pixel 0 and 1 for the enhanced image and store the statistical data as an array
Step 8: Adopt the two-class classification mathematical model to judge whether there is residue for the array in Step 7, to determine whether the array is an array that contains the residue image
3.1 Image construction and remapping
As the pixel data of the input image is represented by 14 bits, the possible distribution of the actual image pixel gradation is 0 ~ 16383. Therefore, when the image con-struction processing in Fig. 3 is carried out, it can be simply obtained through the image divided byRbefore(R be-fore= 16383). However, from the imaging characteristics
of the adaptive images, it can be seen that the images collected by the infrared detectors are often distributed in one of the regional segments from 0 to 16383 seg-ments instead of being distributed in the entire gray scale space. In order to obtain better results for the sub-sequent processing, the selection of Rbefore during the
construction of the image does not have to be con-strained by the theoretical gray scale distribution of the image. On the contrary, an ideal image gray scale distri-bution can be re-determined after the influence of the noise is eliminated. In addition, in order to ensure that the above proposed algorithm can be applied in the most effective manner, the gray scale with the maximum probability density function (PDF) on the gray scale histogram of the image is mapped to the zero value of the MSRDS (that is, 1/2). AndRbeforecan be determined
by using the probability density function (PDF) and the cumulative probability distribution function (CDF) of the image gray scale with the formula is as follows:
rmin¼ minfr CDF rj ð Þ>Pnoise=2g rmin¼ maxfr CDF rj ð Þ<1−Pnoise=2g r1=2¼r PDF rj ð Þ>PDF rð þδÞ Rbefore¼2 max rmax−r1=2;r1=2−rmin
ð17Þ
in whichPnoisestands for the level of the camera, which
is described in the detector. It can also be selected through theRaftermeasured in the experiment in a
sim-ple manner in accordance with the requirements for the subsequent display equipment, which is selected as Rafter= 255 in general.
is set that δs= max(Width, Height)/16, and δg is set to about 10% of the dynamic range of the image. The in-trinsic meaning of these two parameter settings is as fol-lows: If the pixel area in the image area is smaller than approximately 10 %δgleft of the total gray scale range, it can be regarded as the detail change of the image. The δs set indicates that the MSRDS filter scope is 1/16 the width of the image. The pixels beyond this range have very little effect on the filtering results, which tend to be almost zero and are negligible.
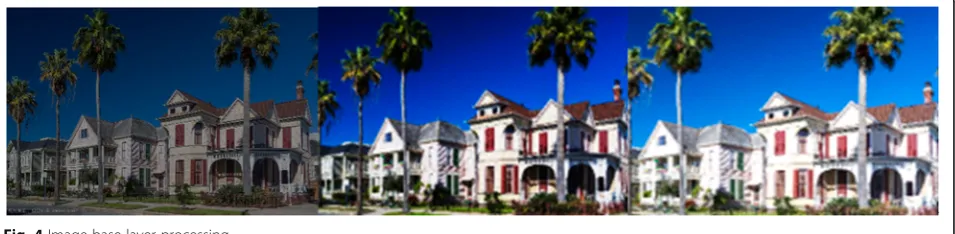
After the base layer image is obtained, it is neces-sary to carry out dynamic range compression. From Fig. 4, it can be seen that in the MSRDS operation, if the signal is multiplied by the last number that is less than 1, the value near the GL−Φ zero value of the signal will be compressed. On the basis of this principle, the base layer image is multiplied with α in this paper to achieve dynamic range compression. In this experiment, α= 0.2, and the results are shown in Fig. 4. From Fig. 4, it can be seen that after the pro-cessing of the MSRDS multiplication, the dynamic range of the base layer image is compressed. How-ever, as the base layer of the image only summarizes the approximate gray scale distribution of the image, the detailed information of the image is relatively missing, which requires the image at the detail layer to supplement.
3.3 Acquisition of image detail layer
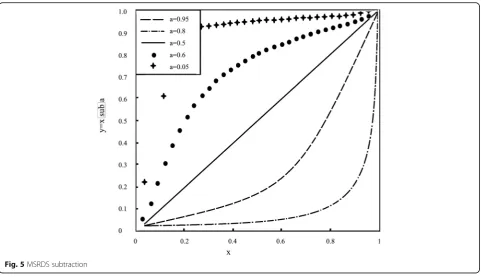
By subtracting the base layer image obtained by 4.2 from the original image, the detail layer of the image can be obtained. The subtraction operation of the image can adopt either the traditional subtraction method or the MSRDS put forward in Section 3. The MSRDS effect diagram can be obtained from Eq. (21) and Fig. 2. And the results are shown in Fig. 5 as follows:
In accordance with the analysis equationyðδÞ ¼ ðxþδ
Þsubx in Fig. 5, x is regarded as a constant and δ is regarded as a variable. And the following conclusions can be drawn:
dy
dδ→0jδ→1;x→0; dy
dδ→∞jδ→0;x→0; ð18Þ
From Eq. (12) and Fig.5, it can be seen that when the two subtraction numbers are very close (that is, δ→0), the MSRDS operation has certain amplification effect on the difference between the two numbers. At this point, it is highly sensitive to the change of 8; while when the two subtraction numbers are significantly different (that is,δ→1), the MSRDS has the compression effect on the difference of the two numbers, and it will be less sensi-tive to the change of 8. Through the comprehensive ana-lysis, it can be known that the MSRDS can extend small differences while compress large differences.
4 Experiment and result discussions
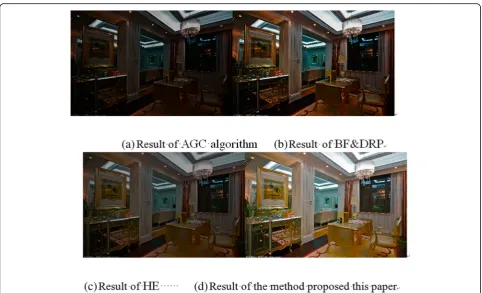
In order to verify the experimental results of the algo-rithm model put forward in this paper, the proposed al-gorithm is compared with the commonly used AGC algorithm, the histogram equalization (HE), and the pro-posed MSRDS algorithm. The AGC and HE are selected because they are commonly used and effective methods to implement the image enhancement, while the MSRDS is selected because it adopts the same MSRDS as the edge preserving filter and is the same as that in the method put forward in this paper. And the parameters of the MSRDS algorithm are set in accordance with the default value. In addition, the selected scenes are three highly representative ones: (1) The scene with relatively long outdoor distance (approximately 2 km away), (2) the scene with relatively close outdoor dis-tance (within 100 m), and (3) the indoor experimenter. The results of the three groups of experiments are shown in Figs.6and7.
It can be seen from Fig. 6 that the AGC method has relatively smooth image surface, low contrast, and blurred image. And when the HE model and MSRDS deal with the distant scenes outdoors, although the im-ages have been locally enhanced, it also results in the blurring in some local areas (arrow B and arrow C). However, when local area is enhanced, the method put forward in this paper can still display the details outside
Fig. 5MSRDS subtraction
2 km (crane wire outside 2 km, that is, arrow D). Among them, the processing result of MSRDS has relatively high contrast, but the whole image is excessively sharp and the overall effect of the image is insufficient. During the programming of the MSRDS algorithm, the default values of the original literature are adopted at this point. The selection of the parameters still needs to be opti-mized. If the parameters can be adjusted to the optimal ones, better results can be obtained.
Figure 7 is an external field image which is relatively close to the observer. From the visual effect of the image, the AGC algorithm and the HE algorithm are sig-nificantly blurred at the arrow A and arrow C, while the BF and DRP algorithm shows excessively sharpened halo phenomenon at the arrow B. In particular, the halo phenomenon at the upstairs windows of the residents is very serious. The processing results of the method put forward in this paper have relatively good overall effect. For example, the house structure streak at the arrow D is still clearly visible.
5 Conclusions
In this paper, a new adaptive image enhancement algo-rithm technique is designed through the analysis of the imaging characteristics of the adaptive images. Firstly, the base layer part of the image is segmented by MSRDS. Then, the MSRDS operation is carried out to
segment the base layer, and the detail image is enlarged to achieve the dynamic compression of the base layer. In the MSRDS operation definition, the data overflow prob-lem is solved effectively, which has eliminated the halo phenomenon of the image and suppressed the image noise appropriately. The comparison experiments show that the method put forward in this paper has significant improvement in the overall performance of the image, the detail performance, and the mean contrast enhance-ment of the image, which is a very important reference value for the actual image processing in the back-end of the infrared imager.
The method put forward in this paper has a clear idea and is suitable for a hardware design. The algorithm pro-posed in this paper has been successfully implemented in the DE2-115 FPGA development version, which is not de-scribed in this paper due to the limited space. However, in the design of this paper, due to the large number of pa-rameters involved, whether the settings of these parame-ters are appropriate or not will have relatively great impact on the results in general. In the subsequent work, how to adjust these parameters adaptively will be a major research direction within the subject.
Abbreviations
Acknowledgements
The authors thank the editor and anonymous reviewers for their helpful comments and valuable suggestions.
Availability of supporting data We can provide the data.
Author details
Jie Tian was born in Shandong, China, in 1983. She received the B.Sc. degree in Computer science and technology from Shandong Agricultural University, Taian, China, and M.Sc. degree in Computer software and theory from Taiyuan University of Science and Technology, Taiyuan, China, and her current research interests include Intelligent computing, machine learning, and image processing.
Xijie Yin was born in Shandong, China, in 1965. She received the Master degree from Shandong University, China. Now, she works in the School of Data and Computer Science, Shandong Women’s University, Her research interests include cloud security and image processing.
Funding
This work was supported in part by high level research project Cultivation Fund of Shangdong women's university, soft science project of Shandong (Grant No. 2014RKB01647) and data mining research innovation team of Shandong Women’s University, China.
Authors’contributions
All authors take part in the discussion of the work described in this paper. JT wrote the first version of the paper and did a part in the experiments of the paper. XY revised the paper in a different version. Both authors read and approved the final manuscript.
Competing interests
The authors declare that they have no competing interests.
Publisher’s Note
Springer Nature remains neutral with regard to jurisdictional claims in published maps and institutional affiliations.
Received: 8 July 2018 Accepted: 20 September 2018
References
1. B. Li, S. Wang, J. Zheng, L. Zheng, Single image haze removal using content-adaptive dark channel and post enhancement. IET Comput. Vis. 8(2), 131–140 (2014).
2. B. Li, W. Xie, Adaptive fractional differential approach and its application to medical image enhancement. Computers & Electrical Engineering45, 324– 335 (2015).
3. J.R. Tang, N.A.M. Isa, Adaptive image enhancement based on bi-histogram equalization with a clipping limit. Computers & Electrical Engineering40(8), 86–103 (2014).
4. W. Zhao, Z. Xu, J. Zhao, F. Zhao, X. Han, Variational infrared image enhancement based on adaptive dual-threshold gradient field equalization. Infrared Phys. Technol.66(66), 152–159 (2014).
5. Z. Zhou, S. Sorensen, H. Zeng, M. Hawrylycz, H. Peng, Adaptive image enhancement for tracing 3d morphologies of neurons and brain vasculatures. Neuroinformatics13(2), 153–166 (2015).
6. J.W. Wang, N.T. Le, J.S. Lee, C.C. Wang, Color face image enhancement using adaptive singular value decomposition in Fourier domain for face recognition. Pattern Recogn.57(C), 31–49 (2016).
7. L.T. Yuan, S.K. Swee, T.C. Ping, Infrared image enhancement using adaptive trilateral contrast enhancement. Pattern Recogn. Lett.54, 103–108 (2015). 8. Z. Ling, Y. Liang, Y. Wang, H. Shen, Adaptive extended piecewise histogram
equalisation for dark image enhancement. IET Image Process.9(11), 1012– 1019 (2015).
9. S. Dai, Q. Liu, P. Li, J. Liu, H. Xiang, Study on infrared image detail enhancement algorithm based on adaptive lateral inhibition network. Infrared Phys. Technol.68, 10–14 (2015).
10. H. Gupta, K.K. Sharma, S.D. Joshi, Resource efficient FPGA implementation of adaptive image enhancement algorithms. IETE J. Res.61(4), 429–439 (2015).
11. H. Wang, To, S, C.Y. Chan, Investigation on the influence of tool-tip vibration on surface roughness and its representative measurement in ultra-precision diamond turning. Int J Mach Tool Manu69(3), 20–29 (2013).
12. T.D.L. Irvinefynn, E. Sanzablanedo, N. Rutter, M.W. Smith, J.H. Chandler, Measuring glacier surface roughness using plot-scale, close-range digital photogrammetry. J. Glaciol.60(223), 957–969 (2014).
13. A. Krzeminski, S. Wohlhüter, P. Heyer, J. Utz, J. Hinrichs, Measurement of lubricating properties in a tribosystem with different surface roughness. Int. Dairy J.26(1), 23–30 (2012).
14. M. Launhardt, A. Wörz, A. Loderer, T. Laumer, D. Drummer, T. Hausotte, Detecting surface roughness on SLS parts with various measuring techniques. Polym. Test.53, 217–226 (2016).
15. Z. Liu, Q. Zhong, X. Yu, Q.J. Wang, Y. Zhang, Surface roughness measurement by depolarization method. Appl. Opt.54(18), 5686– 5690 (2015).
16. B. Kim, J. Seo, Measurement of surface roughness of plasma-deposited films using laser speckles. Appl. Surf. Sci.359, 204–208 (2015).
17. P.B. Nagy, J.H. Rose, Surface roughness and the ultrasonic detection of subsurface scatterers. J. Appl. Phys.73(2), 566–580 (1993).