INTERNATIONAL JOURNAL OF PHARMACEUTICAL, CHEMICAL AND BIOLOGICAL SCIENCES
Available online at
www.ijpcbs.com
BIOANALYTICAL METHOD DEVELOPMENT AND VALIDATION FOR
SIMULTANEOUS DETERMINATION OF PRAZOSIN AND POLYTHIAZIDE
DRUGS IN SPIKED HUMAN PLASMA BY RP-HPLC
M. Mukkanti Eswarudu
1, A. Lakshmana Rao
2*and K. Vijay
31
Department of Pharmacy, Jawaharlal Nehru Technological University,
Kakinada – 533 003, Andhra Pradesh, India.
2
V. V. Institute of Pharmaceutical Sciences,
Gudlavalleru – 521 356, Andhra Pradesh, India.
3
University College of Pharmaceutical Sciences, Acharya Nagarjuna University,
Nagarjuna Nagar – 522 510, Andhra Pradesh, India.
INTRODUCTION
Selective and sensitive analytical methods for the quantitative evaluation of drugs and their metabolites are critical for the successful evaluation of preclinical, biopharmaceutical and clinical pharmacological studies. Bioanalytical method validation includes all of the procedures which demonstrate that a particular method used for the quantitative measurement of analytes in a given biological matrix, such as blood, plasma, serum, or urine. These methods are reliable and reproducible1.
Prazosin is a quinazoline derivative, is the first of that chemical class of antihypertensive. Chemically it is designated as 1-(4-amino-6,7-dimethoxy-2-quinazolinyl)-4-(2-furoyl)
piperazine and its structural formula is shown in
Fig. 1. Prazosin is a sympatholytic alpha-adrenergic blocker used in the treatment of anxiety, hypertension, refractory pulmonary oedema and panic disorders. It reduces peripheral resistance and blood pressure by vasodilatation of peripheral vessel in arterioles and veins without increasing the heart rate or significantly impairing sympathetic function2-5.
It is official in Indian pharmacopoeia6, British
pharmacopoeia7, United States Pharmacopoeia8.
Polythiazide is an orally effective benzothiadiazine sulfonamide derivative belonging to the class of the thaiazide diuretics. Chemically it is designated as 2H-1,2,4- Benzothiadiazine-7-sulfonamide,6-chloro-3,4-dihydro-2-methyl-3-[[(2,2,2-trifluoroethyl) thio]methyl]-1,1dioxide and its structural
Research Article
ABSTRACT
A simple, novel, sensitive, rapid, precise and accurate high performance liquid chromatography method has been developed and validated for simultaneous determination of Prazosin and Polythiazide in human plasma using Hydrochlorothiazide as internal standard (ISTD).The analytes were extracted from 500 µl aliquots of human plasma sample by direct protein precipitation technique using acetonitrile. Evaluation of content of the drugs were done by employing a mixture of acetonitrile and potassium dihydrogen orthophosphate buffer in ratio of 35: 65 v/v as the mobile phase with a flow rate of 1 ml/min and injection volume of 10µl. Chromatographic separation was accomplished using Zorbax C18, (150×4.6 mm; 5µm) analytical column and the effluents were monitored at 265 nm with PDA detector. The total run time was 8 min with retention time of Prazosin, Polythiazide and Hydrochlorothiazide was 6.598 min, 5.214 min and 3.579 min respectively. Linearity was established at a concentration range of 5.0-500 ng/ml for Prazosin and 2.5-250 ng/ml for Polythiazide. The method was validated as per the US-FDA guidelines and the results were within the acceptance criteria and proposed method was successfully applied for the simultaneous determination of Prazosin and Polythiazide in human plasma.
formula is shown in Fig. 2. Its mechanism of action results in an interference with the renal tubular mechanism of electrolyte reabsorption 9-11.
Hydrochlorothiazide is a diuretic and antihypertensive. Chemically it is designated as 6-chloro-3,4-dihydro-2H-1,2,4-benzothiazine-7-sulfonamide1,1-dioxide. It structural formula is shown in Fig. 3. It acts by inhibiting the kidney’s ability to retain water. This reduces the volume of the blood, decreasing blood return to the heart and thus the cardiac output, is believed to lower peripheral vascular resistance 12-13.
Prazosin and Polythiazide combination is used in the treatment of high blood pressure (hypertension). Prazosin works by relaxing blood vessels so that blood passes through them more easily. The Polythiazide in this combination is a thaiazide diuretic (water pill) that helps to reduce the amount of water in the body by increasing the flow of urine. Both of these actions help to lower blood pressure 14.
Literature survey revealed that few analytical methods have been reported for estimation of Prazosin and Polythiazide individually or in combination with other drugs. The reported methods include Spectrophotometric15-19,
HPLC20-26, Bioanalytical HPLC27-30, simultaneous
estimation of Prazosin and Polythiazide in combined pharmaceutical formulations by RP-HPLC31-34. There are no reports as per our
knowledge that methods developed for the analysis of these two drugs in combination in blood plasma. The present study was aimed to develop a simple, sensitive, rapid, precise, accurate and validated the bioanalytical method for the simultaneous estimation of Prazosin and Polythiazide in human plasma. The developed method was validated according to US-FDA guidelines by using high performance liquid chromatography35.
MATERIAL AND METHODS Chemicals and reagents
Blank human plasma and pure drug samples including Prazosin, Polythiazide and Hydrochlorothiazide were obtained from Spectrum Pharma Research Solutions, Hyderabad, India. HPLC grade Acetonitrile was obtained from Merck Chemical Division, Mumbai, India. Analytical grade of Potassium dihydrogen orthophosphate and orthophosporic acid was obtained from SD Fine Chemicals Ltd., Mumbai, India. The double distillation and purification with Milli-Q water purification system of purified water helped to prepare HPLC grade water.
Instrumentation
The analysis was performed by using Waters 2695 series HPLC comprised of vacuum degas, auto injector, and dual gradient pump with photo diode array detector and Empower 2 software.
Chromatographic Conditions
The drug samples were analysed with Zorbax C18, (150 x 4.6 mm, 5 µm) column as stationary phase and was maintained at 300 C. The mobile
phase used was a mixture of potassium dihydrogen orthophosphate buffer and acetonitrile in the ratio 65:35 v/v. The flow rate of the mobile was 1.0 ml/min and sample injection volume 10 µl. The detection of the effluents was carried out at 265 nm with PDA detector. Samples of Prazosin and Polythiazide were prepared using water and acetonitrile diluents in 50:50 ratios.
Preparation of mobile phase
Preparation of buffer was accomplished by transferring 1.36 g of potassium dihydrogen orthophosphate in about 1000 ml reagent bottle and made up the volume to 1 litre with HPLC water and pH was adjusted to 3.0 (± 0.5) with dilute orthophosporic acid. The buffer was filtered through 0.2 µ filter and sonicated for 5 min. Mobile phase was prepared from 650 ml of 0.01 M potassium dihydrogen orthophosphate buffer (pH 3 ± 0.5) and 350 ml of HPLC grade acetonitrile mixed well and sonicated for 5 min.
Preparation of stock and working solutions of analytes and internal standard
Primary stock solutions of Prazosin, Polythiazide and Internal standard (Hydrochlorothiazide) were prepared individually by dissolving accurately weighed compounds in acetonitrile-water (50:50, v/v) to give a concentration of 0.1 mg/ml, 0.2 mg/ml and 1.0 mg/ml, respectively. Working solutions of analytes over the desired concentration range were prepared by further dilution of these stock solutions with acetonitrile-water (50:50, v/v). A combined internal standard working solution was prepared in same diluent for analysis at a concentration 450 ng/ml. All stock and working solutions were stored at –20ºC. Polypropylene
vials were used to store the solutions at - 20ºC
and brought to room temperature before use.
Preparation of calibration standards and quality control samples
concentrations of 5-500 ng/ml for Prazosin, 2.5-250 ng/ml for Polythiazide. In the same way quality control (QC) samples were prepared at five levels, 500.0/250.0 ng/ml (ULOQ, upper lower limit of quantification quality control) 400.0/200.0 ng/ml (HQC, high quality control), 300.0/150.0 ng/ml (MQC-2, medium quality control), 250.0/125 ng/ml (MQC-1, medium quality control), 100.0/50.0 ng/ml (LQC-2, low quality control), 15.0/7.5 ng/ml (LQC-1, low quality control), 5.0/2.5 ng/ml (LLOQ-QC, lower limit of quantification quality control), for Prazosin and Polythiazide, respectively.
Sample preparation
An aliquot of 500 µl of human plasma sample was spiked with 450 µl of internal standard, 0.05 µl of Prazosin and 0.05 µl of Polythiazide working standard solutions into 10 ml centrifuge tube then,1000 µl of acetonitrile was added to precipitate the protein by vortex mixing for 2 min. The plasma sample was subjected to centrifugation at 3200 rpm for 5 min. After centrifugation, 10 μl of the supernatant layer was collected and injected into the chromatographic system for the analysis.
Method validation
The analytical method was validated for the fundamental validation parameters following the US-FDA guidelines for the bioanalytical method validation35.
System suitability test
The system suitability test was performed before analysis of every batch of sample to ensure the reproducibility of the chromatographic system. The HPLC system suitability test was performed by running six injections of diluted drugs and ISTD in the linear region of the calibration curve and measuring the percentage coefficient of variance (% CV).
Specificity and Selectivity
The specificity was verified by analysing six different batches of blank human plasma so as to ensure that no endogenous substances interfere with analytes and internal standard existed in plasma. The selectivity of the method was demonstrated by comparing chromatograms obtained from blank plasma and spiked plasma.
Matrix effect
Matrix effect was assessed with six different lots of chromatographically screened plasma sample. Three replicate samples each of LQC and HQC were prepared from different lots of plasma (total thirty six quality control samples).
Calibration and linearity
The linearity of the method was established from the standard calibration curve constructed at eight concentrations (non-zero standards) ranges from 5-500 ng/ml and 2.5-250 ng/ml for Prazosin and Polythiazide respectively. The peak area of each concentration was recorded and then plotted against the corresponding concentration to obtain the calibration graph. In addition, a blank and zero samples were prepared to conform the absence of direct interferences. The working standards were prepared by adding different concentrations of Prazosin and Polythiazide fixed concentration of internal standard (450 ng/ml) solutions spiked in plasma to obtain the required concentration range. Samples were extracted and injected into the HPLC system. The drug/IS peak area ratio was plotted against the concentration of the drug and expressed in terms of coefficient of variance (CV).
Sensitivity (LLOQ)
The sensitivity of the method was determined by analysing six replicates of plasma samples spiked with the lowest level of the calibration curve concentrations (LLOQ-QC, lower limit of quantification quality control) of Prazosin and Polythiazide, respectively.
Precision and accuracy
Intra-day, inter-day precision, and accuracy were determined by analysing six replicates at four different quality control levels (LLOQ, LQC, MQC and HQC) on three different days. Concentrations covering the low, medium and higher range of the calibrations curve. Intra-day variation of the assay was done by injecting six samples for each concentration on the same day. Inter-day variation was assessed by injecting six sample of each concentration over a period of three days. The precision of the method is expressed in terms of percentage coefficient of variance (% CV) and accuracy was expressed as a percentage of the theoretical concentration (observed concentration / theoretical concentration × 100)36.
Recovery
Stability
Stability studies were performed as zero hours, long term at -28ºC and long term at -80ºC. Day zero having two samples with six replicates of HQC and LQC levels. LT at -28ºC and LT at -80ºC have HQC and LQC level with % Stability finding by comparison sample and stability sample.
RESULTS AND DISCUSSION
In the present study, Acetonitrile was the solvent of choice, in order to obtain satisfactory values for recovery of Prazosin and Polythiazide which showed good resolutions with no interferences peak. Hence, extraction with Acetonitrile was optimized as the sample treatment procedure37. The mobile phase was
optimized to provide sufficient selectivity towards the drugs. Potassium dihydrogen orthophosphate buffer contribute high sensitivity and selectivity when compared with other buffers. The optimized mobile phase consisted acetonitrile and potassium dihydrogen orthophosphate buffer in ratio of 35:65 v/v. Injection volume was optimized to 10 μl. The column temperature was maintained at 30°C (ambient). Retention times were 6.589 ± 0.05 min for Prazosin, 5.214 ± 0.05 min for Polythiazide and 3.579 ± 0.05 min for Hydrochlorothiazide (ISTD).
System Suitability Test
System suitability test was done by MQC level sample as six homogenous injections and calculated the % CV for retention time and peak areas and number of peak area ratios of analytes and internal standard. The values obtained are listed in Table 1. The % CV calculated for the method was found to be less than 2%, which revealed the suitability of the developed method and the optimized chromatographic conditions. These values met the requirements of USP24/ NF1938 and were therefore found to be
satisfactory.
Specificity and Selectivity
Representative chromatogram of blank plasma confirmed there is no significant interference from the endogenous component as shown in Fig. 4. Chromatogram of spiked plasma samples of Prazosin and Polythiazide at a concentration of 250.00 ng/ml and 125.00 ng/ml, respectively with the internal standard at a concentration 450.00 ng/ml, conformed that the Prazosin and Polythiazide and internal standard were well resolved and completely separated at retention time of 6.589 ± 0.05 min, 5.214 ± 0.05 min and 3.579 ± 0.05 min, respectively as shown in Fig. 5.
Matrix effect
Matrix effect was assessed with six different lots of chromatographically screened plasma samples of two quality control levels (LQC and HQC). The results obtained were well within the acceptable limits, as the % CV of the area ratios of post spiked recovery samples at LQC were 2.57 and at HQC were 0.43 for Prazosin and at LQC were 5.42 and at HQC were 5.52 for Polythiazide which were within 10%. Hence minor suppression or enhancement of analyte signal due to endogenous matrix interferences did not affect the quantification of analytes and internal standard peak.
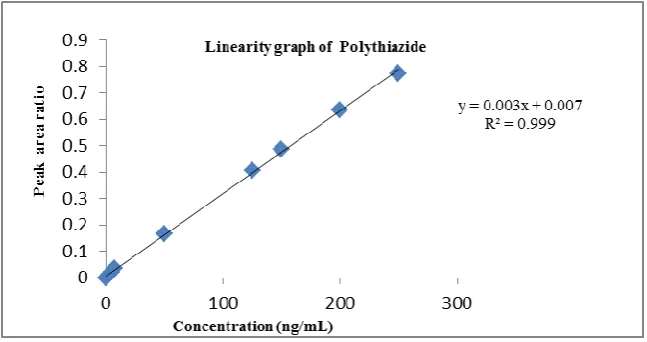
Calibration and linearity
Calibration curves of Prazosin and Polythiazide in human plasma demonstrated linearity in the concentration ranges from 5-500 ng/ml and 2.5-250 ng/ml. The method was exhibited excellent linearity for this range. A typical calibration curve of spiked plasma samples with the regression equation and their respective correlation coefficient (R2) for Prazosin and
Polythiazide were shown in Fig. 6 and Fig. 7. The average correlation coefficient was found to be 0.999 for both analytes with goodness of fit; the results were shown in Table 3.
Sensitivity (LLOQ)
The lower limit of quantification was experimentally determined by diluting known concentrations of Prazosin and Polythiazide in human plasma for six replicate determinations. The present assay method offered an LLOQ of 5.0 ng/ml for Prazosin and 2.5 ng/ml for Polythiazide in human plasma. Intra-day precision of the method was found to be 4.53 and 2.34 % CV and accuracy of the method was found to be 100.75 % and 98.85 % for Prazosin and Polythiazide, respectively. The results of sensitivity were listed in Table 3.
Precision and Accuracy
variance (% CV) was found to be less than 15% for both intra and inter day samples over the concentration range assayed.
Recovery
The recovery for the Prazosin, Polythiazide and internal standard were determined by spiking known quantitative of analytes and ISTD into drug free human plasma to obtain three different concentrations covering the low, medium and higher ranges of the calibration curve. The samples were then extracted and analyzed as described earlier. The recovery was calculated by comparing the peak areas of the drugs with those obtained from pure standards in mobile phase and ISTD in mobile phase at the same concentration39. The recovery of Prazosin
and Polythiazide ranges from 88.41 ± 142.90 % to 93.41 ± 2080.95 %, while the absolute recovery for ISTD was 95.08 ± 3622.21%, the results of the study were shown in Table 5.
Stability
Low value percentage difference (<15) between area ratio for stability test samples and fresh QC samples confirm the stability of drug on Zero hours, LT at -28ºC and LT at -80ºC results of LQC, MQC, and HQC were more than 85% which are within acceptance limits. The results of stability study were given in Table 6.
CONCLUSION
The developed RP-HPLC Bioanalytical method is an accurate, specific and simple method for simultaneous determination of Prazosin and Polythiazide. The method involves simple extraction procedure, separation on a reversed phase column with an internal standard and PDA detector. The validation data demonstrated good precision and accuracy, which proves the reliability of proposed method. Thus the method suits for routine therapeutic drug monitoring (TDM), specializes in the measurement of medication concentrations in blood for Prazosin and Polythiazide. It is also helpful in pharmacogenetic, demographic and clinical information, and/or on the posterior measurement of blood concentrations of drugs (pharmacokinetic monitoring) of Prazosin and Polythiazide in human plasma. The present developed method could be adapted for the determination of bioavailability and bioequivalence required for filing NDA and ANDA.
ACKNOWLEDGEMENTS
The authors are also thankful to Spectrum Pharma Research solutions, Hyderabad, India for providing the pure drugs like Prazosin, Polythiazide and Hydrochlorothiazide.
N N H3CO
H3CO
NH2
N N
O
O
Fig. 1: Chemical Structure of Prazosin
S N H N Cl
S
O O H2N
O O
S CF3
CH3
S NH H N Cl
S
O O
H2N
O O
Fig. 3: Chemical Structure of Hydrochlorothiazide
Fig. 4: A representative chromatogram of human blank plasma
Fig. 5: A representative chromatogram of spiked plasma sample (HQC) of analytes
Fig. 7: Calibration curve of Polythiazide
Table 1: System Suitability data of Prazosin and Polythiazide
Acceptance Criteria: The % CV of the retention time (RT) should be ≤2.00 %. The % CV of the area ratio should be ≤ 5.00%.
Table 2: Sensitivity results of lower limit of quantitation (LLOQ)
Acceptance Criteria: At least 67% (4 out of 6) of samples should be within 80.00-120.00%. %Mean accuracy should be within 80.00-120.00%. % CV accuracy should be ≤ 20.00%. S. No. Prazosin Internal standard
Peak area ratio
Polythiazide Internal standard Peak area ratio Sample
Name (min) RT Peak Area RT (min) Peak Area (min) RT Peak Area (min) RT Peak Area
AQMQC
6.70 213691 3.63 427110 0.5003 5.21 178111 3.55 433590 0.0410 6.62 222502 3.60 432353 0.5146 5.21 177671 3.57 434678 0.4087 6.60 223146 3.63 444696 0.5018 5.23 179992 3.59 433246 0.4154 6.64 219877 3.61 432711 0.5081 5.23 177695 3.60 433832 0.4096 6.61 218796 3.64 451135 0.4850 5.25 177712 3.62 433791 0.4097 6.62 219062 3.64 423901 0.5168 5.27 177522 3.65 431852 0.4111
Mean 6.631 3.625 0.50444 5.234 3.595 0.4108
SD 0.034 0.0143 0.01159 0.0221 0.034 0.0023
% CV 0.52 0.39 2.30 0.42 0.96 0.58
Sample / Parameter
Prazosin Polythiazide Nominal concentration
(5.000 ng/ml) Nominal concentration (2.500 ng/ml) Cal. conc.
(ng/mL) % Nominal conc. Cal. conc. (ng/mL) % Nominal conc. LLOQ-1 4.835 96.7 2.507 100.28 LLOQ-2 4.235 84.7 2.541 101.64 LLOQ-3 4.737 94.74 2.410 96.41 LLOQ-4 5.238 84.76 2.402 96.08 LLOQ-5 5.239 104.78 2.454 98.16 LLOQ-6 4.940 98.8 2.513 100.52 Mean cal. conc. 5.0373 ng/ml 2.4712 ng/ml
SD 0.22831 0.05785
% CV 4.53 2.34
Table 3: Calibration curve (Linearity) data of Prazosin and Polythiazide
Acceptance Criteria: The regression coefficient should be R2 = 0.999.
Table 4: Precision and Accuracy data of Prazosin and Polythiazide
Drugs
Concentration added
(ng/ml) (% Mean ±S.D) Recovery
Intra Day
#
% CV
Accuracy
(%) (%Mean ±S.D) Recovery
Inter Days $
% CV
Accuracy (% )
Prazosin
5.000 4.986 ± 0.139 2.80 99.73 4.986 ± 0.150 3.02 99.73 15.000 15.088± 0.418 2.78 100.19 15.029± 0.430 2.87 100.20 300.000 300.08 ± 0.600 0.2 100.03 300.087 ± 0.609 0.20 100.03 400.000 400.275 ±0.317 0.077 100.07 400.275±0.336 0.08 100.07
Polythiazide
2.500 2.545± 0.093 3.68 101.82 2.5457 ±0.090 3.54 101.83 7.500 7.558 ± 0.173 2.32 100.77 7.5582±0.24014 3.18 100.78 125.000 124.65 ± 2.082 0.79 99.72 124.65 ± 2.758 2.21 99.72 200.000 202.92 ±3.612 1.78 101.46 202.92 ± 3.698 1.82 101.46 # Mean values represent six different plasma samples for each concentration. $Interday was determined from nine different runs
over two-week period. The concentration of each run was determined from a single calibration curve run on the first day of the study.
Acceptance Criteria: The within and between batch precision for LQC, MQC and HQC samples should be ≤15.00% and for the LLOQ QC, It should be ≤20.00%.
Table 5: Recovery study data of Prazosin, Polythiazide and internal standard drugs from human plasma
Drugs Concentration added (ng/ml) (% Mean ± S.D) Recovery % CV Overall % CV
Prazosin
15.000 92.29 ± 22474 1.23
1.37 250.000 90.12 ± 25.35 0.01
400.000 92.2 ± 3890.24 1.16
Polythiazide
7.500 88.41 ± 142.90 0.95
2.98 125.000 89.17 ± 2405.93 1.37
150.000 93.41 ± 2080.95 0.74
Internal Standard 450.000 95.08 ± 3622.21 0.81 - Acceptance Criteria: The % CV of recovery at each QC level and for ISTD should be ≤ 15.00%. The overall mean recovery %CV for all QC levels should be ≤ 20.00%.
Table 6: Stability study data of Prazosin and Polythiazide
Prazosin Polythiazide
Sample concentration Nominal (ng/ml)
Mean calculated conc. ± S.D
(ng/ml)(n=6) %CV
% Mean accuracy
Nominal concentration
(ng/ml)
Mean calculated conc. ± S.D
(ng/ml) (n=6) % CV
% Mean accuracy Stability at day Zero
HQC 400.00 400.525±1.2718 0.32 100.13 200.00 199.980±0.027 2.39 99.99 LQC 15.00 0.1518±0.00403 2.66 101.17 7.500 7.4257±0.265 3.58 99.01
Long term at -28ºC
HQC 400.00 3.99.856 ±1.315 0.33 99.96 200.00 200.120 ±3.152 1.58 100.06 LQC 15.00 14.8717±0.380 2.56 99.14 7.500 7.446 ± 0.256 3.44 99.28
Long term at -80ºC
HQC 400.00 400.355 ±1.155 0.29 100.09 200.00 100.25 ± 4.305 2.13 101.25 LQC 15.00 15.136 ±0.256 1.69 100.91 7.500 7.443± 0.265 3.57 99.24
Acceptance Criteria: At least 67% (8 out of 12) of total QC samples and 50% (3 out of 6) at each level should be within 85.00 - 115.00%. The % Mean accuracy of LQC and HQC should be within 85.00-115.00%. The % CV of LQC and HQC samples should be ≤ 15.00%.
Nominal concentrations
(ng/ml )
Prazosin Nominal concentrations
(ng/ml )
Polythiazide
*Mean % CV accuracy % Mean *Mean % CV accuracy % Mean
5.000 5.103 4.82 102.07 2.500 2.580 3.85 103.23 10.000 10.160 2.31 101.60 5.000 5.034 3.18 100.69 15.000 14.306 2.27 95.38 7.500 7.462 1.49 99.50 100.000 100.243 0.53 100.24 50.000 50.709 3.96 101.42 250.000 250.610 0.26 100.24 125.000 120.883 2.14 96.71 300.000 300.386 0.13 100.13 150.000 151.644 2.43 101.10 400.000 399.923 0.16 99.98 200.000 198.331 2.32 99.17 500.000 500.016 0.09 100.00 250.000 256.677 2.18 102.67
REFERENCES
1. Guidance for Industry-Bio analytical Method Validation, U.S. Department of Health and Human Services, USFDA. 2018;1-40.
2. Sweetman SC Martindale: The Complete Drug Reference, (33th edition). Pharmaceutical Press, London & Chicago. 2002.
3. https://www.drugs.com/pro/minizide. html.
4. [Online] available: http://www.drugs.com/pro/prazosin.h tml.
5.
www.wikipedia.org/wiki/Prazosin
. 6. Indian Pharmacopoeia, Volume III,2014, Ministry of Health and family welfare, Indian Pharmacopoeia Commission, Ghaziabad. 2536-2537. 7. British Pharmacopoeia, Volume I, the
stationary office, London. 1988;457-458.
8. USP29–NF24, United States Pharmacopoeial Convention, Rockville. USA. 1379-1380.
9. www.wikipedia.org/wiki/Polythiazide. 10. https://www.drugbank.ca/drugs/DB00
999.
11. British Pharmacopoeia, Volume I, the stationary office, London. 1988;451-988.
12. Applied Pharmacology. The Kidneys, Ch. 310. Classification of Diuretics, W.B. Saunders Company, Philadelphia; Toronto. 1976; 587-589.
13. Physicians' Desk Reference (PDR), HydroDiuril (hydrochlorothiazide, MSD) USP. 1977;1090.
14. https://www.drugs.com/pro/minizide. html.
15. Biljana P, Miroslava I, Gordana T and Bogdan B. Simultaneous determination of Polythiazide and Prazosin in tablets by second-order derivative UV spectroscopy. Int J Pharm. 1991;70:187-190.
16. Zarapkar SS, Bapat RK and Halker UP. A simple extractive colorimetric determination of Prazosin hydrochloride from pharmaceutical preparation. India Drugs. 1993;30:279-283.
17. Arranz A, de Betono SF, Echevarria C, Moreda JM and Cid A. Voltammetric and Spectrophotometric techniques for the determination of the antihypertensive drug Prazosin in urine and formulations. J Pharm Biomed Anal. 1999;21:797-807.
18. Shabana Naz Shah. Development and validation of simple UV-Spectrophotometric method for quantification of Prazosin in API and solid dosage formulation. Innovational Journal of Quality Assurance and Pharma Analysis. 2015;1(1):110-114. 19. Agatonovic-Kustrin S and Zivanovic LJ.
Spectrophotometric study of Polythiazide—Palladium (II) complies. Journal of Pharmaceutical and Biomedical Analysis. 1989;7(12):1559-1564.
20. Bakshi M, Ojha T and Singh S. Validated specific HPLC methods for determination of Prazosin, Terazosin and Doxazosin in the presence of degradation products formed under ICH-recommended stress conditions. J Pharm Biomed Anal. 2004;34:19-26. 21. Niazy EM, El-Sayed YM and Khidr SH.
Analysis of Prazosin in plasma by high-performance liquid chromatography using fluorescence detection. Journal of liquid chromatography. 1995;18(5):977-987.
22. Shrivastava A and Gupta VB. Simultaneous determination of two alpha-one adrenoreceptor blockers Terazosin and Prazosin using Tamsulosin as internal standard. Inter J Pharm Pharma Sci. 2012; 4(3):752-756. 23. Shrivastava A and Gupta VB. Stability-Indicating RPHPLC Method for the Simultaneous Determination of Prazosin, Terazosin, and Doxazosin in Pharmaceutical Formulations Sci Pharm. 2012;80(3):619–631.
24.
Moskalyk
RE,Locock
RA,Chatten
LG,Moniqu
LG
and
Bielech
F. Determination of Polythiazide in pharmaceutical dosage forms by high‐pressure liquid chromatography. Journal of pharmaceutical sciences. 1975;1406-1408.25. Cohen DM and Munnelly KP. High‐pressure liquid chromatographic determination of Polythiazide in pharmaceutical dosage forms, Journal of Pharmaceutical Sciences. 2006;65(9):1413-1414.
26. Wong CK, Tsau DYJ, Cohen DM and Munnelly KP. High‐pressure liquid chromatography analysis of Polythiazide in pharmaceutical tablet formulations, Journal of Pharmaceutical Sciences. 2006;66(5): 736-738.
Prazosin in Human Plasma and Its Application to Single-dose Pharmacokinetics. J Appl Pharm. 2005;13: 90.
28. Sultana N, Arayne MS and Shah SN. Liquid chromatographic analysis of Prazosin in API, dosage form and serum: Application to drug metal interaction studies. J Chromatograph Separate technique. 2013; 4: 197. doi:10.4172/2157-7064.1000197. 29. Rathinavelu A and Malave A.
High-performance liquid chromatography using electrochemical detection for the determination of Prazosin in biological samples. J Chromatogr B Biomed Appl. 1995; 670: 177-182.
30. Fletcher AJ, Addison RS, Mortimer RH and Cannell GR. Rapid Determination of Prazosin in Perfusion Media by HPLC with Solid Phase Extraction. Journal of Liquid Chromatography. 1995;18(14): 2911-2923.
31. Ramakrishna B, Supriya P, Venkata Lakshmi V and Naidu NVS. RP-HPLC method development and validation for the simultaneous estimation of Prazosin and Polythiazide in bulk and tablet dosage form. International Journal of Current Research. 2018;10(3):66228-66235.
32. William J Bachman. High performance liquid chromatographic determination of Diuretic-Antihypertensive Combination Products. I. Prazosin and Polythiazide. 2006;1033-1049.
33. Dokladalova J, Coco SJ, Lemke PR, Quercia GT and Korst JJ. Determination of Polythiazide and Prazosin in human plasma by high-performance liquid chromatography. Chromatograph. 1981; 224(1):33-41.
34. Erve JC, Vashishtha SC, De Maio W and Talaat RE. Metabolism of Prazosin in rat, dog, and human liver microsomes and cryo preserved rat and human hepatocytes and characterization of metabolites by liquid chromatography/ tandem mass spectrometry. Drug Metab Dispos. 2007;35:908-916.
35. Guidance for Industry-Bio analytical Method Validation, U.S. Department of Health and Human Services, USFDA. 2018;1-40.
36. EMA: Guideline on bioanalytical method validation,
EMEA/CHMP/EWP/192217/2009, Committee for Medicinal Products for Human Use. 2011.
37. Patil KM and Bodhankar SL. J Pharma Biomed Anal. 2005;39:181–186. 38. United States Pharmacopoeia (USP
24/NF19), US Pharmacopoeial Convention, USA. 2000.