ANALYZING STUDENT’S PERFORMANCE USING
EDUCATIONAL DATA MINING TECHNIQUES
Ms.R.Subhulakshmi
1, Mrs.V.Sathyabama
2,
Mrs.V.Selvarani
3& Mrs.P.Krishnaveni
41,2,3,4
G.Venkatasamy Naidu Collge(SFC) ,Kovilpatti, Tamilnadu (India)
ABSTRACT
Educational Institutions play vital role for growth and development of nation and young generation. Nowadays educational data mining is one of the emerging trends which contain various approaches and techniques for analyzing, and predicting the future growth of student’s performances. Here one of the highest challenges to improve the educational process by enhancing the student’s performance in their academic .In this paper ,educational data mining give some guidelines and prediction to find out the future outcomes of students performances using data sets of students. This system designed by using J48 and REP Tree algorithm which proved to be an efficient algorithm and shows accurate results and also acts as one of the tools for predicting the student’s performances.
Keywords:
Educational Data Mining, Student’s Performances, Tools, Algorithms.
I
INTRODUCTION
The term data mining is frequently used to designate the process of extracting useful information from large databases. Data mining consists of processing large volumes of data about a business's past performance in order to look for patterns that might help predict future performance. It is an intuitive process that allows statistical predictions and creates classifications of data. Most companies already collect and refine massive quantities of data. The knowledge must be new, not obvious, and one must be able to use it. Data collection and storage technology has made it possible for organizations to accumulate huge amounts of data at lower cost. Exploiting this stored data, in order to extract useful and actionable information, is the overall goal of the generic activity termed as data mining.
In this view, the term knowledge discovery in databases (KDD) is used to denote the process of extracting useful knowledge from large data sets. Data mining, by contrast, refers to one particular step in this process. Spherically, the data mining step applies so called data mining techniques to extract patterns from the data. Additionally, it is preceded and followed by other KDD steps, which ensure that the extracted patterns actually correspond to useful knowledge. Indeed, without these additional KDD steps, there is a high risk of finding meaningless or uninteresting patterns [7], [8].
involving numerous steps with many decisions being made by the user [14]. Developing an understanding of the application domain, the relevant background knowledge, Data integration and selection: integration of multiple data sources are the selection of the subset of data that is relevant to the analysis task, application of specific algorithms for extracting patterns from data, Pattern evaluation: interpretation and validation of the discovered patterns are the main activity elements of data mining. That is, to guarantee that actual knowledge is being discovered and Knowledge representation: documenting and using the discovered knowledge are the broad outline of the KDD process.
There are three tiers in the tight-coupling data mining architecture: Data layer can be database and/or data warehouse systems. This layer is an interface for all data sources. Data mining results are stored in data layer so it can be presented to end-user in form of reports or other kind of visualization. Data mining application layer is used to retrieve data from database. Some transformation routine can be performed here to transform data into desired format. Then data is processed using various data mining algorithms. Front-end layer provides intuitive and friendly user interface for end-user to interact with data mining system. Data mining result presented in visualization form to the user in the front-end layer. The tight coupling architectural view of the Data Mining is given in Figure.1. [20]
II
DATA
MINING
TASK
The main tasks well-suited for data mining is all of which involve extracting meaningful new information from the data. Knowledge discovery (learning from data) comes in two flavors: directed (supervised) and undirected (unsupervised) learning from data. The six main activities of data mining are: classification (examining the feature of a newly presented object and assigning it to one of a predefined set of classes); estimation (given some input data, coming up with a value for some unknown continuous variable such as income, height, or credit-card balance); prediction (the same as classification and estimation except that the records are classified according to some predicted future behavior or estimated future value); affinity grouping or association rules (determine which things go together, also known as dependency modeling,
Figure 1: Architecture of Data mining
one particular variable of interest, such as income or response, in terms of the rest of the available data ("class prediction"). The next three tasks affinity grouping or association rules, clustering, and description and visualization are examples of undirected knowledge discovery (unsupervised learning). Unsupervised learning attempts to find patterns or similarities among groups of records without the use of a particular target field or collection of predefined classes. This is similar to looking for needles in haystacks.
III
METHODS
AND
MATERIALS
Schwarz et al.,(2012) [18] it was demonstrated that data mining techniques can play an important role in rule refinement even if the sample size is limited. For that at first stage methodology is used for exploring and identifying inconsistencies in the existing rules, rather than generating a completely new set of rules. K-mean algorithm lies in the improved visualization capabilities resulting from the two dimensional map of the cluster. Kohonen developed self organizing maps as a way of automatically detecting strong features in large data sets. Self organizing map finds a mapping from the high dimensional input space to low dimensional feature space, so the clusters that form become visible in this reduced dimension ability.
Brijesh Kumar Baradwaj,et.al,(2014)[4] presents the classification task to evaluate student’s performance. The Decision tree method is used in this work. The information on attendance, class test, seminar and assignment marks were collected from the student database to predict the performance at the end of the semester. It helps to identify the dropouts’ students. Special attention can reduce fuel ration and taking appropriate action for the successive semester examination. The data set from VBS purvanchal university, Jaunpur has been used in this paper. The sampling data set of computer Application department, of course in MCA from 2007 to 2010 was taken for analysis. The sample 50 data set were considered.
Saurabh Pal, et.al,(2011[5] conducted as study on student academic performance of the Dr. R.M.L. Awadh University, Faizabad by selecting 300 (226 males, 74 females) students of BCA course from five colleges in the 2010 examination. The Bayesian Classification method is used to predict the students’ performance to identify the difference between high learners and slow learners student by help the teachers to improve the student performance .
R. R. Kabra, et.al( 2011), [10] conducted a study on student academic performance at S.G.R. Education Foundation’s College of Engineering and Management. The sampling data are taken for first year engineering in the year 2009-10 and 2010-11. The Classification technique and decision tree algorithms are applied to engineering students past performance data and predicted the student’s performance. The confusion matrix is generated and analyzed to identify the students fail records. The accuracy of the model improves their attributes for better performance.
Sonali Agarwal,et.al,(2012) [17] analyzes the student data from a community college database. The dataset has 2000 student details.SVM, LIBSVM, RBF Network, Multilayer Perception, SMO are the 8 different classifiers used in this work. The SVM is the best classifier with maximum accuracy and minimum root mean square error (RMSE).
Dr. A. Padmapriya, et.al,( 2012) [15] given the data for 690 under-graduate students from Government arts college (W), Pudukkottai. This study focused on the development of data mining models for predicting the students higher studies based on their personal, precollege and graduate performance. The comparisons of Decision tree algorithm and Naive Bayesian Classifier algorithm are carefully pre-processed student data and reveal the classification accuracy result.
Azhar Rauf, et.al,( 2012)[3] conducted a survey and the Cluster technique, Enhanced K-mean algorithm is implement the basic K-mean algorithm is compared with Enhanced K-mean clustering algorithm. The Enhanced K-mean Clustering calculates initial centroid points of randomly selected data. The numbers of iterations are reduced and elapsed time is improved.
Mohammed M. Abu Tair, et.al,( 2012) [13] used the data set from the college of Science and Technology in Khanyounis for fifteen year period of 1993-2007. 3360 graduate student sample records are used. The preprocess data is applied for various techniques like association, classification, clustering and outlier detection rules. This research paper study improves the performances of graduate students.
MrinalPandey, et.al,(2013) [14] conducted a study on student academic performance of Manav Rachna College of engineering district Faridabad of Haryana, are considered of 524 student data records. In this study, Classification task are decision tree to predict performance of students, particularly for engineering branches of BTech student data base. The cross validation method is used to evaluate efficiency of the different algorithm. This model helps to the management to identify the weak students to prevent them failure.
Swasti Singhal, et.al,(2013) [18]conducted a study on student academic performance, the raw dataset was collected. This research work uses the techniques of preprocessing, Classification and Clustering to improve student performance.
Leila Dadkhahan, et.al,(2013) [12] conducted a survey on the data set of American College Testing (ACT). The University of Kentucky reported statistics for first-year full-time students’ performance over six year course. Classification and prediction are the interesting techniques used to apply the models to identify student at risks to predict their academic performance. As a result, students’ academic performance improved and leaded to increase student retention and graduation rate for institutions.
Ajay Kumar Pal, et.al,( 2013) [2] uses the data from different degree colleges and institutions in Dr. R. M. L. Awadh University, Faizabad. The data set used from the different colleges on the sampling course for Bachelors of Science in 2011-12. Initially the size of data is 200.Various classification techniques are applied in decision tree, nearest neighbor and neural network. Accurate predictive performance on the student record is to identify the students who needed special attention .
M. Durairaj, et.al,( 2014) [6] presents the data set of 300 student records, and then chosen sample of 38 data used it. Classifications methods compare and predict the pass percentage and fail percentage and absent details have produced an accurate measure in the confusion matrix method used for WEKA tool implementation.
Seaman,et.al,( 2014) [19] Collected the information about admission details and personal details. The clustering techniques are used to compare the data for k-mean, and OPTICS and Classification techniques, comparisons are Bays net, naive net and decision tree.
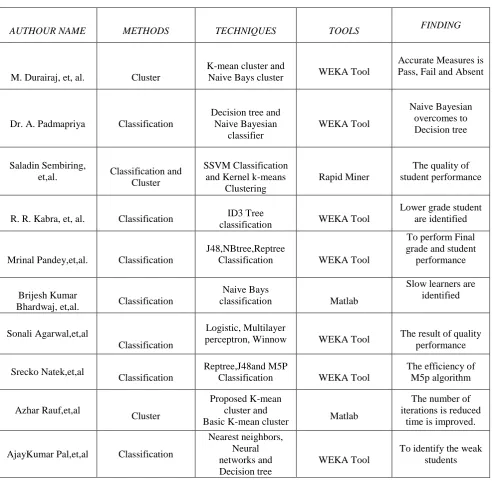
Abeer Badr El Din Ahmed,et.al,(2014) [1]conducted a study on the student performance by selecting a sample of 300 students (225 males, 75 females) from a group of colleges affiliated to Punjab university of Pakistan. The hypothesis that was stated as Student's attitude towards attendance in class, hours spent in study on daily basis after college, students' family income, students' mother's age and mother's education are significantly related with student performance" was framed. By means of simple linear regression analysis, it was found that the factors like mother’s education and student’s family income were highly interconnected with the student academic performance. Table 1: Comparison of literature survey for Data mining Research Trends in various techniques and tools, Challenges to find the most problem to analysis .
Data mining in education
: Educational data mining (EDM) is an area that uses statistical techniques, machine learning and data mining to analyze educational data. Thanks to the use of these techniques, it is possible to improve the teaching/learning processes involving students and instructors Educational data are complex and come in many different formats, which require the use of special data interpretation and processing techniques. Data mining has proved to be very useful in this context. Juan A. Lara et.al [9]. Proposes the use of knowledge discovery in databases (KDD) to extract knowledge that teachers are likely to find useful by analyzing data generated by the interaction of students with e-learning environments, like Modal for example. To do this, the proposal is able to build historical reference models of students that dropped out of and students that completed the course. These generated models can be used to classify a specific student within the dropout or non- dropout group. The proposal has been evaluated on real academic data for students enrolled in several courses. The system then analyses the participative data of each student in the virtual classroom, which it compares with each of the generated reference models. The proposed knowledge discovery system classifies students analyzing the temporal information that reflects the time at which patterns emerge. The use of this temporal information is one of the novelties that the proposed system includes compared with other proposals that propose classification techniques based on non-temporal data, thereby omitting a large amount of useful information [9].IV
EDUCATIONAL
DATA
MINING
ALGORITHM
AND
TECHNIQUES
A. Classification
learning and classification. In Learning the training data are analyzed by classification algorithm. In classification test data are used to estimate the accuracy of the classification rules. If the accuracy is acceptable the rules can be applied to the new data tuples. The classifier-training algorithm uses these pre-classified examples to determine the set of parameters required for proper discrimination. The algorithm then encodes these parameters into a model called a classifier.
B. Clustering
Clustering can be said as identification of similar classes of objects. By using clustering techniques we can further identify dense and sparse regions in object space and can discover overall distribution pattern and correlations among data attributes. Classification approach can also be used for effective means of distinguishing groups or classes of object but it becomes costly so clustering can be used as preprocessing approach for attribute subset selection and classification.
C. Predication
Regression technique can be adapted for predication. Regression analysis can be used to model the relationship between one or more independent variables and dependent variables. In data mining independent variables are attributes already known and response variables are what we want to predict. Unfortunately, many real-world problems are not simply prediction. Therefore, more complex techniques (e.g., logistic regression, decision trees, or neural nets) may be necessary to forecast future values. The same model types can often be used for both regression and classification. For example, the CART (Classification and Regression Trees) decision tree algorithm can be used to build both classification trees (to classify categorical response variables) and regression trees (to forecast continuous response variables). Neural networks too can create both classification and regression models.
D. Association rule
21 | P a g e Table 1: Data mining Research Trends in various techniques and tools, Challenges to find the most
problem to analysis
E. Decision Trees
Decision tree is tree-shaped structures that represent sets of decisions. These decisions generate rules for the classification of a dataset. Specific decision tree methods include Classification and Regression Trees (CART) and Chi Square Automatic Interaction Detection (CHAID).
V
EXPERIMENTAL
WORK
In Educational Data mining system, Students performance was analyzed by their academic details such as Attendance, 10th, 12th and semester marks which predict the student’s performance for future growth.
AUTHOUR NAME METHODS TECHNIQUES TOOLS FINDING
M. Durairaj, et, al. Cluster
K-mean cluster and
Naive Bays cluster WEKA Tool
Accurate Measures is Pass, Fail and Absent
Dr. A. Padmapriya Classification
Decision tree and Naive Bayesian classifier WEKA Tool Naive Bayesian overcomes to Decision tree Saladin Sembiring,
et,al. Classification and Cluster
SSVM Classification and Kernel k-means
Clustering
Rapid Miner
The quality of student performance
R. R. Kabra, et, al. Classification ID3 Tree
classification WEKA Tool
Lower grade student are identified
Mrinal Pandey,et,al. Classification
J48,NBtree,Reptree
Classification WEKA Tool
To perform Final grade and student
performance
Brijesh Kumar
Bhardwaj, et,al. Classification
Naive Bays
classification Matlab
Slow learners are identified
Sonali Agarwal,et,al
Classification
Logistic, Multilayer
perceptron, Winnow WEKA Tool The result of quality performance
Srecko Natek,et,al
Classification
Reptree,J48and M5P
Classification WEKA Tool
The efficiency of M5p algorithm
Azhar Rauf,et,al
Cluster
Proposed K-mean cluster and
Basic K-mean cluster Matlab
The number of iterations is reduced
time is improved.
AjayKumar Pal,et,al Classification
Nearest neighbors, Neural networks and Decision tree
WEKA Tool
A.
Data Preparations
The data set used in this study was obtained from G.Venkatasamy Naidu College, Kovilpatti (Tamil Nadu) on the sampling method of Information Technology department of Information Technology from session 2013 to 2016. Initially size of the data is 100. Among the dataset around 50 are been used as training dataset and 50 datasets as test data to design student model.
B.
Data Selection and Transformation
In this section the data required for educational data mining are selected. A few fields were selected. From the available database, some of the information for the fields is collected. The data collected from Feedback forms and database .initially attribute selection is done. In this step only those fields were selected which were required for data mining. The process of attribute selection deals with selecting the most appropriate attributes for classifying the data sets. By the analysis among the 12 attributes, attributes of higher ranking are used for classifying the training dataset.
Figure 2: Collection of datasets
C.
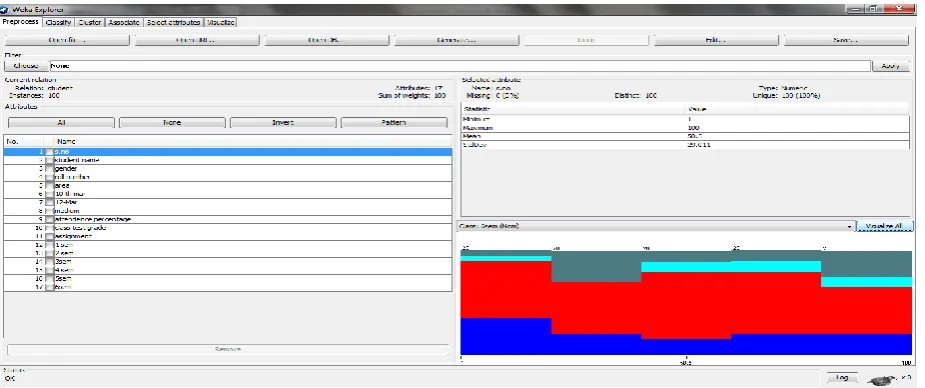
WEKA Tool Preprocessor
23 | P a g e
Figure 3: WEKA Page
The preprocessed data set is shown in Figure 4 Student roll number, department, course studying, marks and other related, in total 100 attributes are preprocessed for this study and analysis work. The result shows based on the instance of the attributes. The attributes in this database are displayed in the row format and the bar graph represents the distributions of the different attributes that are considered for data mining. All the attributes are preprocessed and visualized in the screen.
Figure 4: Preprocess using WEKA Tool
D.
Decision Tree Algorithm
classified for J48 Tree and REP Tree algorithm performed for J48 Tree algorithm is better than best accuracy of REP Tree algorithm.
Figure 5.A: J48 Tree Classified Rule Figure 5.B:J48 pruned Tree
The pruned Tree constructed from the classifier output of the tool is shown in Figure 5.B. The tree is constructed based on different 16 nodes based on the classifier output. The student performances in Under Graduation are analyzed based on SSLC and Higher secondary mark scores. From the tree it is under stands that only 3 attributes are required to create the tree, which means the rest six attributes (Grade) are not used to classify the dataset.
Figure 6.A: REP Tree Classified Rule Figure 6.B: REP Tree Classifier output
VI CONCLUSION
25 | P a g e institutions to improve the student’s carrier for future and also give the details about the student’s performance for the next semester examination.
REFERENCES
[1] Abeer Badr El Din Ahmed, Ibrahim Sayed Elaraby,” Data Mining: A prediction for Student's Performance Using Classification Method”, World Journal of Computer Application and Technology 2(2): 43-47, 2014. [2] Ajay Kumar Pal, Saurabh Pal,” Data Mining Techniques in EDM for Predicting the Performance of Students”, International Journal of Computer and Information Technology (ISSN: 2279 – 0764) Volume 02– Issue 06, November 2013.
[3] Azhar Rauf, Sheeba, Saeed Mahfooz, Shah Khusro and Huma Javed,” Enhanced K-Mean Clustering Algorithm to Reduce Number of Iterations and Time Complexity”, Middle-East Journal of Scientific Research 12 (7): 959-963, 2012.
[4] Brijesh Kumar Baradwaj, Saurabh Pal,” Mining Educational Data to Analyze Students‟ Performance”, (IJACSA) International Journal of Advanced Computer Science and Applications, Vol. 2, No. 6, 2011 [5] Brijesh Kumar Bhardwaj, Saurabh Pal,” Data Mining: A prediction for performance improvement using
classification”, (IJCSIS) International Journal of Computer Science and Information Security,Vol. 9, No. 4, April 2011.
[6] M. Durairaj, C. Vijitha,” Educational Data mining for Prediction of Student Performance Using Clustering Algorithms”, (IJCSIT) International Journal of Computer Science and Information Technologies, Vol. 5 (4), 2014, 5987-5991.
[7] Fayyad, U. (1998). Mining Databases: Towards Algorithms for Knowledge Discovery. Bulletin of the IEEE Computer Society Technical Committee on Data Engineering, 22(1):39-48.
[8] E.Kesavulu Reddy, V.Naveen Reddy, P.Govinda Rajulu “A Study of Intrusion Detection in Data Mining” Proceedings of the World Congress on Engineering 2011 Vol III WCE 2011, July 6 - 8, 2011, London, U.K.
[9] Juan A. Lara, David Lizcano, María A. Martínez a, Juan Pazos Teresa Riera, “A system for knowledge discovery in e-learning environments within the European Higher Education Area – Application to student data from Open University of Madrid, UDIMA”, Computers & Education 72 (2014) 23–36 ELSEVIER, 2014.
[10] R. R. Kabra, R. S. Bichkar,” Performance Prediction of Engineering Students using Decision Trees”, International Journal of Computer Applications (0975 – 8887) Volume 36– No.11, December 2011. [11] Komal S. Sahedani, Prof. B Supriya Reddy,” A Review: Mining Educational Data to Forecast Failure of
Engineering Students”, International Journal of Advanced Research in Computer Science and Software Engineering Volume 3, Issue 12, December 2013.
[13] Mohammed M. Abu Tair, Alaa M. El-Halees,” Mining Educational Data to Improve Students’ Performance: A Case Study”, International Journal of Information and Communication Technology Research Volume 2 No. 2, February 2012.
[14] Mrinal Pandey, Vivek Kumar Sharma, PhD,” A Decision Tree Algorithm Pertaining to the Student Performance Analysis and Prediction”, International Journal of Computer Applications (0975 – 8887) Volume 61– No.13, January 2013.
[15] Dr. A. Padmapriya,” Prediction of Higher Education Admissibility using Classification Algorithms”, International Journal of Advanced Research in Computer Science and Software Engineering Volume 2, Issue 11, November 2012 ISSN: 2277 128X
[16] Sajadin Sembiring, M. Zarlis, Dedy Hartama, Ramliana S, Elvi Wani,” Prediction of student academic performance by an application of data mining”, International Conference on Management and Artificial Intelligence IPEDR Vol.6 (2011).
[17] Sonali Agarwal, G. N. Pandey, and M. D. Tiwari,” Data Mining in Education: Data Classification and Decision Tree Approach”, International Journal of Education, Business, Management and e-Learning, Vol. 2, No. 2, April 2012.
[18] Swasti Singhal, Monika Jena,” A Study on WEKA Tool for Data Preprocessing, Classification and Clustering”, International Journal of Innovative Technology and Exploring Engineering (IJITEE) ISSN: 2278-3075, Volume-2, Issue-6, May 2013.
[19] Suman, Mrs.Pooja Mittal,” A Comparative Study on Role of Data Mining Techniques in Education: A Review”, International Journal of Emerging Trends & Technology in Computer Science (IJETTCS), Volume 3, Issue 3, May – June 2014.