MULTI OBJECTIVE OPTIMIZATION
OF MICRO-EDM DRILLING ON
MARAGING STEEL BY GENETIC
ALGORITHM
TSRV Padmalatha
Department of Mechanical Engineering, University College of Engineering, Osmania University, Hyderabad, Telangana 500 007, India
T NAGAVENI
Department of Mechanical Engineering, University College of Engineering, Osmania University, Hyderabad, Telangana 500 007, India
*K.Saraswathamma
Department of Mechanical Engineering, University College of Engineering, Osmania University, Hyderabad, Telangana 500 007, India
K. Chandravathi
Mishra Dhathu Nigam Limited (MIDHANI), Hyderabad, Telangana, India [email protected]
ABSTRACT
The Micro-Electrical Discharge Machining, is a nonconventional machining process mainly used for producing micro features like micro holes, micro gears, micro moulds etc. In the present work, detailed study and optimization was carried out through statistical design of experiments to study the effect of machining parameters such as current, Pulse-on-time (Ton) and Pulse-pause-time (Toff) on response variables such as Material Removal Rate (MRR) and geometric error on Maraging steels. The experiments were designed and conducted using Central Composite Rotatable Design (CCRD) from Response surface methodology (RSM). An attempt has been made to develop regression equation for relating the MRR and geometric error with the input parameters. Investigation results indicates that MRR and geometric error increases with an increase in the current and with increase in Ton, MRR increases and geometric error decreases. Multi objective optimization was conducted for maximum MRR and minimum geometric error. Confirmation experiment is performed.
Keywords: MicroEDM; Maraging Steel 250 alloy; Central Composite Design; ANOVA; Multi objective Genetic algorithm.
1. INTRODUCTION
al. 2010). Kuneida et al. (Kunieda, Lauwers et al. 2005) projectedEDM technology by interconnecting current attainments in primary studies on EDM with recently technologically advanced application. Any complex micro
shape can be produced with the application of very little forces, because there is no direct contact between workpiece and electrode. However there are few disadvantages like high tool wear rate which lead to some inaccuracies in micro features. A thin layer of re-solidified molten metal remaining on workpiece surface is also seen. Heat effected zone is formed on machined surface.
Shivraj et al. (Yeole, Nunna et al. 2015) studied about realization of surface morphology and process parameter optimization in Micro EDM Hole Drilling of Maraging Steel 300 Alloy using brass as electrode and Distilled water as dielectric medium by varying machining parameters such as pulse-on-Time, pulse-off-Time, tool diameter and current. They concluded that, MRR, tool wear rate (TWR), and overcut are influenced mainly by pulse-on-time and current. Jesudas et al. (Jesudas and Arunachalam 2011) studied influence of various process parameters in Ed machining hardened steel on MRR using full factorial design and concluded that MRR increases with increase in voltage and capacitance and decreases with increase in spark gap. Mohana et al. (Rao, Satyanarayana et al. 2008) conducted significant study by focusing on yielding optimal EDM performance measures like high metal removal rate, low tool wear rate, and satisfactory surface roughness using the copper tool and Kerosene as dielectric medium. From this study, they concluded that, duty factor, and current were the most significant factors that influences the performance measurers. Average Crack length and recast layer thickness increases with increase in current and duty factor and decreases with Pulse-off-Time. Ayesta et al. (Ayesta, Izquierdo et al. 2013)has studied the influence of EDM parameters on slot machining of high strength materials such as Ni based super alloys C1023 using the Central composite design of experiments and concluded that discharge current and time pulse are the most influencing parameters.
Generally optimization problems have multiple objectives, which are contradictory (for example, optimizing the goal makes other targets are bad). The genetic algorithm (GA) is an evolutionary algorithm that employs genetic operators to get optimal solutions across the search space without assumptions. GA works with a population of viable solutions and can therefore be used in multi-objective optimization to simultaneously capture a range of solutions(Kuriakose and Shunmugam 2005). Several approaches of multi objective optimization on GA have been applied to find Pareto optimal solutions in the last decade and beyond. For the past fifteen years, the Evolutionary multi-objective optimization methodology (EMO) proved to be useful enough to find good convergence and well distributed optimal Pareto solutions (Kakde , Deb, Pratap et al. 2002). Because of these comprehensive studies and source code available both commercially as well as free, the EMO procedures have been popularly applied in various problem solving tasks and have received much attention, including the traditional communities optimization and multi-criterion decision. Non dominant GA order (NSGA-II) is one of the most commonly used to create Pareto frontier. NSGA-II uses elitism and a variety of phenotype operators compared to specify the variety of maintenance without additional parameters (Srinivas and Deb 1994, Deb and Sundar 2006).
Lot of research has been carried on machining of various materials like Die and Tool steels, ceramics, composites, Metal matrix Composite and Titanium Alloys using Electro Discharge machines. But the research survey relating to super alloys and special steels is very less. Very few studies has been found relating to the micro hole drilling of Maraging Steels using electric discharge drilling with tubular copper as electrode. And also limited study was focused on multi objective optimisation of process parameters of micro EDM which yields optimum responses. Hence, this paper investigates the effect of various process parameter combinations on MRR and geometric error in micro EDM drilling of maraging steel 250 using Central Composite Design. Separate ANOVA was carried out, to know the most influencing parameter. And the multi objective optimization is carried out for maximum MRR and minimum geometric error using geometric algorithm.
2. EXPERIMENTATION
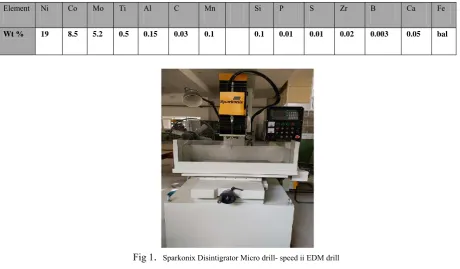
Table 1. Composition of Maraging Steel 250 alloy
Element Ni Co Mo Ti Al C Mn Si P S Zr B Ca Fe
Wt % 19 8.5 5.2 0.5 0.15 0.03 0.1 0.1 0.01 0.01 0.02 0.003 0.05 bal
Fig 1
.
Sparkonix Disintigrator Micro drill- speed ii EDM drillTable 2. Coded levels and actual values of process parameters
Machining
parameters units Levels
-1.682 -1 0 +1 +1.682
Current (A) A 6.6 10 15 20 23.5
Pulse-off-Time (Toff ) (B)
µs 6.3 7 8 9 9.7
Pulse-on-Time (Ton) (C)
µs 6.3 7 8 9 9.7
Output factors and their estimation:
Material removal rate: During the process of material removal in μ-EDM, sparks are produced between the workpiece and tool. Each spark produces a tiny crater along the cutting path by melting and vaporization, thus eroding the work piece to the shape of the tool. Material Removal Rate (MRR) is calculated by considering the weight of the workpiece before and after micro drilling as shown below.
MRR = Wb −Wa (mm3/min) ----(1) t xρ
where,
Wb = Weight of workpiece before machining, gms, Wa = Weight of workpiece after machining, gms t = Machining time, min
ρ = Density of maraging steel MDN 250 alloy = 8.1gm/cm3
Geometric error: Geometric error is the deviation in the dimension of hole formed in Electro Discharge Drilling of Maraging Steels. The geometric error is measured as the Difference between the Diameter of the Hole Formed and the electrode diameter (800 µm).
Geometric Error
=
− 0.8
--- (2)
After machining each work piece the weight was recorded using digital weighing machine ESSAE MODEL-DC-85. The weight difference before and after machining indicates the MRR on workpiece. The corresponding Geometric error was found and recorded by using Tool Makers Microscope, NIKON MEASUROSCOPE MM-11 with NIKON DP-202 data processor at 50x Magnification.
3. RSM Analysis:
To know the significance of regression equation in explaining the relationship between responses and machining parameters, ‘F’ test from the Analysis of Variance (ANOVA) was conducted. The contribution of each parameter of the model, in affecting the improvement in MRR and decrement in geometric error was found out through the sum of squares method. Separate ANOVA was carried out to know the contribution of machining parameters on MRR and geometric error. It gives the main effect of process parameter on response parameters and these analyses help in design a regression equation for MRR which helps on calculating the MRR. Thus the relationship between input and output parameters is obtained through empirical expressions developed by using the output values of MRR. Analysis was carried out using Stat-Ease Design-Expert® software.
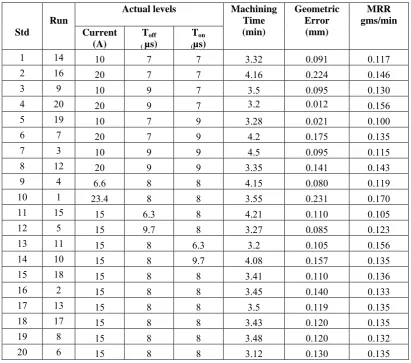
Table 3. Experimental results after machining
Std
Run
Actual levels Machining Time (min)
Geometric Error (mm)
MRR gms/min Current
(A)
Toff ( µs)
Ton (µs)
1 14 10 7 7 3.32 0.091 0.117
2 16 20 7 7 4.16 0.224 0.146
3 9 10 9 7 3.5 0.095 0.130
4 20 20 9 7 3.2 0.012 0.156
5 19 10 7 9 3.28 0.021 0.100
6 7 20 7 9 4.2 0.175 0.135
7 3 10 9 9 4.5 0.095 0.115
8 12 20 9 9 3.35 0.141 0.143
9 4 6.6 8 8 4.15 0.080 0.119
10 1 23.4 8 8 3.55 0.231 0.170
11 15 15 6.3 8 4.21 0.110 0.105
12 5 15 9.7 8 3.27 0.085 0.123
13 11 15 8 6.3 3.2 0.105 0.156
14 10 15 8 9.7 4.08 0.157 0.135
15 18 15 8 8 3.41 0.110 0.136
16 2 15 8 8 3.45 0.140 0.133
17 13 15 8 8 3.5 0.119 0.135
18 17 15 8 8 3.43 0.120 0.135
19 8 15 8 8 3.48 0.120 0.132
20 6 15 8 8 3.12 0.130 0.135
Based on lack of fit test, quadratic model was selected in both the cases of MRR and geometric error. After dropping insignificant model terms, the reduced model of ANOVA for MRR and geometric error is shown in Tables 4 &5 respectively. Value of Prob>F” less than 0.1 indicates model terms are significant. Depending on coefficients calculated, the final regression equations for MRR and geometric error is presented below in terms actual values
= −0.194 − 0.0002 + 0.1342 − 0.056 + 0.001 − 0.008 +
= −.00645 + 0.0421 + 0.106 − 0.146 − 0.006 × +
0.0812 × + 0.0004 − 0.011
--- (4)
Table 4. ANOVA for Geometric error
Source Squares Sum of DOF Square Mean Value F Prob> F p-value Remark Model 0.0399 7 0.0057 17.9262 < 0.0001 significant A-current 0.0233 1 0.0233 73.2351 < 0.0001
B-Pulse-on-Time 0.0007 1 0.0007 2.3094 0.1568 C-Pulse-off-Time 0.0000 1 0.0000 0.0043 0.9491 AB 0.0049 1 0.0049 15.3575 0.0024 BC 0.0021 1 0.0021 6.5752 0.0263 A^2 0.0013 1 0.0013 3.9910 0.0711 B^2 0.0017 1 0.0017 5.4291 0.0399 Residual 0.0035 11 0.0003
Lack of Fit 0.0030 6 0.0005 4.486789 0.0604 not significant Pure Error 0.0005 5 0.0001
Cor Total 0.0434 18
Table 5. ANOVA for Material Removal Rate
Source Squares Sum of DOF Square Mean Value F Prob> F p-value Remark Model 0.0054 6 0.0009 118.8449 < 0.0001 significant A-current 0.0030 1 0.0030 402.3285 < 0.0001
B-Pulse-on-Time 0.0004 1 0.0004 57.4714 < 0.0001 C-Pulse-off-Time 0.0006 1 0.0006 81.4572 < 0.0001 A^2 0.0001 1 0.0001 13.6534 0.0027 B^2 0.0009 1 0.0009 123.5297 < 0.0001 C^2 0.0001 1 0.0001 18.3817 0.0009 Residual 0.0001 13 0.0000
Lack of Fit 0.0001 8 0.0000 4.7448 0.0515 not significant Pure Error 0.0000 5 0.0000
Cor Total 0.0055 19
4. RESULTS AND DISCUSSION
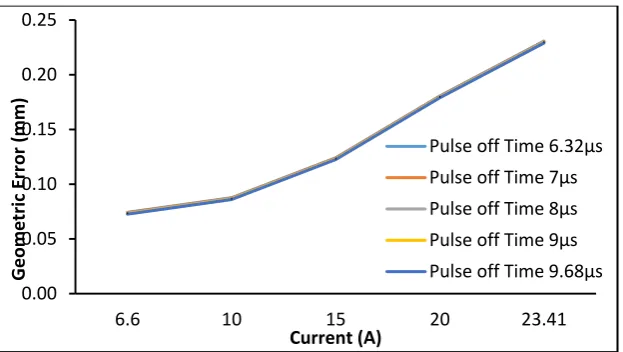
4.1 Effect of current On Material Removal Rate (MRR) and Geometric error:
Fig. 2 Effect of Current on MRR with different Pulse-off-Time at 8 µs Pulse-on-Time
Fig. 3 Effect of current on Geometric error with different Pulse-off-Time at 8 µs Pulse-on-Time
(a)
(c)
0.00 0.20 0.40 0.60 0.80
6.6 10 15 20 23.41
MRR (gms/min)
Current (A)
Pulse off Time 6.32µs Pulse off Time 7µs Pulse off Time 8µs Pulse off Time 9µs Pulse off Time 9.68µs
0.00 0.05 0.10 0.15 0.20 0.25
6.6 10 15 20 23.41
Geometric Error
(mm)
Current (A)
(b)
(d)
Fig.4 Geometry of holes formed at different currents (a) 10A (b) 15A (c) 20A & (d) 23A
4.2 Effect of Pulse-on-Time (Ton) On Material Removal Rate (MRR) and Geometric error
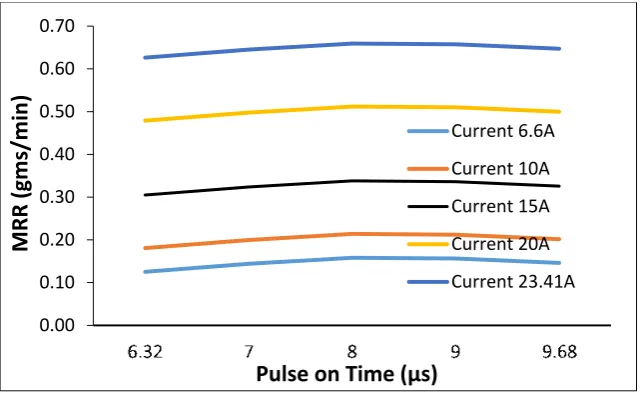
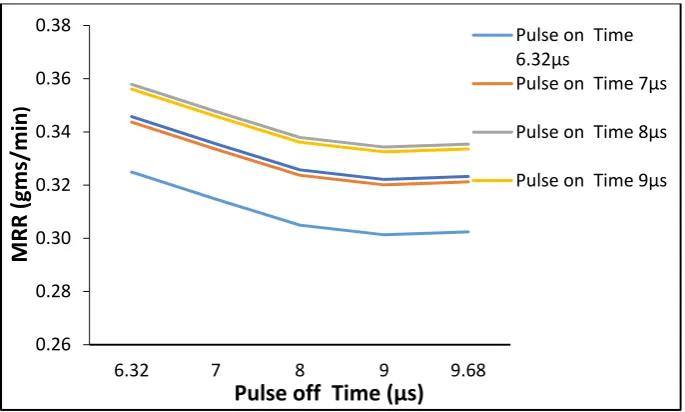
It was observed that from Fig. 5, MRR increases with an increase in Ton at very slower rate. By the increase in pulse on-time, the discharge energy of the plasma channel and the period of transferring of this energy into the electrodes increases. In increasing Ton the spark get more time to contact with the work which results in increase the MRR.
From the ANOVA Table 4 the Pulse-on-Time was the significant factor on Geometric error. By the increase in Pulse-on-Time the Geometric error decreases as the spark gets more time to contact and the hole will be formed properly due to the formation of bigger molten crater.
Fig .5 Effect of Pulse-on-Time on MRR with different currents at Pulse-off-T me 8 µs
0.00 0.10 0.20 0.30 0.40 0.50 0.60 0.70
MRR (gms/min)
Pulse on Time (µs)
Current 6.6A
Current 10A
Current 15A
Current 20A
Fig .6 Effect of Pulse-on-Time on Geometric error with different currents at 8 µs Pulse-off-Ti me at 8 µs
4.3 Effect of Pulse-off-Time (Toff) On Geometric Error and MRR
From the ANOVA Table 4 the Pulse-off-Time was the least significant factor on Geometric error. By the increase in Pulse-off-Time the Geometric error is almost constant at mean values. Geometric error is almost constant with increase in Pulse-off-Time but the interaction Pulse-off-Time with Pulse-on-Time has significant effect on geometric error. With increase in off-Time, geometric error decreases at Pulse-on-Time 6.32µs to 8µs and then with increase in Pulse-Pulse-on-Time from 8µs to 9.68µs, geometric error will increase. Pulses off time (Toff) have significant effect on MRR. On increasing Pulse-off-Time the MRR will decrease as shown in Fig.9. If the increase in off time the spark contact time with work piece decreases so that the MRR will decreases. And MRR is almost constant at higher Pulse-off-Time.
Fig .7 Effect of Pulse-off-Time on Geometric Error with different Pulse-on-Time and Current at 15A
-0.05 0.00 0.05 0.10 0.15 0.20 0.25 0.30 0.35
6.32 7 8 9 9.68
Geometric Error
(mm)
Pulse on Time (µs)
Current 6.6A Current 10A Current 15A Current 20A Current 23.41A
0.00 0.02 0.04 0.06 0.08 0.10 0.12 0.14 0.16 0.18
6.32 7 8 9 9.682
Geometric Err
o
r (mm
)
Pulse off Time (µs)
Pulse on Time 6.32µs
Pulse on Time 7µs
Fig .8 Interaction effects of Pulse-on-Time and Pulse-off-Time on Geometric Error
Fig .9 Effect of Pulse-off-Time on Geometric Error with different Pulse-on-Time and Current at 15A
5. Optimization Study
The aim of this work is to find the optimal combination of input parameters a maximum cutting performance (ie the maximum MRR) and the maximum surface finish (ie minimum surface roughness). It has been found that when the MRR increases, surface finish deteriorates. Because of the inconsistency of the performance measures, only a combination of input parameters does not serve the purpose. Consequently, a set of optimal solutions (ie Pareto optimally solution) instead of an optimal combination can be obtained.
In the present study, the problem of optimization of micro EDM drilling has been framed as a multi-objective optimization problem, since the determination of the optimum machining conditions includes a conflict among maximize MRR and to minimize geometric error. Since the objectives of nature are contradictory, the first objective (MRR) is converted to minimization.
The optimization problem is defined as follows: Objective 1= 1/ (1+MRR)
Objective 2= error
The equations for MRR and geometric error were taken from table 3.
Subject to 10≥ current(x1) ≥20 --- (5) Design-Expert® Software
geo error 0.231
0.0205 X1 = B: Pulse on Time X2 = C: Pulse off time
Coded Factor A: current = 0.000
-1.00 -0.50
0.00 0.50
1.00
-1.00 -0.50 0.00 0.50 1.00 0.085 0.103 0.121 0.139 0.157
ge
o err
o
r
B: Pulse on Time C: Pulse off time
0.26 0.28 0.30 0.32 0.34 0.36 0.38
6.32 7 8 9 9.68
MRR (gms/min
)
Pulse off Time (µs)
Pulse on Time 6.32µs
Pulse on Time 7µs
Pulse on Time 8µs
7≥ pulse on time(x2) ≥9--- (6)
7≥ pulse off time(x3) ≥9--- (7)
Non-dominating sorting Genetic Algorithm (NSGA-II), developed by Deb and Goel in 2002, is the finest method to generate the Pareto frontier, and is used in this study. The NSGA-II algorithm ranks the individuals which are derived from dominance. The fast non dominated sorting procedure allows us to find the limits of non-dominance frontiers, where individuals of the frontier set are not dominated with any solution. The crowding distance is computed for each individual in the new population. Crowding distance factor gives the GA the opportunity to distinguish individuals who are of the same rank. This forces the GA evenly across the border instead of grouped into several positive outcomes that try to maintain the diversity of the population.
MATLAB optimization toolbox (R2013a) was used to create the Pareto front for metal removal rate and geometric error using ‘gamultiobj’ function. '' gamultiobj '' in optimization toolbox uses a set of operators that apply to the entire population set that is considered. The initial population is randomly generated by default. The next generation of the population is calculated to use the non-dominated rank and a crowding distance measurement of individuals in the current generation.
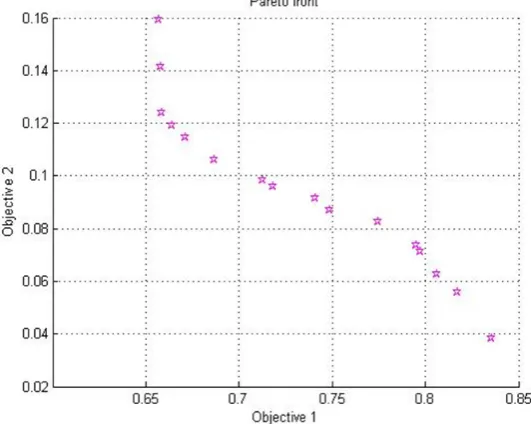
The weighted average of the fitness function for 100 generations was used as a criterion to stop the algorithm. Optimized Pareto front with incompatible responses maximizing metal removal rate and minimizing geometric error are marked along the x-axis and the y-axis, each after 126 repetitions in Figure 10. The input decision variables shown correspond to each of Pareto's optimal solutions are tabulated in table 6. Any point in the Pareto set is related with a set of decision variables.
Particular star marks between these axes represent a non-dominated solution between permissible pareto optimal of all the star points of the Pareto front. For optimal operating conditions for MRO and geometric errors from the Pareto front, the corresponding decision variables were obtained from Table 6. All Pareto solutions were optimal solutions. The population size is 75. The multi objective genetic algorithm uses the tournament selection by size 2, adaptive feasible mutation and scattered crossover.
.
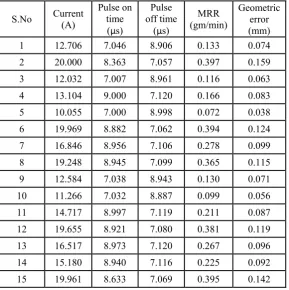
Table .6 Process decision variables corresponding to each of the Paroto optimal solutions
S.No Current (A) Pulse on time (µs)
Pulse off time
(µs)
MRR (gm/min)
Geometric error (mm)
1 12.706 7.046 8.906 0.133 0.074
2 20.000 8.363 7.057 0.397 0.159
3 12.032 7.007 8.961 0.116 0.063
4 13.104 9.000 7.120 0.166 0.083
5 10.055 7.000 8.998 0.072 0.038
6 19.969 8.882 7.062 0.394 0.124
7 16.846 8.956 7.106 0.278 0.099
8 19.248 8.945 7.099 0.365 0.115
9 12.584 7.038 8.943 0.130 0.071
10 11.266 7.032 8.887 0.099 0.056
11 14.717 8.997 7.119 0.211 0.087
12 19.655 8.921 7.080 0.381 0.119
13 16.517 8.973 7.120 0.267 0.096
14 15.180 8.940 7.116 0.225 0.092
15 19.961 8.633 7.069 0.395 0.142
The corresponding objective and decision variable values of this sentence are not dominated solutions are presented in Table 6.The non dominated solution set achieved during the optimization process is shown in Fig. 10. . This shows the formation of the Pareto front leading together of final set of solutions. The resultant objective function values and decision variables of this non-dominated solution set are presented in Table 6. The process engineer can choose optimal combinations of optical parameters from the Pareto solutions as needed. Confirmatory tests were performed under optimum conditions for MRR and geometric errors. Table 7 shows the results of the confirmation result and the prediction error involved. It was found that all the expected results are in accordance with the stated objectives.
Table 7. Results of the Confirmation test
Solution
Current (A)
Toff (µs)
Ton (µs )
MRR (gm/s)
Geometric error (mm)
Predicted 12.706 8.905 7.045 0.133 0.073
Confirmation 12.0 9.0 7.0 0.129 0.075
6. CONCLUSIONS
The influence of current, Pulse on time and pulse off time of EDM on MRR and Geometric error in MicroEDM drilling of maraging steel 250 alloy is studied and analysed. Response surface regression equations were generated using ANOVA and presented as Eqs.3-4. These developed mathematical models for the machining performance characteristics like MRR and geometric error are proposed that aide proper selection of machining parameters in MicroEDM drilling. With this work, it has been confirmed that the technique of design of factorial experiments, combined with techniques of response surface methodology, can be successfully applied to modeling the functions which depend on various variables.
geometric error i.e. to maximise MRR and minimise surface roughness. Confirmation experiment were performed. The confirmation results are in close agreement with the predicted results.
ACKNOWLEDGMENTS
The authors thank MISHRA DHATU NIGAM LIMITED (MIDHANI), GOVERNMENT OF INDIA, Hyderabad for allowing us to use their Micro EDM i.e SPARKONIX DISINTIGRATOR MICRO DRILL- SPEED II machine and Tool Makers Microscope NIKON MEASUROSCOPE MM-11 for carrying out experiments in their laboratories and also for providing maraging steel 250(MDN 250) material.
REFERENCES
[1] Ayesta, I., et al. (2013). "Influence of EDM parameters on slot machining in C1023 aeronautical alloy." Procedia CIRP 6: 129-134.
[2] Bleys, P., et al. (2004). "Sensing and compensation of tool wear in milling EDM." Journal of Materials Processing Technology 149(1):
139-146.
[3] Deb, K., et al. (2002). "A fast and elitist multiobjective genetic algorithm: NSGA-II." IEEE transactions on evolutionary computation
6(2): 182-197.
[4] Deb, K. and J. Sundar (2006). Reference point based multi-objective optimization using evolutionary algorithms. Proceedings of the 8th annual conference on Genetic and evolutionary computation, ACM.
[5] Jesudas, T. and M. Arunachalam (2011). "Study on Influence of Process Parameters in Micro-Electrical Discharge Machining (μ-EDM)." European Journal of Scientific Research 59(1): 115-122.
[6] Kakde, M. R. a. O. "Survey on multiobjective evolutionary and real coded genetic algorithms."
[7] Kunieda, M., et al. (2005). "Advancing EDM through fundamental insight into the process." CIRP Annals-Manufacturing Technology
54(2): 64-87.
[8] Kuriakose, S. and M. Shunmugam (2005). "Multi-objective optimization of wire-electro discharge machining process by non-dominated sorting genetic algorithm." Journal of Materials Processing Technology 170(1): 133-141.
[9] Mahendran, S., et al. (2010). A review of micro-EDM. Proceedings of the international multi conference of engineers and computer scientists.
[10] Masuzawa, T. and H. Tönshoff (1997). "Three-dimensional micromachining by machine tools." CIRP Annals-Manufacturing Technology 46(2): 621-628.
[11] Rao, G. K. M., et al. (2008). Influence of machining parameters on electric discharge machining of maraging steels–An experimental investigation. Proceedings of the world congress on engineering.
[12] Srinivas, N. and K. Deb (1994). "Muiltiobjective optimization using nondominated sorting in genetic algorithms." Evolutionary computation 2(3): 221-248.