*Corresponding author: [email protected]
2011 UTHM Publisher. All right reserved.
23
Optimizing Machining Parameters during Turning Process
Suleiman Abdulkareem
1,*, Usman Jibrin Rumah
1and Apasi Adaokoma
11Department of Mechanical Engineering, College of Engineering, Kaduna Polytechnic, P.M.B. 2021, Polytechnic Road,
Tundun Wada, Kaduna, Nigeria.
Received 21 June 2011; accepted 22 July 2011, available online 21 September 2011
1.
Introduction
Carbon steels are by far the most frequently used industrial steels because of their high production volume, good formability as well as weldability properties. They are used increasingly in most industrial/commercial applications such as in automobile- (body panels; crankshafts; gears; axles) construction industries- (structural steels; hammer; seamless tubes) industrial and machine tools industries- (chains; stampings; pipes; lead screws; rivets; nails; spindles; wrenches; band-saws; shafts and machine parts) [1]. Nevertheless, because of carbon steels wider area of applications coupled with its low cost and availability, machining characteristics of its surface roughness need to be optimized to further increase its area of application as well as achieving high quality products [1-3].
Surface roughness plays an important role in evaluating quality of machined products. The quality of surface is of utmost important for the correct functioning of machine parts which directly affect the attributes of product such as friction, fatigue, wear resistance, coating, reflection and lubricant [4-5]. There are many factors that affect surface roughness of any machined parts, these factors among others includes: machining parameters, tool geometry, workpiece material, nature of chip produced, machine rigidity and cutting fluids used [6- 7]. In other to achieve the specified roughness, a trade-off between the factors that affect the surface roughness is always made. This paper focuses on the machining factors of feed rate, spindle speed and cutting speed.
A number of authors have researched into surface roughness with respect to machining parameters. These literatures are referenced in [8-13]. In this study, the design and the analysis have been carried using Design-Expert version 8.0.4. The investigations carried out
included the effect and optimization of the cutting parameters.
2.
Tool and Workpiece Materials
The workpiece used was medium carbon steel (AISI 1045) with molybdenum High Speed Steel (HSS) turning tool.
AISI designation of the tool is Grade M-7, (1%C, 3.8%Cr, 9.5%Mo, 1.6%W and 2%V). The tool signature is: rake angle (back-100, side-120), cutting edge angle
-150, relief angle-50; and nose radius of 0.5mm.
2.1 Machining Parameters and Experimental
Design
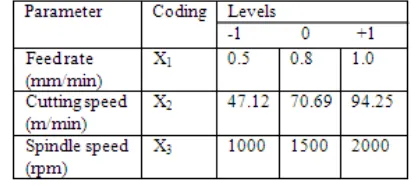
The three machining parameters considered for this study were feed rate (mm/min), cutting speed (m/min) and the spindle speed (rpm). The parameters were set at three levels each. The summary of the parameters are shown in Table 1.
Table 1 Different machining parameters used in the experiment and their levels
This study evokes a Box-Behnken design which requires 3-levels of each factor coded as -1, 0 and 1. The experimental design for this study combines 2-level
Abstract: This work presents an experimental investigation of the influence of the three most important machining parameters of depth of cut, feed rate and spindle speed on surface roughness during turning of mild steel. In this study, the design of experiment which is a powerful tool for experimental design is used to optimize the machining parameters for effective machining of the workpiece. Box Behnken experimental design method as well as analysis of variance (ANOVA) is used to analyze the influence of machining parameters on surface roughness height Ra. The individual parameters effect as well as effect of interactions between the machining parameters on the surface roughness height Ra is analyzed using various graphical representations. Using multiple linear regressions, mathematical models correlating the influence of machining parameters on the surface roughness Ra during the machining process were developed. Confirmation results were used to confirm that mathematical models are good enough to effectively represent machining criteria of surface roughness Ra during the study.
designs with incomplete block. This method creates designs with a fraction of the experiments required for 3-level factorials. The total numbers of experimental runs were 15. This was generated from a center point with three replicates coupled with all possible pairs of 22 designs for the three factors which is {3(22)}.
2.2 Experimentations
The experiments were carried out on Meuser lathe machine, model KM3-46083. The workpiece dimension is 25mm diameter and 170mm length for length-diameter ratio (L/D) of less than 10 in line with ISO 3685 standards. The cutting conditions were randomized according to Box-Behnken design. Qualitest micro-trio-gloss (model No. 4430Nr-05643) was used to measured the Ra
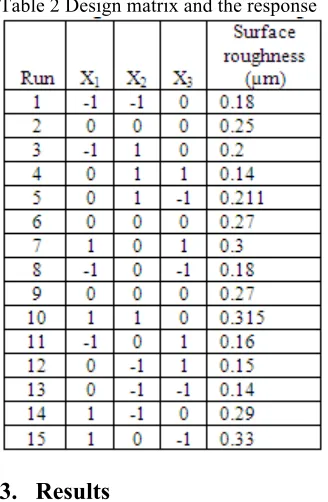
Table 2 Design matrix and the response
3.
Results
Employing the parameters in Table 1, the levels of the parameters for each of the experimental runs in the design matrix and the observed response are given in Table 2.
The general equation for the proposed second order regression model to predict the response y can be written as:
All the coefficients are to be estimated using experimental data. Based on the result presented in Table 2, the derived model equation is shown in Eq. (2).
Surface roughness Ra
= -0.74372 -0.5245*X1 +0.015759 * X2
+0.000734647*X3 -0.00000171683* X2 * X3 +0.52133 *
(X1)2 -0.0000892502 * (X2)2
-0.000000213667 * (X3 )2 (2)
From Eq. 2, the most significant parameter is X1
followed by X2. X3 has least effect on Ra. The missing
terms in the equation are: X1X2 and X1X3. These terms are
not significant for predicting Ra hence they were removed in other to improve the model.
3.1 Adequacy Check for the Developed
Model
The adequacy of the model was checked by analysis of variance (ANOVA). The ANOVA, table 3 for Ra
shows that the p-value for model is less than 0.05, which indicates that the model is significant. The main effects of each linear factor as well as their quadratic effect are significant model terms. The model has significant interaction of cutting speed and spindle speed ( . Table 3 shows that the p-value for ( is less than 0.05 for Ra, this means that the effect of cutting speed on
Ra depends on the spindle speed. The "Lack of Fit F-value" of 0.91 implies its insignificant relative to the pure error. Non-significant lack-of-fit is required for any model to be fitted.
Table 3 ANOVA table (partial sum of squares) for response surface reduced quadratic model
*Significant; **Not significant; DF– Degree of freedom;
SS – Sum of squares; MS – Mean square.
Checking the model adequacy, the experimental and predicted data (Fig. 1) for Ra were plotted. Fig. 1 and ANOVA analyses Table 3 for Ra indicate that the model (Eq. 2) is significant and adequate to represent the relationship between the variables and response, with very small P values (<0.05) and high value of coefficient of determination (R2 = 0.986 ≈ 0.99).
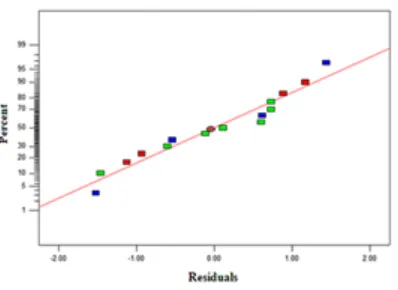
straight line, which show a good correlation between experimental and predicted values for the response (Fig. 2). The plot of residual versus predicted values show minimal variation between the observed and fitted values (Fig. 3). Fig. 4 is the plot of the residuals calculated against the order of experimentation. It is asserted that a tendency to have runs of positive and negative residuals indicate the existence of correlation [14]. From the above analysis of residual plots for Ra, the model does not reveal inadequacy.
Fig. 1 Plot of experimental and predicted Ra.
Fig. 2 Normal probability plot of residuals.
Fig. 3 Plot of residuals and fitted values.
Fig. 4 Plot of residuals vs. order of the data.
3.2 Effect of Machining Parameters on
Ra
Figs. 5a, b, c and d show the effect of feed rate (X1),
cutting speed (X2), spindle speed (X3) as well as the
interaction between cutting speed and spindle speed (X2 X3) on Ra respectively. These figures are appropriate for analyzing data in a designed experiment, with respect to important factors, where the factors are at two or more levels [14].
It can be observed from Fig. 5a, that initially at 0.5 mm/min feed rate, no change in Ra value is observed. As the feed rate increases from 0.58 mm/min to the maximum value of 1 mm/min, Ra increases steadily. The value of Ra is worsen as the cutting speed increases from 47.12 m/min up to 73.66 m/min when Ra value begin to decrease as cutting speed increases to its maximum value (Fig. 5b), this observation is in line with the work of [15]. In a similar manner (Fig. 5c) spindle speed has similar effect as cutting speed has on Ra.
This phenomenon can be attributed to the fact that, during turning at a low feed rate, the heat generated in the tool-workpiece interface is not high enough to affect either the tool, chip formation or the surface roughness. As the feed increases during machining, more heat per time is being produce per unit area of tool/workpiece zone which affects the sub-surface layer of the wokpiece. Furthermore, the heat generated during turning operation usually affects the chip characteristics which in turn translate to the workpiece surface finish.
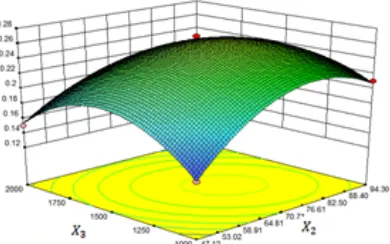
For the case of cutting speed and spindle speed, it can be deduced from Figs. 5b and 5c that, the higher the values of the two machining parameters, the more heat is generated during turning operation. This in turn will produce a negative effect on the surface roughness. The case of improved Ra during further increase of the two parameters (cutting speed and spindle speed), the reason could be due to the fact that heat generated at tool-workpiece interface has reach the equilibrium hence there is no effect of heat recorded on the Ra as the cutting speed and spindle speed increases compare to when they are at low values.
seen that increase in cutting speed leads to a sharp increase in Ra. In addition, the response Ra depends more on the spindle speed rather than on feed rate.
Fig. 5a Effect of feed rate on Ra
Fig. 5b Effect of cutting speed on Ra
Fig. 5c Effect of spindle speed on Ra
Fig. 6 3-D plot of effect of cutting speed and spindle speed on Ra
3.3 Optimizing the Surface Roughness
In optimizing the Ra in this work, the interest is to find the best machining parameters that satisfy minimum value for Ra. The set objective is to minimize Ra within
the parameters set in Table 3. The optimum solution generated for the experimental condition is Ra = 0.107579 µm with machining parameters of X1 =0.5mm/min, X2
=94.3m/min and X3 =2000rpm (Table 4) with 95%
desirability. The desirability
histogram of the optimized solution for the machining condition is shown in Fig. 7.
Table 4 Optimization solutions generated for Ra
Fig. 7 Desirability plot of optimization solution for Ra.
Confirmation experiments were carried out by using the model to predict the response at a particular point then compare the predicted response with the actual observation by conducting another experiment at the same point. The predicted values and the actual confirmation experimental values are compared and the residual and percentage error are calculated (Table 5).
4.
Conclusion
In this study, optimization of machining parameters during turning process has been carried out. The surface roughness response Ra has been modeled and analyzed through response surface methodology (RSM). A Box-Behnken design was used to carry out the experimental study. Analysis of variance (ANOVA) was used to analyze the effect of the parameters on the response. In summary, the following conclusions can be drawn: 1. The feed rate is found to be the most important
parameter effecting Ra, followed by cutting speed while spindle speed has the least effect.
2. Machining with high cutting speed and spindle speed has positive effect on Ra as against feed rate.
3. The predicted value of Ra matches the experimental values reasonably well, with high value of coefficient of determination (R2 = 0.99) for Ra.
4. The variation in percentage error for Ra is between 1 to 5%, which shows that the model developed for Ra is
accurate, and can be used for predicting the surface roughness.
References
[1] Rajput, R.K., (2007) Material science and engineering. USA, Kataria & sons, 480 p.
[2] Bob Capudean, (2003). Carbon content, steel classifications and alloy steels, Retrieved 9th January
2011 from
www.thefabricator.com/article/metalsmaterials/carbo n-content-steel-classifications-and-alloy-steels. [3] Thamizhmanii, S., Saparudin, S and Hasan, S, (2007),
Analyses of surface roughness by turning process using Taguchi method, Journal of Achievements in Materials and Manufacturing Engineering, 20, (1-2), p. 503-506.
[4] Jain, R.K., (2010).Production technology, 17th ed. Khanna publishers, New Delhi, 1090 p.
[5] Saeed Zare Chavoshi and Mehdi Tajdari., (2010), Surface roughness modeling in hard turning operation of AISI 4140 using CBN cutting tool. International Journal of Mat. Form. DOI: 10.1007/s12289-009-0679-2.
[6] Bhattacharya, A. Das, S. Majumder, P. and Batish, A., (2009), Estimating the effect of cutting parameters on surface finish and power consumption during high speed machining of AISI 1045 steel using Taguchi design and ANOVA. Journal of Production Eng. Research and Development (3), p. 31-40.
[7] Reddy, B.S. Kumar, J.S. and Reddy, K.V.K., (2009), Prediction of Surface Roughness in Turning Using Adaptive Neuro-Fuzzy Inference System. Jordan Journal of Mechanical and Industrial Engineering. 3, (4), p. 252-259.
[8] Yusuf, K., Nukman, Y., Yusof, T. M., Dawal, S. Z., Qin Yang, H., Mahlia., T. M. I., and Tamrin., K. F., (2010), Effect of cutting parameters on the surface roughness of titanium alloys using end milling process. Journal of Scientific Research and Essays 5(11), p. 1284-1293.
[9] Wang, Z.G. Rahman., M. Wong., Y.S. Neo., K.S. Sun., J. Tan., C.H. and Onozuka., H., (2009), Study on orthogonal turning of titanium alloys with different coolant supply strategies. International Journal of Advance Manufacturing Technology, 42, p. 621-632.
[10] Salles., J.L.C. and Gonçalves., M.T.T., (2003), Effects of Machining Parameters on Surface Quality of the Ultra High Molecular Weight Polyethylene (UHMWPE). Matéria, Vol 8, p. 1-10, No.1
Retrieved 9th March 2011 from
http://www.materia.coppe.ufrj.br/sarra/artigos/artigo 10119/10119.pdf.
[11]Thakur., D.G. Ramamoorthy., B. and
Vijayaraghavan., L., (2009), Machinability investigation of Inconel 718 in high-speed turning. International Journal of Advance Manufacturing Technology, 45, p. 421-429, DOI 10.1007/s00170-009-1987-x
[12]Tugrul Ozel and Yigit Karpat., (2005), Predictive modeling of surface roughness and tool wear in hard turning using regression and neural networks. International Journal of Machine Tools and Manufacture, 45, p. 467-479.
[13]Naveen, A. Sait, S, Aravindan, and Noorul Haq., A., (2009), Influence of machining parameters on surface roughness of GFRP pipes. Journal of
Advances on Production Engineering and
Management, 4 (1-2), p. 47-58.
[14]Çaydaş., U., and Hasçalik., A., (2007), Modeling and analysis of electrode wear and white layer thickness in die-sinking EDM process through response surface methodology. International Journal of Advanced Manuf Technology, DOI: 10.1007/s00170-007-1162-1.