Time Evolution of the Rotational Transform Profile in
Current-Carrying LHD Plasmas
Yuji NAKAMURA, Kiyomasa WATANABE
1), Yoshiro NARUSHIMA
1), Katsumi IDA
1),
Mikiro YOSHINUMA
1), Satoru SAKAKIBARA
1), Hisamichi FUNABA
1), Kazuo KAWAHATA
1),
Masayuki YOKOYAMA
1), Noriyoshi NAKAJIMA
1)and Atsushi FUKUYAMA
2)Graduate School of Energy Science, Kyoto University, Gokasho, Uji, Kyoto 611-0011, Japan
1)National Institute for Fusion Science, 322-6 Oroshi-cho, Toki, Gifu 509-5292, Japan 2)Graduate School of Engineering, Kyoto University, Yoshida, Kyoto, Kyoto 606-8501, Japan
(Received 16 November 2007/Accepted 19 March 2008)
Numerical analysis is performed for a low beta neutral beam heated plasma and a superdense core plasma in the Large Helical Device (LHD) to investigate the time evolution of the rotational transform profile, which is calculated consistently with the three-dimensional magnetohydrodynamics equilibrium. Although there is a considerable amount of noninductive current flow, such as the bootstrap and Ohkawa currents, the inductive current component prevents a rapid change of the rotational transform profile in these plasmas.
c
2008 The Japan Society of Plasma Science and Nuclear Fusion Research
Keywords: stellarator/heliotron, Large Helical Device, net plasma current, rotational transform, bootstrap cur-rent, Ohkawa curcur-rent, inductive current
DOI: 10.1585/pfr.3.S1058
1. Introduction
The effort to develop an integrated transport code for helical plasmas, TASK3D, is in progress to understand the confinement physics and to design new experimental plans [1, 2]. The major differences between TASK3D, which is consistent with the three-dimensional (3D) magnetohydrodynamics (MHD) equilibrium for heli-cal plasmas, and a one and half dimensional (1.5D) transport code, which is used for tokamak plasmas, include the neoclassical ripple transport, determination of the (ambipolar) radial electric field, and time evo-lution of toroidal current profile, which is equivalent to that of the rotational transform profile. In these studies, the time evolution of the rotational transform due to the finite plasma resistivity in a nonaxisymmetric plasma is solved self consistently with 3D MHD equilibria. Although MHD equilibria can exist for zero net cur-rent in helical plasmas, finite net toroidal curcur-rents have been observed in many actual experiments, even when the Ohmic current is not driven actively. It is consid-ered that the noninductive currents, such as bootstrap and beam driven currents, are the main component of the net plasma current. However, change in the plasma current due to the noninductive currents induces inverse toroidal electric field, when the plasma resistivity is small and the current penetration time is long. In other word, the in-versely induced current is driven so as to suppress the change in the plasma current. Unless the Ohmic current is driven actively by an external circuit, the total net current tends to noninductive as time evolves to the steady state,
author’s e-mail: [email protected]
because the inductive current is decayed by the small but finite plasma resistivity. In an LHD plasma, for example, it takes more than 4 s to achieve the stationary state [3]. Since the rotational transform profile, which has important roles in the MHD stability and confinement, is sensitive to the net plasma current, it is indispensable to clarify the effect of inductive component of the plasma current qual-itatively. In our previous study [3], MHD equilibrium and noninductive current profile are fixed in time during the calculation of the rotational transform profile. However, numerical problems were encountered at the plasma center and the plasma boundary when we updated the MHD equi-librium and noninductive current at some time intervals.
In the present study, the above numerical problems that arose from the boundary condition are removed by changing the difference scheme. We apply this simulation code to the LHD experiments in which the direction of neutral beam (NB) injection is switched from the counter-direction to the co-counter-direction, and clarify the role of induc-tive plasma current profile quantitainduc-tively. We also apply this analysis to a superdense core (SDC) plasma in LHD to estimate the rotational transform profile in the SDC plasma.
2. Time Evolution of the Rotational
Transform
A conservation equation for the rotational transformι is derived from the contravariant component of Faraday’s law [4]:
∂ι ∂t =
1 φ
∂φ
∂t
ρ∂ρ∂ι +∂ρ∂
V
φ E·B
,
c
2008 The Japan Society of Plasma
whereφ = ΦT/2π,ΦT is the toroidal magnetic flux, ρis
an arbitrary flux surface label, V = V/(2π)2, V is vol-ume inside the flux surface, andE·Bcorresponds to the flux averaged parallel electric field. Primes denotes deriva-tive with respect toρ. If we use the parallel component of Ohm’s law,
E·B=ηj·B −jNI·B ,
and use the relation between the parallel current density andι, we can get the diffusion equation ofι[1, 3]. Here, η is the neoclassical parallel resistivity, andj·B and j
NI·B correspond to the flux averaged parallel current
density and noninductive current density, respectively. In a previous study, we solved the diffusion type equa-tion for the rotaequa-tional transform that usesρ≡ √sas a ra-dial variable, wheres≡ΦT/ΦedgeT is the toroidal flux
nor-malized by its value at the plasma boundary. The Crank-Nicholson difference scheme was used on a half radial grid point,ρ=ρj−1/2 ≡(j−1/2)Δρ, whereΔρis an uniform
radial grid spacing. The use of half grid points is suitable for the boundary condition at the plasma center. However, there were numerical problems in some cases. The prob-lems arose from two reasons. One is that the interpolation of the MHD equilibrium data calculated on uniformsgrids by the VMEC code [5] to those on uniformρgrids is not sufficiently accurate near the magnetic axis. Another is that numerical instabilities come from the boundary condition at the plasma boundary, which is not defined on the half grid points.
In order to improve numerical stability, we usesas a radial variable in the equation of the rotational transform profile, which now can be written as
∂ι ∂t =
φa s ∂φa ∂t ∂ι ∂s
+φ12 a
⎧⎪⎪ ⎪⎨ ⎪⎪⎪⎩∂∂s
⎡ ⎢⎢⎢⎢⎢ ⎢⎣ηV B2 μ2 0 ∂
∂s(S11ι+S12)
⎤ ⎥⎥⎥⎥⎥ ⎥⎦ +∂∂ s
ηVp(S
11ι+S12)−ηVJNI·B
⎫⎪⎪⎪⎬ ⎪⎪⎪⎭. whereφa = ΦedgeT /2π,
B2is flux surface average of the
square of magnetic field strength,pis pressure, and primes denote derivative with respect tos. The susceptance matrix is defined [6] as
S11=V
gθθ g
,
S12=V
gθζ(1+∂θλ)−gθθ∂ζλ g
,
whereλis a magnetic field stream function defined in the VMEC representation [5]. The rotational transform is re-lated to the toroidal current within the flux surface,IT(s),
through the susceptance matrix as, ι= IT
Φ
TS11
−S12
S11.
It should be noted thatS12 = 0 andι is proportional to
the toroidal current in axisymmetric plasmas. For numer-ical calculations, a finite difference equation is defined on a full grid point,s=sj≡ jΔs, instead of a half grid point
to eliminate the numerical difficulty at the plasma bound-ary. We named this rotational transform calculation code TASK/EI.
The susceptance matrix,B2,V, andpare obtained
from the equilibrium data calculated by the VMEC code. Noninductive bootstrap current, beam driven Ohkawa cur-rent, and neoclassical parallel resistivity are calculated by the BSC and FIT codes [1, 3]. These data are supplied to TASK/EI, and the rotational transform is evolved dur-ing some time interval, which is typically 100 ms for LHD plasmas. In the equation ofιevolution, we assumed that MHD equilibrium quantities such as susceptance matrix are consistent with evolvedι (in this sense, the equation is intrinsically nonlinear), but we also assumed that the change inιand the resultant change in MHD quantities are negligibly small during the calculation. Then, the updated rotational transform profile along with the experimentally obtained density and temperature profiles are used as in-puts of the VMEC code, and noninductive current is re-estimated by the BSC and FIT codes. These procedures are iterated during the simulation.
3. Analysis of Plasma Current in a
Low Beta NBI Plasma
Fig. 1 Experimentally evaluated time evolutions of density and temperature profiles of a low beta NBI plasma in LHD.
Fig. 2 Time evolution of experimentally observed total current and those of the Ohkawa and bootstrap current estimated by the BSC and FIT codes.
the current density profile in the transient state.
Numerical simulation of the rotational transform is performed using density and temperature profiles evolu-tion shown in Fig. 1. Since the ion temperature is neces-sary for noninductive current calculation by the BSC and FIT codes, we assume that the ion temperature is equal to the electron temperature. Observed total plasma current shown in Fig. 2 is used as the boundary condition for the equation of the rotational transform. The result is shown in Fig. 3. In this calculation, MHD equilibrium and the noninductive current is re-evaluated every 0.1 s. We also
Fig. 3 Time evolutions of current density and rotational trans-form profile obtained by the numerical simulation.
performed the calculation in which we update MHD equi-librium and noninductive current every 0.01 s, and found that the time interval of 0.1 s is sufficient for this calcula-tion. The dashed line in Fig. 3 shows noninductive current density profile att=4.5 s. Although the total current den-sity increases gradually to the value of the noninductive one, inductive current component is not small even att =
4.5 s. The rotational transform atρ=0.5 is about 0.67 at
t =4.5 s. This value of the rotational transform is close to that evaluated by the Motional Stark Effect (MSE) mea-surement [3]. The value estimated using noninductive cur-rent density profile is about 0.75. In this simulation, we used the neoclassical electric conductivity calculated by the BSC code. The use of Spitzer conductivity results in a slower time evolution of the rotational transform. Figure 4 shows the ratio of neoclassical electric conductivity and classical Spitzer conductivity. Significant reduction of the electric conductivity due to the neoclassical effect can be seen. This tendency agrees roughly with the simple esti-mation obtained using the trapped particle fraction [7]. We will use the neoclassical conductivity for the calculation in Sec. 4.
4. Analysis of Plasma Current in a
Su-per Dense Core Plasma
Fig. 4 Ratio of neoclassical electric conductivity and classical Spitzer conductivity.
this mode, a superdense plasma with the central density of ∼5×10²⁰m−3is maintained by the formation of an IDB with extremely high density gradient. In order to clarify the physics of SDC plasma formation, it is very impor-tant to know the rotational transform profile in such plas-mas [8]. Since the rotational transform is very sensitive to the plasma current, consistent analysis of both nonin-ductive and innonin-ductive currents to the MHD equilibrium is necessary. As shown in the previous section, time history of plasma parameters is important to estimate the inductive current and rotational transform profiles accurately.
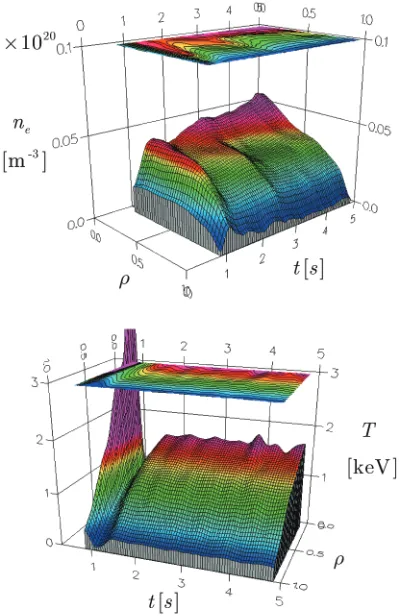
Typical density and temperature profile evolution of SDC plasmas obtained by the Thomson scattering mea-surement are shown in Fig. 5. The high density plasma whose central electron density reaches over 4×10²⁰m−3
is produced by a series of pellet injections, and the su-perdense core is formed fromt ∼ 0.8 s in this case [8].
The volume averaged beta of this high density plasma estimated by the diamagnetic measurement is βdia =
0.5 ∼1.0%. Before pellet injections, plasma beta is low (βdia ∼ 0.2%), noninductive current is mainly driven by
the NB injection, and the Ohkawa current calculated by the BSC and FIT codes is about 200 kA. However, observed total current at this period is less than 20 kA. After pel-let injections, the bootstrap current becomes the dominant noninductive current, and it is estimated to be about 50 kA. The observed total current is less than 25 kA.
The time evolution of the noninductive current JNI·B profile obtained by the BSC and FIT codes is
shown in Fig. 6. Before pellet injections, noninductive cur-rent density profile due to the Ohkawa curcur-rent is peaked at the center. After pellet injection, the central density is increased, and the central temperature is decreased. This causes a rapid drop in the Ohkawa current due to fast ther-malization of fast ions produced by the NB injection. Af-ter that, the broader noninductive current profile can be seen because of the bootstrap current. It can also be seen from this figure that the bootstrap current increases after the density drops and the temperature recovers, i.e., the
Fig. 5 Experimentally evaluated time evolutions of density and temperature profiles of an SDC plasma.
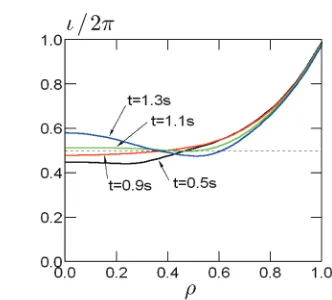
Fig. 7 Time evolution of the calculated rotational transform pro-file in an SDC plasma.
collision frequency decreases. Time evolution of the paral-lel currentJ·Bcalculated by TASK/EI is also shown in Fig. 6. In this calculation, experimentally obtained density and temperature profile shown in Fig. 5, equilibrium quan-tities, and noninductive current calculated by the BSC and FIT codes are updated every 0.1 s self consistently. The boundary condition, i.e., the total plasma current, is given by the experimental data. It is clearly seen that the induc-tive component of the plasma current almost cancels the noninductive current, and the net toroidal current is signifi-cantly reduced. Resultant evolution of the rotational trans-form profile is shown in Fig. 7. Doubleι = 1/2 surfaces appear around the half radius. These profiles are similar to those in current-free MHD equilibria.
In order to evaluate the effect of the time interval between subsequent equilibrium and noninductive current calculations, we also performed a calculation in which we update MHD equilibrium and noninductive current every 0.01 s. Even though there is a small difference between the result from the calculation with time interval of 0.1 s and that of 0.01 s, especially at the beginning of the calcula-tion, they agree well with each other. Therefore, we can conclude that the time interval of 0.01∼0.1 s seems suffi -cient for the validity of our assumptions in the equation of ιevolution for the calculation of LHD plasmas.
5. Summary
We have developed a net plasma current simulation code for integrated simulations of helical plasmas, and an-alyze net plasma currents observed in LHD plasmas. The effect of the inductive current is important for estimating the net plasma current, especially when the beam driven
currents are considered. Numerical analysis for a low beta NBI heated plasma shows that it takes more than 4 s for the toroidal plasma current (or rotational transform) profile to reach the steady state. If we estimate the characteristic current diffusion time using the electric conductivity at the half radius, it is about 2.5 s. However, it is strongly de-pendent on the electron temperature and takes more time to reach the steady state at the plasma center. On the other hand, the characteristic L/R time for the total current ramp up is estimated as about 5 s from the experiment. It is com-parable to the current diffusion time. This fact suggests that both the current diffusion and L/R times contribute to de-termine the time scale of the current density profile evolu-tion. It is also shown that the neoclassical correction of the electric conductivity is important. In an SDC plasma that we analyzed, net toroidal current is negligible due to the inductive component, although the noninductive current is significantly large. Despite this, noninductive current, es-pecially the bootstrap current, will become important if we consider long pulse SDC shots or SDC reactor scale plasmas. For most LHD plasmas, time interval of 0.1 s between subsequent MHD equilibrium and noninductive current calculations is sufficiently small for the validity of the numerical assumption unless the noninductive plasma current changes rapidly.
In the present study, we used experimentally ob-tained total toroidal current evolution as a boundary con-dition. In order to perform predictive calculations, how-ever, we should use the loop voltage evaluated numeri-cally as a boundary condition. We should also incorporate the TASK/EI module in the integrated transport simulation code TASK3D. These are our future study subjects.
This work was supported by the LHD Coordinated Research program of National Institute for Fusion Science (NIFS05KOAH020).
[1] Yuji Nakamuraet al., Fusion Sci. Technol.50, 457 (2006). [2] M. Satoet al., submitted to Plasma Fusion Res.
[3] Yuji Nakamuraet al., Proc. of 21th IAEA Fusion Energy Conf. (Chengdu, China, 2006) IAEA-CN-149/TH/P7-1. [4] S.P. Hirshman and D.J. Sigmar, Nucl. Fusion 21, 1079
(1981).
[5] S.P. Hirshman, W.I. van Rij and P. Merkel, Comput. Phys. Commun.43, 143 (1986).
[6] P.I. Strand and W.A. Houlberg, Phys. Plasma 8, 2782 (2005).
[7] K.Y. Watanabe et al., J. Plasma Fusion Res. Ser.5, 124 (2002).