R E S E A R C H A R T I C L E
Open Access
TMEM106B
haplotypes have distinct gene
expression patterns in aged brain
Yingxue Ren
1, Marka van Blitterswijk
2, Mariet Allen
2, Minerva M. Carrasquillo
2, Joseph S. Reddy
1, Xue Wang
1,
Thomas G. Beach
3, Dennis W. Dickson
2, Nilüfer Ertekin-Taner
2,4, Yan W. Asmann
1and Rosa Rademakers
2*Abstract
Background:Single nucleotide polymorphisms (SNPs) inherited as one of two common haplotypes at the transmembrane protein 106B(TMEM106B) locus are associated with the risk of multiple neurodegenerative diseases, including frontotemporal lobar degeneration with pathological inclusions of TDP-43. Among the associated variants, rs3173615 (encoding p.T185S) is the only coding variant; however, non-coding variants may also contribute to disease risk. It has been reported that the risk haplotype is associated with higher levels of TMEM106B and increased levels of TMEM106B cause cytotoxicity; however, the precise mechanism through whichTMEM106B haplotypes contribute to neurodegeneration is unclear.
Methods:We utilized RNA sequencing data derived from temporal cortex (TCX) and cerebellum (CER) from 312 North American Caucasian subjects neuropathologically diagnosed with Alzheimer’s disease, progressive
supranuclear palsy, pathological aging or normal controls to analyze transcriptome signatures associated with the risk (TT) and protective (SS)TMEM106Bhaplotypes. In cohorts matched for disease phenotype, we used Analysis of Variance (ANOVA) to identify differentially expressed genes and Weighted Gene Co-expression Network Analysis (WGCNA) to identify gene networks associated with the risk and protectiveTMEM106Bhaplotypes.
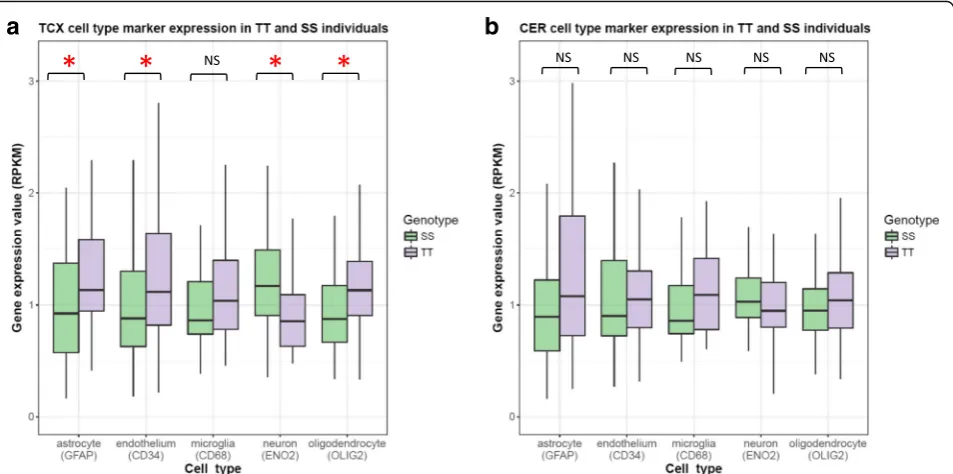
Results:A total of 110 TCX and 116 CER samples were included in the analyses. When comparing TT to SS carriers, we detected 593 differentially expressed genes in TCX and 7 in CER. Gene co-expression network analyses further showed that in both TCX and CER the SS haplotype was positively correlated with gene networks involved in synaptic transmission, whereas the TT haplotype was positively correlated with gene networks enriched for immune response. Gene expression patterns of 5 cell-type-specific markers revealed significantly reduced expression of the neuronal marker and relative increases in all other cell markers in TT as compared to SS carriers in TCX with a similar but non-significant trend in CER.
Conclusions:By comparing the commonTMEM106Brisk and protective haplotypes we identified significant and partly conserved transcriptional differences across TCX and CER and striking changes in cell-type composition, especially in TCX. These findings illustrate the profound effect ofTMEM106Bhaplotypes on brain health and highlight the importance to better understand TMEM106B’s function and dysfunction in the context of neurodegenerative diseases.
Keywords:TMEM106B, Frontotemporal dementia, Co-expression networks, Differential expression, Synaptic transmission, Immune response, Progranulin
* Correspondence:[email protected]
2Department of Neuroscience, Mayo Clinic, Jacksonville, FL, USA
Full list of author information is available at the end of the article
Background
Given the world’s aging population, neurodegenerative diseases have become a major cause of disability and death. While the disease mechanisms differ, neurodegen-eration often results from the accumulation of misfolded aggregated proteins in different areas of the aging brain, and this process yields cell death and inflammatory dam-age in those brain regions [1]. Recent studies have re-vealed that two common haplotypes in transmembrane protein 106B (TMEM106B) are associated with risk of multiple neurodegenerative diseases, most notably with frontotemporal lobar degeneration with pathological in-clusions of TDP-43 (FTLD-TDP) [2–4], progranulin (GRN)-related FTLD [3, 5], chromosome 9 open reading frame 72 (C9ORF72)-mediated FTLD [6, 7] and hippo-campal sclerosis of aging [8, 9]. TMEM106B haplotypes were also shown to associate with the development of cognitive impairment in amyotrophic lateral sclerosis (ALS) [10] and with the presence of TDP-43 pathology in Alzheimer’s disease (AD) [11] and elderly individuals with-out FTLD [12]. The broad involvement ofTMEM106Bin neurodegenerative diseases makes it an important gene to characterize and a promising target for potential therapies. As with most risk loci identified by genome-wide asso-ciation studies (GWAS), the functional variant(s) in the TMEM106B locus associated with the reported associa-tions remains elusive. Within the associated linkage dis-equilibrium (LD) block, rs3173615 is the only variant encoding an amino acid change from the more common, highly conserved, threonine (Thr185; risk allele) to a serine (Ser185; protective allele) at position 185. In vitro, the protective (Ser185) TMEM106B isoform was consist-ently expressed at lower levels than the risk (Thr185) TMEM106B isoform due to an increased rate of protein degradation, possibly resulting from changes in TMEM106B glycosylation [13]. In addition to the coding variant (rs3173615) numerous non-coding variants also differentiate theTMEM106Bhaplotypes and at least one of these variants (rs1990620) was suggested to affected higher-order chromatin architecture at the TMEM106B locus and changes in mRNA expression [14]. Indeed, ex-pression studies in FTLD-TDP brains have shown in-creased TMEM106BmRNA levels in carriers of the risk haplotype [2]. Regardless of the identity of the specific functional variant(s), these findings suggest the presence of higher levels of TMEM106B in carriers of the risk haplotype and lower levels of TMEM106B in carriers of the protective haplotype. These findings are in line with cell biological studies which showed that increased TMEM106B levels were cytotoxic and led to an increase in lysosomal size and reduced lysosomal acidification [4]. Importantly, however, the specific mechanism by whichTMEM106Bhaplotypes and changes in its expres-sion contribute to neurodegeneration remains unknown.
In this study, we utilized RNA sequencing data of tem-poral cortex (TCX) and cerebellum (CER) samples from 312 North American Caucasian subjects to identify tran-scriptome signatures associated with the TMEM106B haplotypes. By comparing homozygote rs3173615 TT (risk) and SS (protective) carriers, we discovered differ-entially expressed genes in both TCX and CER regions, and identified shared gene co-expression networks be-tween TCX and CER through which the TMEM106B haplotypes may contribute to brain function and brain health.
Materials and methods
Dataset description
We used RNA sequencing data of 268 TCX and 266 CER brain samples from 312 North American Cauca-sian subjects with neuropathological diagnosis of AD, progressive supranuclear palsy (PSP), pathologic aging (PA; defined as aging in nondemented elderly humans that is associated with moderate to marked cerebral amyloid deposition in the absence of significant neuro-fibrillary degeneration) [15] or elderly controls (CON) without clinically-significant neurodegenerative diseases [16]. The tissue processing, RNA extraction, RNA se-quencing, quality control and data normalization were previously described [16, 17]. To differentiate individ-uals with the TMEM106B risk and protective haplo-types we used rs3173615 as the tagging variant. Genotypes of rs3173615 for the 312 individuals were extracted by PLINK using data generated from Illumina Omni2.5 BeadChips [17].
Differential gene expression analysis
Conditional Quantile Normalization (CQN) was previ-ously performed on the raw gene counts to correct for GC bias and gene length differences, and to obtain simi-lar quantile-by-quantile distributions of gene expression levels across samples [17]. Based on the bi-modal distri-bution of the CQN normalized and log2-transformed reads per kb per million (RPKM) gene expression values, for both TCX and CER samples, protein-coding genes with average log2 RPKM > =−1 in at least one haplo-type group were considered expressed above detection threshold and were included in further analysis. Using this selection threshold, 16,868 genes were included for the TCX analysis and 14,994 were included for the CER analysis.
source of variation analyses from which factors with mean F ratio > 1.25 were considered confounding factors that needed to be adjusted for. TheBenjamini–Hochberg procedure was performed to adjust for multiple testing and control false discovery rate (FDR). Differentially expressed genes (DEG) were defined by thresholds of |fold change| (FC) > = 1.5 and adjusted p value < 0.05. The significance of DEG overlap between TCX and CER was tested by calculating empirical p-value based on 100,000 simulations. Pathway analyses of differentially expressed genes were performed using MetaCore path-way analysis (Thomson Reuters) (Version 6.25).
Weighted gene co-expression network analysis
To identify groups of genes that are correlated with the TMEM106B haplotype, we performed Weighted Gene Co-expression Network Analysis (WGCNA) [18] using residual expression values calculated from adjusting for RIN, age at death, sex, and disease type. Separate WGCNA analyses were performed for the TCX and CER datasets. Signed hybrid co-expression networks were built for both WGCNA analyses. For each set of genes, a pairwise correlation matrix was computed and an adjacency matrix was calculated by raising the correl-ation matrix to a power. Based on the relcorrel-ationships be-tween power and scale independence, the power of 4 was chosen for the TCX dataset, and the power of 14 was chosen for CER dataset. We used hybrid dynamic tree cutting, a minimum module size of 40 genes, and a minimum height for merging modules at 0.25 for both TCX and CER. Each module was summarized by the first principal component of the scaled (standardized) module expression profiles (module eigengene). For each module, the module membership measure (MM) was defined as the correlation between gene-expression values and the module eigengene. Hub genes from rele-vant modules, which have the highest connectivity to other genes within the module, were selected using the WGCNA function“chooseTopHubInEachModule”. Each module was assigned a unique color identifier, and genes that did not fulfil these criteria for any of the modules were assigned to the gray module. To assess the correl-ation of modules to the TMEM106B protective (SS) haplotype, we defined the TT genotype as 0, and SS as 1. Modules significantly associated with TT or SS were an-notated using WGCNA R function GOenrichmentAna-lysis. Modules were also tested for enrichment of the respective DEG signatures using the anRichment R package.
Results
Selection of study population and basic characteristics
In our available dataset, we identified 77 individuals homozygous for the C allele at rs3173615 corresponding
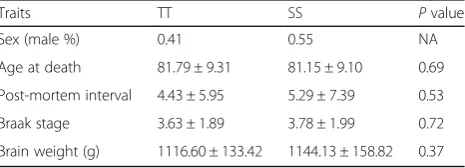
to Thr185 (16 AD, 29 PSP, 8 PA and 24 CON; further referred to as TT) and 65 individuals homozygous for the G allele at rs3171615 corresponding to Ser185 (26 AD, 16 PSP, 5 PA and 18 CON, further referred to as SS) in the TCX. In the CER dataset, 80 individuals were TT (21 AD, 29 PSP, 5 PA and 25 CON) and 64 in-dividuals were SS (26 AD, 16 PSP, 6 PA and 16 CON). Since our cohort comprised samples from cases with dif-ferent neurodegenerative disease as well as neuropatho-logically normal individuals, we further matched TT and SS study groups on pathological diagnosis and subse-quently on sex and age at death, where possible. In sum, we included 55 TT and 55 SS TCX samples (n= 110) with equal numbers of AD, PSP, PA and CON in each group (Additional file 1: Table S1). In the CER, we se-lected 58 TT and 58 SS samples (n= 116) with equal numbers of AD, PSP, PA and CON in each group. The 110 TCX and 116 CER samples were from 133 individ-ual subjects (93 individindivid-uals had both CER and TCX samples). The general characteristics of the TT and SS study groups included in the analyses are presented in Table1. TT and SS individuals were of comparable com-position in terms of sex and age at death (by study de-sign) and postmortem interval (PMI), and were also found to be similar in terms of Braak stage and brain weight.
Transcriptional differences between TMEM106B TT and SS carriers in TCX and CER
We first compared transcriptome-wide gene expression between TT and SS carriers. In the TCX dataset, we identified 593 DEGs between TT and SS carriers (Add-itional file 1: Table S2). In the CER dataset, we only identified 7 DEGs (Additional file 1: Table S3), none of which overlapped with the TCX DEGs. The large differ-ence between TCX and CER suggests that the impact of TMEM106B is more prominent in a brain region af-fected by neurodegeneration. To further study potential similarities in the expression changes in CER and TCX we compared the top 500 genes with |FC|≥1.2 between SS and TT ranked by unadjusted p value in the TCX and CER dataset, which showed significant overlap in genes (n= 28; p= 0.0008) (Additional file 1: Table S4).
Table 1Characteristics of the subjects included in this study
Traits TT SS Pvalue
Sex (male %) 0.41 0.55 NA
Age at death 81.79 ± 9.31 81.15 ± 9.10 0.69
Post-mortem interval 4.43 ± 5.95 5.29 ± 7.39 0.53
Braak stage 3.63 ± 1.89 3.78 ± 1.99 0.72
Brain weight (g) 1116.60 ± 133.42 1144.13 ± 158.82 0.37
Most of these genes are involved in neurotransmitter formation and regulation and interestingly GAD1 (FCCER 1.44; FCTCX 1.90), GAD2 (FCCER 1.49; FCTCX 2.14) and SLC32A1 (FCCER 1.39; FCTCX 2.25), all crit-ical for GABAergic neurotransmission, are among the shared genes.
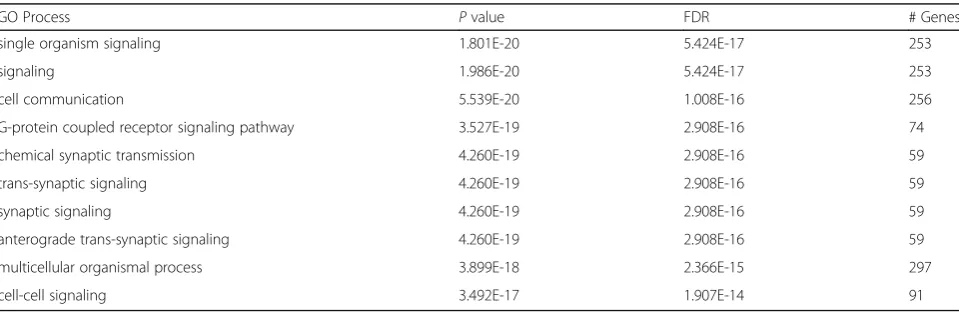
Next we performed pathway enrichment analysis on the DEGs. In TCX, 9 out of the 10 top enriched gene ontology (GO) terms were related to synaptic signaling or cell communication (Table2). In the CER, since only 7 genes passed the thresholds of |FC| > = 1.5 and ad-justed p values < 0.05, we loosened the threshold to |FC| > = 1.2 and unadjusted p values < 0.05 to allow the study of sufficient genes in the pathway analysis. In CER, we found most top enriched GO processes to be related to immune response; however, signaling was also among the top enriched GOs (Table3).
Co-expression network analyses reveals gene clusters significantly correlated with TMEM106B TT and SS carrier status in TCX and CER
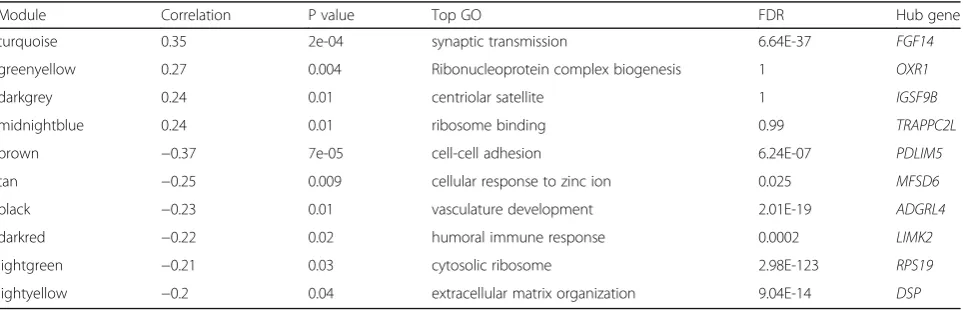
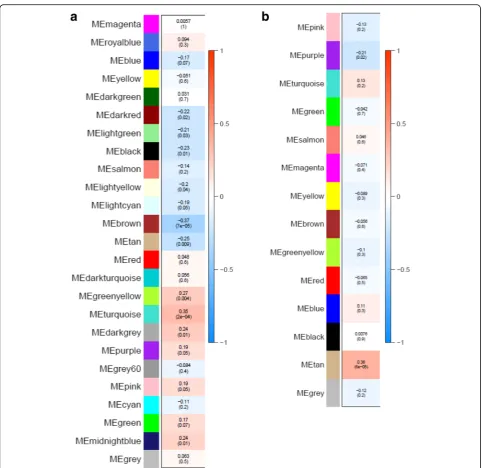
To gain further insight into the gene networks associ-ated with the TMEM106B T (risk) and S (protection) haplotypes, we applied a gene co-expression network approach, WGCNA, which can functionally probe transcriptomic patterns of change. WGCNA is a com-putational tool that clusters genes in an unsupervised manner based on their correlated co-expression, and thus defines biologically relevant groups of genes that typically correspond to specific processes. WGCNA analysis of the TCX dataset identified 25 gene clusters (modules). The TMEM106B haplotype was signifi-cantly correlated with 10 modules: 4 positively corre-lated with SS and 6 positively correcorre-lated with TT (Table 4, Fig. 1a). WGCNA analysis of the CER data-set identified 14 modules. The TMEM106B haplotype was significantly correlated with 2 modules: 1 posi-tively correlated with SS and 1 posiposi-tively correlated with TT (Table 5, Fig. 1b). GO enrichment analysis
on the modules significantly correlated with the TMEM106B haplotypes showed that synaptic trans-mission was a highly enriched GO in both TCX and CER from modules significantly positively correlated with the SS haplotype (modules turquoise in TCX and tan in CER). In addition, immune response was a highly enriched GO from modules significantly nega-tively correlated with the SS haplotype (posinega-tively cor-related with TT) (modules darkred in TCX and purple in CER). This suggests that the TMEM106B haplotypes may influence brain function in multiple brain regions through similar mechanisms. Addition-ally, the TCX and CER synaptic transmission modules and the CER immune response module were signifi-cantly enriched for their respective DEGs, which demonstrated the consistency between the two ana-lytic approaches (Additional file 1: Table S5).
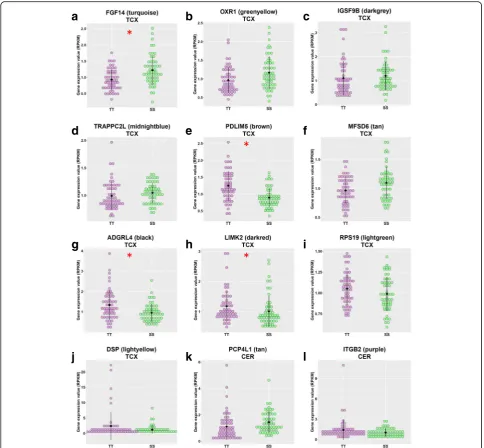
We next identified the intramodular hub genes in the modules significantly correlated with the TMEM106B haplotype status. Hub genes are the genes with the high-est connectivity to other genes of the same module; therefore, they often have important roles in the network and biological functions even if they do not meet the DEG threshold. Using the WGCNA function“ chooseTo-pHubInEachModule”, we identified one hub gene for each significant module (Tables5and 6). The expression level of each hub gene in SS and TT carriers is shown in Fig. 2. For the synaptic transmission modules and im-mune response modules in TCX and CER, we also visu-alized the connection among hub genes and the top 30 genes with the highest connectivity within the respective modules using VisANT [19] (Fig.3).
Cell type composition may underlie expression differences observed in TMEM106B TT and SS carriers
The central nervous system (CNS) includes 5 main cell types: neurons, astrocytes, microglia, oligodendrocytes, and endothelial cells. We hypothesized that the relative abundance of different cell types may at least partially
Table 2Top 10 enriched GO terms from differentially expressed genes in TCX
GO Process Pvalue FDR # Genes
single organism signaling 1.801E-20 5.424E-17 253
signaling 1.986E-20 5.424E-17 253
cell communication 5.539E-20 1.008E-16 256
G-protein coupled receptor signaling pathway 3.527E-19 2.908E-16 74
chemical synaptic transmission 4.260E-19 2.908E-16 59
trans-synaptic signaling 4.260E-19 2.908E-16 59
synaptic signaling 4.260E-19 2.908E-16 59
anterograde trans-synaptic signaling 4.260E-19 2.908E-16 59
multicellular organismal process 3.899E-18 2.366E-15 297
explain the differences in the transcriptional signatures observed in TT and SS carriers. Because the cell type composition can be estimated by cell-type-specific gene expression levels, we adopted the approached described in Allen et al. [17] and used 5 genes to estimate the cell type composition in the brain tissue samples: ENO2 for neurons (ENSG00000111674), GFAP for astrocytes (ENSG00000131095), CD68 for microglia (ENSG00000129226), OLIG2 for oligoden-drocytes (ENSG00000205927), and CD34 for endothe-lial cells (ENSG00000174059). When we compared the expression of these 5 genes in the TT and SS car-riers we found, in TCX, that the SS carcar-riers had sig-nificantly higher neuronal gene expression and lower astrocyte, endothelium and oligodendrocyte gene ex-pression as compared to the TT carriers. The expres-sion of the microglial marker CD68 was also lower in SS as compared to TT carriers, but this difference was not significant. In CER, the same trends were ob-served, although none of the differences were signifi-cant (Fig. 4).
Discussion
In this study, we used RNA sequencing data of two brain regions to investigate the involvement of the TMEM106B risk and protective haplotypes in brain health. We identified large transcriptional differences be-tween the protective SS and risk TT haplotypes in TCX, and much smaller differences in CER, consistent with the higher level of tissue damage and neuronal loss in the TCX region. Importantly, even though not statisti-cally significant in CER, our data suggested similarities in the effects of TMEM106B haplotypes on the tran-scriptional signatures in both brain regions. By compar-ing the top 500 differentially expressed genes in TCX and CER with |fold change|≥1.2 between SS and TT, we found 28 overlapping genes, all with a fold-change in the same direction (25 are increased and 3 are de-creased in SS carriers as compared to TT carriers). Some of the biggest increases in SS carriers were seen in GAD1 and GAD2, glutamic acid decarboxylases which are responsible for catalyzing the production of gamma-aminobutyric acid (GABA) from glutamate, and
Table 3Top 10 enriched GO terms from differentially expressed genes in CER
GO Process P value FDR # Genes
immune system process 1.990E-19 1.005E-15 101
defense response 3.083E-17 7.783E-14 69
regulation of multicellular organismal process 1.448E-16 2.438E-13 122
immune response 4.750E-16 5.996E-13 61
inflammatory response 1.576E-15 1.591E-12 38
response to stimulus 6.918E-15 5.822E-12 224
response to lipid 4.419E-14 3.187E-11 61
single organism signaling 1.247E-13 7.520E-11 163
signaling 1.341E-13 7.520E-11 163
positive regulation of multicellular organismal process
5.047E-13 2.548E-10 76
Table 4Modules significantly correlated to theTMEM106Brs3173615 status in TCX
Module Correlation P value Top GO FDR Hub gene
turquoise 0.35 2e-04 synaptic transmission 6.64E-37 FGF14
greenyellow 0.27 0.004 Ribonucleoprotein complex biogenesis 1 OXR1
darkgrey 0.24 0.01 centriolar satellite 1 IGSF9B
midnightblue 0.24 0.01 ribosome binding 0.99 TRAPPC2L
brown −0.37 7e-05 cell-cell adhesion 6.24E-07 PDLIM5
tan −0.25 0.009 cellular response to zinc ion 0.025 MFSD6
black −0.23 0.01 vasculature development 2.01E-19 ADGRL4
darkred −0.22 0.02 humoral immune response 0.0002 LIMK2
lightgreen −0.21 0.03 cytosolic ribosome 2.98E-123 RPS19
SLC32A1 (also known asVGAT) which is a transporter involved in the uptake of GABA and glycine into synap-tic vesicles. The specific changes in GABA-related sig-naling are interesting in light of a recent study which reported the preferential elimination of inhibitory
synapses (defined by VGAT+ immunoreactivity) in the ventral thalamus of Grn knock-out mouse brains [20]. This observation raises the possibility that more robust GABAergic signaling or an increase in the number of inhibitory synapses at baseline in SS haplotype carriers
Fig. 1Module-haplotype correlation in (a) TCX and (b) CER. Each rectangle represents a module. The top number in each rectangle is the correlation coefficient (r) between the module eigengene to haplotype, and the bottom number is the p value of the correlation. The color orange represents positive correlation to the SS haplotype and blue represents negative correlation to SS (positive correlation to TT)
Table 5Modules significantly correlated to theTMEM106Brs3173615 status in CER
Module Correlation P value Top GO FDR Hub gene
tan 0.36 6e-05 synaptic transmission 4.74E-05 PCP4L1
may contribute to the profound protection conferred by this haplotype in patients withGRNmutations. Future im-munohistochemical studies in human brain samples from SS and TT TMEM106B carriers are needed to confirm this hypothesis.
Using gene co-expression network analyses we further identified significant correlations of TMEM106B haplo-types with gene expression modules enriched for genes involved in similar biological processes across both brain regions. In TCX and CER, theTMEM106BSS haplotype was correlated with gene networks involved in synaptic transmission, whereas the TT haplotype was correlated
with immune response networks in both brain regions, in addition to other specific gene networks such as cell-cell adhesion found only in TCX. In a further refer-ence to theGrnknock-out mouse model, it is of interest to note that the gene expression modules most signifi-cantly correlated with the loss ofGrnin cerebral cortex, cerebellum and hippocampus in mice were annotated by GO as involved in the innate immune response with C1qa, C1qb, C1qc, and C3 among the most connected genes in the module, similar to what we observed when we compared SS to TT carriers in the CER (purple mod-ule; Fig.3d) [20]. Finally, using 5 genes as surrogates for
a
b
c
d
e
f
g
h
i
j
k
l
the 5 major brain cell types, we found that the gene net-works were associated with the cell type composition in the TT and SS brains: the SS carriers showed higher neuronal gene expression as compared to the TT car-riers, corresponding to an increase in networks related to synaptic transmission in SS brains; the TT carriers showed higher microglial gene expression as compared to SS carriers, in agreement with the observed enrich-ment for immune response networks in TT brains.
TMEM106Brisk variants had previously been reported to be associated with both brain volume and connectiv-ity. Specifically, using imaging studies, the TMEM106B risk allele was shown to significantly associate with re-duced brain volume in non-demented elderly individ-uals, particularly in the superior temporal gyrus in the left hemisphere [21]. In addition,GRNmutation carriers with two copies of the TMEM106B risk allele demon-strated worsened brain connectivity compared to those who carried one or no risk alleles [22]. These authors found that TMEM106B haplotypes did not influence grey matter volume directly on its own, but in mutation
carriers the protective TMEM106B haplotype was able to enhance the benefit of cognitive reserve on brain structure. Similarly, in our study, we found no significant differences in total brain weight between our TT and SS carriers. Instead our data suggest that the SS protective haplotype may confer higher synaptic transmission by strengthening brain connectivity in aged or diseased brain.
TMEM106B has also recently been linked to healthy neurological aging. In frontal cortex, the TMEM106B risk haplotype was associated with gene expression pat-terns suggestive of an older age than the individual’s true chronological age [23]. Similar to our study, the TMEM106B risk haplotype was further found to be as-sociated with increased inflammation and reduced neur-onal expression in these neuropathologically normal elderly individual. Contrary to our findings, however, they did not observe an effect ofTMEM106Bon gene ex-pression in cerebellar tissues. This may be related to the fact that they focused on neurologically normal individuals whereas we included a mixture of neurodegenerative
a
b
c
d
Fig. 3Interactions of top 30 highly connected genes in the synaptic transmission and immune response modules.aandbare modules in TCX.c
diseases and normal controls. To determine whether the significant modules we identified were mainly contributed by disease samples or controls, we performed additional WGCNA analyses with only cases in TCX (n= 74, 37 TT and 37 SS) or CER (n= 84, 42 TT and 42 SS), and using only controls in TCX (n= 42: 24 TT and 18 SS) or CER (n= 41: 25 TT and 16 SS). In both TCX and CER, analysis of the cases identified similar modules as we did in the full TCX and CER datasets (Additional file1: Table S6). Fur-thermore, independent analyses of each disease group: TCX-AD, TCX-PSP, CER-AD and CER-PSP all identified synaptic transmission modules that are significantly corre-lated with the TMEM106B haplotype (Additional file 1: Table S7), suggesting that the effects of the TMEM106B haplotype was not specific to disease type. Analysis of only the control samples in TCX and CER identified less mod-ules, and synaptic transmission and immune response modules were not significantly correlated with the TMEM106B haplotype in either brain region (Additional file1: Table S8). While the smaller sample size of the con-trol cohorts may have reduced our power to detect signifi-cant difference, these results suggest that the effects of TMEM106B haplotypes on the transcriptome are more pronounced in disease tissues than in healthy tissues.
Conclusions
In summary, our study demonstrates significant and partly conserved effects of the TMEM106B haplotypes on the transcriptome across multiple brain regions. It is quite remarkable that a variant which is common in the
normal population (minor allele frequency = 0.40) can have such profound effects on gene expression and cell type composition, especially since our SS and TT study groups were matched for disease phenotypes and age at death. This suggests that additional genetic and/or envir-onmental factors are likely to modulate the effect of the TMEM106B haplotypes on neurological and normal brain aging in individual human subjects. TMEM106B has only begun to be characterized since the discovery of its association to FTLD-TDP several years ago. While its function has mostly been linked to lysosome func-tions and trafficking, and recently to myelination [24], our results suggest thatTMEM106Bplays a broader role in the CNS response to pathological or age-related in-sults in multiple brain regions. Continued research into TMEM106Bs normal function and dysfunction in the context of neurodegenerative diseases will be critical and holds promise for future therapeutic strategies.
Additional file
Additional file 1:Table S1.Tissue samples available and selected for inclusion in this study.Table S2.DEGS in TCX. Positive fold change represents higher gene expression in SS than TT. Negative fold change represents lower gene expression in SS than TT.Table S3.DEGS in CER. Positive fold change represents higher gene expression in SS than TT. Negative fold change represents lower gene expression in SS than TT.
Table S4.Overlapping genes between TCX and CER based on top 500 genes with |FC|≥1.2 ranked by unadjustedpvalue.Table S5.
Enrichment of modules for their respective DEG signatures.Table S6. Significant modules identified in the TCX and CER matched cases.Table S7. Significant modules identified in separate disease groups in TCX and
a
b
CER.Table S8. Significant modules identified in the TCX and CER controls. (DOCX 54 kb)
Abbreviations
AD:Alzheimer’s disease; ALS: Amyotrophic lateral sclerosis; AMP-AD: Accelerating Medicines Partnership in Alzheimer’s Disease;
ANOVA: Analyses of variance; C9ORF72: Chromosome 9 open reading frame 72; CER: Cerebellum; CNS: Central nervous system; CON: Elderly controls; CQN: Conditional Quantile Normalization; DEG: Differentially expressed genes; FC: Fold change; FDR: False discovery rate; FTLD: Frontotemporal lobar degeneration; FTLD-TDP: Frontotemporal lobar degeneration with pathological inclusions of TDP-43; GO: Gene ontology; GRN: Progranulin; GWAS: Genome-wide association studies; LD: Linkage disequilibrium; MM: Module membership; PA: Pathologic aging; PMI: Postmortem interval; PSP: Progressive supranuclear palsy; RIN: RNA integrity number; RPKM: reads per kb per million; TCX: Temporal cortex; TMEM106B: Transmembrane protein 106; WGCNA: Weighted Gene Co-expression Network Analysis
Acknowledgements
The authors thank the patients and their families for their participation, without whom these studies would not have been possible.
Funding
This work was supported by the National Institute on Aging [RF AG051504 to N.E.T.; U01 AG046139 to N.E.T.], the National Institute of Neurological Disorders and Stroke [R01 NS080820 to N.E.T.; R35 NS097261–01 to R.R.], Mayo Clinic and Foundation [R.R. and Y.R.] and Mayo Clinic Center for Individualized Medicine [Y.R. and Y.W.A]. For samples collected through the Sun Health Research Institute Brain and Body Donation Program of Sun City, Arizona: The Brain and Body Donation Program is supported by the National Institute of Neurological Disorders and Stroke (U24 NS072026 National Brain and Tissue Resource for Parkinson’s Disease and Related Disorders), the National Institute on Aging (P30 AG19610 Arizona Alzheimer’s Disease Core Center), the Arizona Department of Health Services (contract 211002, Arizona Alzheimer’s Research Center), the Arizona Biomedical Research Commission (contracts 4001, 0011, 05–901, and 1001 to the Arizona Parkinson’s Disease Consortium), and the Michael J. Fox Foundation for Parkinson’s Research. The funding body did not play any role in the design of the study and collection, analysis or interpretation of data and in writing the manuscript.
Availability of data and materials
The data that support the findings of this study are available through the Accelerating Medicines Partnership in Alzheimer’s Disease (AMP-AD) Knowledge Portal athttps://doi.org/10.7303/syn3163039andhttps://doi.org/ 10.7303/syn5049298. Access to the data is controlled by the institutional review board (IRB) at the Mayo Clinic.
Authors’contributions
YR, YWA and RR designed the study. YR and RR wrote the manuscript. YR and MVB performed data analysis. MA, MMC, JR, XW and NET provided intellectual input, reviewed and edited the manuscript. DWD and TGB provided tissue samples and associated data. All authors read and approved the final manuscript.
Ethics approval and consent to participate
This study uses autopsy material only and was approved by the Mayo Clinic institutional review board (IRB).
Competing interests
The authors declare that they have no competing interests.
Publisher’s Note
Springer Nature remains neutral with regard to jurisdictional claims in published maps and institutional affiliations.
Author details
1
Department of Health Sciences Research, Mayo Clinic, Jacksonville, FL, USA. 2Department of Neuroscience, Mayo Clinic, Jacksonville, FL, USA.3Civin
Laboratory for Neuropathology, Banner Sun Health Research Institute, Sun City, AZ, USA.4Department of Neurology, Mayo Clinic, Jacksonville, FL, USA.
Received: 12 April 2018 Accepted: 25 June 2018
References
1. Avila J. Common mechanisms in neurodegeneration. Nat Med. 2010;16: 1372.
2. Van Deerlin VM, Sleiman PMA, Martinez-Lage M, Chen-Plotkin A, Wang LS, Graff-Radford NR, et al. Common variants at 7p21 are associated with frontotemporal lobar degeneration with TDP-43 inclusions. Nat Genet. 2010; 42:234–9.
3. Finch N, Carrasquillo MM, Baker M, Rutherford NJ, Coppola G, DeJesus-Hernandez M, et al. TMEM106B regulates progranulin levels and the penetrance of FTLD in GRN mutation carriers. Neurology. 2011;76:467. 4. Nicholson AM, Rademakers R. What we know about TMEM106B in
neurodegeneration. Acta Neuropathol. 2016;132:639–51.
5. Cruchaga C, Graff C, Chiang HH, Wang J, Hinrichs AL, Spiegel N, et al. Association of tmem106b gene polymorphism with age at onset in granulin mutation carriers and plasma granulin protein levels. Arch Neurol. 2011;68:581–6.
6. Gallagher MD, Suh E, Grossman M, Elman L, McCluskey L, Van Swieten JC, et al. TMEM106B is a genetic modifier of frontotemporal lobar degeneration with C9orf72 hexanucleotide repeat expansions. Acta Neuropathol. 2014; 127:407–18.
7. van Blitterswijk M, Mullen B, Nicholson AM, Bieniek KF, Heckman MG, Baker MC, et al. TMEM106B protects C9ORF72 expansion carriers against frontotemporal dementia. Acta Neuropathol. 2014;127:397–406. 8. Murray ME, Cannon A, Graff-Radford NR, Liesinger AM, Rutherford NJ, Ross
OA, et al. Differential clinicopathologic and genetic features of late-onset amnestic dementias. Acta Neuropathol. 2014;128:411–21.
9. Nelson PT, Wang WX, Partch AB, Monsell SE, Valladares O, Ellingson SR, et al. Reassessment of risk genotypes (GRN, TMEM106B, and ABCC9 variants) associated with hippocampal sclerosis of aging pathology. J Neuropathol Exp Neurol. 2015;74:75–84.
10. Vass R, Ashbridge E, Geser F, Hu WT, Grossman M, Clay-Falcone D, et al. Risk genotypes at TMEM106B are associated with cognitive impairment in amyotrophic lateral sclerosis. Acta Neuropathol. 2011;121: 373–80.
11. Rutherford NJ, Carrasquillo MM, Li M, Bisceglio G, Menke J, Josephs KA, et al. TMEM106B risk variant is implicated in the pathologic
presentation of Alzheimer disease. Neurology. 2012;79:717–8. 12. Yu L, De Jager PL, Yang J, Trojanowski JQ, Bennett DA, Schneider JA. The
TMEM106B locus and TDP-43 pathology in older persons without FTLD. Neurology. 2015;84:927.
13. Nicholson AM, Finch NA, Wojtas A, Baker MC, Perkerson RB, Castanedes-Casey M, et al. TMEM106B p.T185S regulates TMEM106B protein levels: implications for frontotemporal dementia. J Neurochem. 2013;126:781–91. 14. Gallagher MD, Posavi M, Huang P, Unger TL, Berlyand Y, Gruenewald AL,
et al. A dementia-associated risk variant near TMEM106B alters chromatin architecture and gene expression. Am J Hum Genet. 2017;101:643–63. 15. Dickson DW, Crystal HA, Mattiace LA, Masur DM, Blau AD, Davies P, et al.
Identification of normal and pathological aging in prospectively studied nondemented elderly humans. Neurobiol Aging. 1992;13:179–89. 16. Allen M, Carrasquillo MM, Funk C, Heavner BD, Zou F, Younkin CS, et al.
Human whole genome genotype and transcriptome data for Alzheimer’s and other neurodegenerative diseases. Scientific Data. 2016;3:160089. 17. Allen M, Wang X, Burgess JD, Watzlawik J, Serie DJ, Younkin CS, et al.
Conserved brain myelination networks are altered in Alzheimer's and other neurodegenerative diseases. Alzheimers Dement. 2018;14:352–66. 18. Langfelder P, Horvath S. WGCNA: an R package for weighted correlation
network analysis. BMC Bioinformatics. 2008;9:559.
19. Hu Z, Chang YC, Wang Y, Huang CL, Liu Y, Tian F, et al. VisANT 4.0: integrative network platform to connect genes, drugs, diseases and therapies. Nucleic Acids Res. 2013;41:W225–31.
20. Lui H, Zhang J, Makinson SR, Cahill MK, Kelley KW, Huang HY, et al. Progranulin deficiency promotes circuit-specific synaptic pruning by microglia via complement activation. Cell. 2016;165:921–35.
22. Premi E, Formenti A, Gazzina S, Archetti S, Gasparotti R, Padovani A, et al. Effect of TMEM106B polymorphism on functional network connectivity in asymptomatic GRN mutation carriers. JAMA Neurology. 2014;71:216–21. 23. Rhinn H, Abeliovich A. Differential aging analysis in human cerebral cortex
identifies variants in TMEM106B and GRN that regulate aging phenotypes. Cell Systems. 2017;4:404–15.