R E S E A R C H
Open Access
Development of a metric for tracking and
comparing population health based on the
minimal generic set of domains of
functioning and health
Cornelia Oberhauser
1*, Somnath Chatterji
4, Carla Sabariego
1and Alarcos Cieza
1,2,3Abstract
Background:The following minimal set of valid health domains for tracking the health of both clinical and general populations has recently been proposed: 1) energy and drive functions, 2) emotional functions, 3) sensation of pain, 4) carrying out daily routine, 5) walking and moving around, and 6) remunerative employment. This study investigates whether these domains can be integrated into a sound psychometric measure to adequately assess, compare, and monitor the health of populations.
Methods:Data from waves 3 and 4 of the English Longitudinal Study of Ageing (ELSA) were analysed (N= 9779 and 11,050). From ELSA, 12 items operationalizing the six domains of the minimal generic set were identified. The Partial Credit Model (PCM) was applied to create a health metric based on these items. The Item Response Theory (IRT) model assumptions of unidimensionality, local independence, and monotonicity were evaluated, and Differential Item Functioning (DIF) was examined for sex and age groups. The psychometric properties of: 1) internal consistency reliability, 2) construct validity, and 3) sensitivity to change were evaluated to establish the final health metric.
Results:IRT model assumptions were found to be fulfilled. None of the items showed DIF by sex or age group. The final health metric demonstrated sound psychometric properties.
Conclusions:The health metric developed in this study–based on the domains of the minimal generic set–proved useful for a wide range of health comparisons, especially for different groups of persons, and both cross-sectionally and over time. Monitoring health over time provides especially useful information for health care providers and health policymakers and both in clinical settings and the general population. The developed health metric offers a wide range of applications, including comparisons of levels of health among different groups in the general population, clinical populations, and even populations within and across different countries.
Keywords:Minimal generic set, Functioning, Health, Item Response Theory, Partial Credit Model, Health metric, Psychometric properties, Internal consistency reliability, Construct validity, Sensitivity to change
* Correspondence:[email protected]
1Department of Medical Informatics, Biometry and Epidemiology—IBE, Chair
for Public Health and Health Services Research, Research Unit for Biopsychosocial Health, LMU Munich, Munich, Germany Full list of author information is available at the end of the article
Background
Measuring the health of populations in a conceptually and cross-culturally valid manner is important from different perspectives. From the point of view of epide-miologists, sound measurement of health is essential both to estimate the overall burden of ill health in spe-cific populations and to compare the relative impact of specific health problems across different groups of popu-lations at risk [1]. From the point of view of policy-makers, it is essential to monitor the effectiveness of health care [2] and, generally, to provide evidence for setting goals, implementing, and monitoring public health policy [3].
One frequently used approach to measure the health of populations is to generate a composite score of overall health, taking into consideration disease severity in terms of the impact of health conditions on individuals. In this approach, a set of meaningful domains of func-tioning, such as walking, self-care, memory, and pain, is selected and used to produce a score. This approach, however, does not account for comparability per se. If the domains of functioning included in studies and sur-veys and the method of creating a corresponding com-posite score vary largely, comparability is compromised.
A recently published psychometric study addresses this challenge by using the International Classification of Functioning, Disability and Health (ICF) [4]. A univer-sally valid minimal set of domains of functioning to track the health of both clinical and general populations was proposed [5]. This“minimal generic set of domains of functioning and health” includes six ICF domains: 1) energy and drive functions, 2) emotional functions, 3) sensation of pain, 4) carrying out daily routine, 5) mobil-ity (including walking and moving around), and 6) remu-nerative employment. These domains from the minimal generic set are closely related to the World Health Sur-vey (WHS) domains, which in addition contain cogni-tion and vision [6, 7]. However, while the WHS domains were developed to capture population health states and to quantify health using the most parsimonious set of domains that also intuitively match individual notions of health and are used in general population survey instru-ments, there have been no attempts outside of WHO to investigate the relevance of this set of domains across different populations, and, in particular, in the clinical population [5]. In contrast, the minimal generic set was developed taking both data from the general population and from clinical populations into account [5].
This selection of domains does not constitute an in-strument and these domains can be operationalized in very different ways in different studies. Therefore, our approach can be applied, a posteriori, to already existing data in an ex post harmonization exercise across mul-tiple data sources. Additionally, the inclusion of such a
generic set of domains in other data sources such as electronic health records, and when overlapped with population health surveys that contain these domains, could allow the quantification of health in a given population that spans the full spectrum from community dwelling to patient populations. In comparison to WHODAS 2.0, an instrument developed by WHO applicable in both clinical and general population settings, the minimal generic set does not only focus on activities and participation domains, but also contains body functions [8].
The authors understand this set as a starting point to address the important challenge of achieving compar-ability of data across studies and countries in health measurement. They stress the necessity to confirm whether this set can be used to develop a health metric useful for assessing and comparing trends in population health [5].
Furthermore, this generic set is very brief and made up of domains of functioning addressed in questions posed in most health and disability surveys, including surveys in which no standardized questionnaire, like WHODAS 2.0, has been used. It demonstrates that a psychometrically sound metric with cardinal properties can be constructed to monitor a health status over time using existing data. A metric with cardinal properties does not only register the presence or absence of change, but also quantifies the extent of that change. Health in-equalities and their extent could also be identified, as well as the effects of non-fatal health outcomes on over-all population health by aggregating individual levels over the population.
This study aims to investigate whether data on the do-mains of the minimal generic set can be integrated into a psychometrically sound health metric. The specific aims are to evaluate the 1) internal consistency reliabil-ity, 2) construct validreliabil-ity, and 3) sensitivity to change of this metric.
Methods
Data
Data from the English Longitudinal Study of Ageing (ELSA) was used for the analysis. ELSA is a biannual, longitudinal, and nationally representative survey that focuses on adults aged 50 and over living in private households in England [9]. More concretely, data from waves 3 and 4 collected in 2006–2007 and 2008–2009 were analysed (N= 9779 and 11,050). Depending on the requirements for each specific aim, the combined data, wave-4 data, or the overlapping data (i.e., persons whose data was available for both waves 3 and 4) were used.
drive functions, emotional functions, walking and moving around, and remunerative employment, the questions directly reflected the content of the respective domains. Therefore, the original variables were used in the analysis. For sensation of pain, the first question (“often troubled with pain”) served as a filter for the second (“severity of the pain”), which means that the second question was only asked if the first was answered “yes.” Therefore, these two questions were summarized into one item with response options“not often troubled with pain,” “mild,” “moderate,”and“severe”pain.
A different strategy was needed for the domain“ carry-ing out daily routine,” as the individual questions as framed in the survey did not reflect that domain. There-fore, two sum scores were created. One addresses activ-ities of daily living (ADLs), including dressing, washing, eating, getting in and out of bed, and using the toilet, with values ranging from none to five limitations. The other score sums up instrumental activities of daily liv-ing (IADLs), includliv-ing difficulty usliv-ing a map, preparliv-ing a hot meal, shopping for groceries, taking medications, doing housework, and managing money, with values ranging from none to six limitations.
The response options for these selected items were coded or recoded with higher values consistently reflect-ing worse health.
Analysis
Descriptive statistics
Descriptive statistics were used to characterize the study population.
Development of the health metric
The Partial Credit Model (PCM) was applied to develop a health metric [10, 11]. The PCM or Polytomous Rasch Model is a unidimensional Item Response Theory (IRT) model that can be applied to a set of ordinal, polyto-mous items [12]. Based on the model, a latent scale is defined on which both persons and items can be located. For persons, their location is called “person ability,” while for items, the terms“item location” or“item diffi-culty”are used. In addition, item thresholds which indi-cate the locations on the latent trait where the item best discriminates between persons are available for each item.
Before the PCM was applied, the model assumptions evaluated were: unidimensionality, local independency, and monotonicity.
Unidimensionality [13] was evaluated with bifactor analysis [14–16], which assumes the presence of a single general factor and multiple independent group factors. If all items load high on the general factor score and the factor loadings on the general factor score exceed those of the group factors, an underlying unidimensional
latent trait can be assumed. The number of factors con-sidered in the bifactor analysis was determined based on permuted parallel analysis [17]. Bifactor analysis was applied on the polychoric correlation matrix [18, 19], which constitutes a measure of association between two latent continuous variables underlying two measured or-dinal variables.
Local independence [13] was examined based on the residual correlations among items resulting from a single-factor factor analysis [20]. The PCM was then estimated with and without the flagged possible local dependent items (residual correlations higher than 0.2) to see if results were robust to questions’ dependencies [21]. If the item thresholds fundamentally change when considering local dependent items in the same model, all but one of them must be excluded.
Monotonicity was studied for each item by examining graphs of the item’s distribution conditional on mean “rest-scores”[13] calculated for each person as the aver-age raw score of all the remaining non-missing items. If there is a consistent trend that persons with higher mean “rest-scores” are more likely to have more problems in the selected item, monotonicity can be assumed. Items violating the monotonicity assumption need to be excluded from the model.
After the evaluation of model assumptions, the PCM was fitted. If thresholds were unordered, the response options of the affected items were collapsed until all thresholds were in the correct order.
To examine whether persons from different groups with the same (latent) health level have a different prob-ability of giving a certain response to an item, differential item functioning (DIF) was tested for gender and age groups (< = 64 and >64) using iterative hybrid ordinal logistic regression with change in McFadden’s pseudo R-squared measure (above 0.02) as a DIF criterion [22, 23]. Items showing DIF must be split into two separate items for the two groups and the model is re-estimated.
Finally, persons’ health levels were linearly trans-formed into a health metric ranging from 0 (worst health) to 100 (best health), which facilitates judging the relevance of differences between groups, e.g., with and without health conditions and change over time.
According to the specific aims of this study, for the final health metric the following psychometric properties were evaluated: 1) internal consistency reliability, 2) construct validity, and 3) sensitivity to change.
Internal consistency reliability was assessed based on different measures. For each item, the inter-item correl-ation and the item-to-total correlcorrel-ation [25] were calcu-lated using polychoric correlations. Cronbach’s alpha [26], McDonald’s omega hierarchical, and McDonald’s omega total [27] were used for the complete item set. All these measures can range from 0 to 1, with higher values indicating higher reliability.
Construct validity was assessed for wave-4 data based on four different criteria [25]:
Convergent validity was analyzed based on the Spear-man correlation of the health metric with other health-related variables, like the general health question and a question on long-standing limiting illnesses. A high correlation indicates high convergent validity. Discrimin-ant validity was analysed based on the Spearman correl-ation of the health metric with variables, like life satisfaction, the number of falls within the last year and age that are not direct assessments of health levels. A low correlation indicates high discriminant validity.
Concurrent validity was assessed based on a linear additive model [28] which predicts the value on the health metric based on sex, age, education, income, and health conditions as independent variables. Age is mod-eled in a flexible, non-parametric way using P-splines. Concurrent validity can be judged as high if persons with health conditions have a lower predicted level of health compared to those without the respective health conditions and persons with severe health conditions on average have lower predicted health levels than those with very mild health conditions. To objectively judge the severity of the prototypical health conditions, the disability weights estimated for 220 unique health states within the Global Burden of Disease Study 2010 (GBD 2010) [29] served as a reference.
Predictive validity was analyzed based on predicting mortality from 2008 to 2012. For this purpose, four additive logit-models [28] were compared, each contain-ing the covariates sex, age, education, income, and health conditions (as above). Model 1 contains only these independent variables. Model 2 also contains the health metric, while model 3 additionally contains the general-health question. Model 4 contains all the covari-ates, as well as the general health question and the health metric. Age and the health metric are modeled in
a flexible, non-parametric way using P-splines. For all these models, different model-fit criteria are compared based on: the adjusted R-square, the percentage of explained deviance, and the Akaike information criterion (AIC) [28]. If the inclusion of the health metric improves model fit, this indicates predictive validity.
Sensitivity to change was evaluated for the subsample on which data were available for both wave 3 and 4. A linear additive model [28] was fitted with the value of the health metric in wave 4 as a dependent variable and incidence of health conditions since wave 3 as independ-ent variables, while controlling for the value of the health metric in wave 3 and additional covariates. If the incidence of severe health conditions has a high negative impact on the expected value of the health metric while the incidence of less severe health conditions has a smaller effect, the health metric shows high sensitivity to change.
All analyses were performed with R version 2.15.2 [30].
Results
Descriptive statistics
Descriptive statistics of the study population are provided in Table 1.
Development of the health metric
When testing the IRT model assumptions for the com-bined dataset, permuted parallel analysis indicated the presence of two factors. In the bifactor analysis, the gen-eral factor accounted for 50.8 % of the variance. Its fac-tor loadings (ranging from 0.55 to 0.85) exceeded those of the group factors for all items, supporting the as-sumption of unidimensionality. High residual correla-tions were found for “feeling everything was an effort” and “could not get going” in the domain “energy and drive functions”and for feeling“depressed,” “sad,”or be-ing “happy” in “emotional functions.” When keeping only one of the local dependent variables for each do-main (“feeling everything was an effort” and “ de-pressed”), sensitivity analyses showed similar thresholds compared to the model with all items included (Pearson correlation of 0.99), which indicates that all items can be kept in the final model. Monotonicity was graphically confirmed for all items.
All items reasonably fitted the PCM. As presented in Additional file 2, the outfit and infit mean squares were rather close to one for most of the items. Furthermore, the curves in Additional file 3 confirm that the observed response frequencies (for respond-ing above a certain threshold) for groups of persons with close ability estimates are quite close to the expected probabilities, especially for items with mean square statistics further away from 1. In most cases, the curve of observed frequencies is steeper, which corresponds to the definition of overfit.
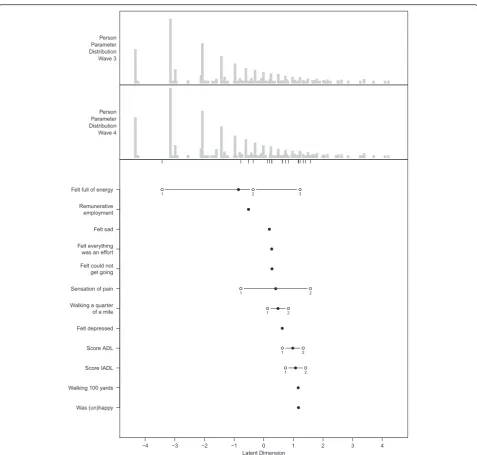
The results for the final PCM are visualized in the person-item map in Fig. 1. In the top part of the figure, the distribution of persons’ health levels is shown separately for wave 3 and wave 4. The pattern of persons’ levels is quite similar in the two waves, with values ranging from −4.33 to 4.21. Item locations and item thresholds are presented in the bottom part of the figure. Item locations range from −0.85 to 1.17, while item thresholds range from −3.43 to 1.58.
The items are well suited to differentiate between persons’ levels in the medium range of health. They do not, however, differentiate well between the large proportion of very healthy persons (to the left) and the small proportion of extremely unhealthy persons (to the right).
Internal consistency reliability
Table 2 shows the results of internal consistency reliabil-ity. The values of the different measures yield consistent results when calculated for each of the two waves separ-ately and for the combined dataset. Inter-item correl-ation is high, but has high variability. Item-to-total correlation is higher with less variation. Cronbach’s alpha and McDonald’s omega total are quite close to 1. McDo-nald’s omega hierarchical is lower (with values around 0.60), but of reasonable size [27]. Therefore, all values indicate high internal consistency reliability.
Construct validity
The Spearman correlation of the health metric with gen-eral health and long-standing illness is comparably high (−0.64 and −0.59), indicating high convergent validity. The Spearman correlation of the health metric with life satisfaction is lower (−0.36) and lowest for the number of falls (−0.25) and age (−0.23). These low correlations with the health metric indicate high discriminant validity since these items are not a direct measure of health sta-tus. Boxplots visualizing the relationship of the health metric with the five above-mentioned variables are pre-sented in Additional file 4. The complete correlation matrix is presented in Additional file 5.
The linear additive model with the health metric as a dependent variable and sex, age, education, income, and
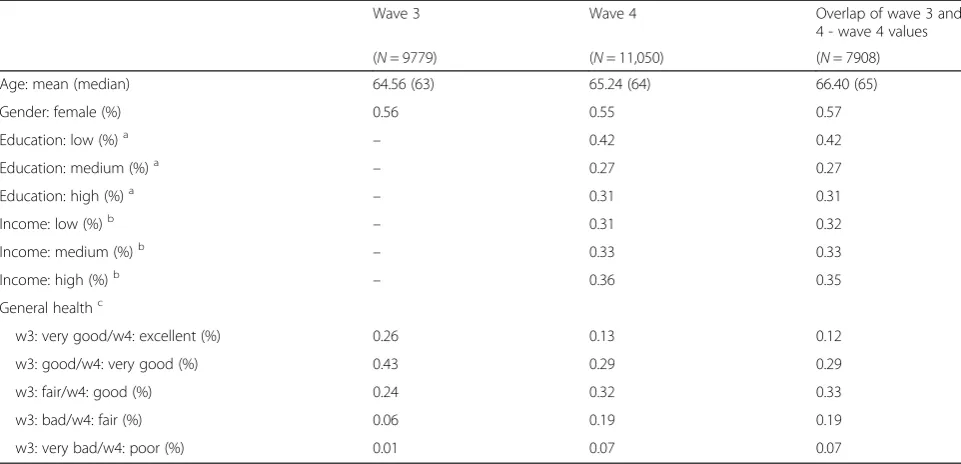
Table 1Descriptive statistics of wave-3 and wave-4 data and their overlap
Wave 3 Wave 4 Overlap of wave 3 and
4 - wave 4 values
(N= 9779) (N= 11,050) (N= 7908)
Age: mean (median) 64.56 (63) 65.24 (64) 66.40 (65)
Gender: female (%) 0.56 0.55 0.57
Education: low (%)a – 0.42 0.42
Education: medium (%)a – 0.27 0.27
Education: high (%)a – 0.31 0.31
Income: low (%)b – 0.31 0.32
Income: medium (%)b – 0.33 0.33
Income: high (%)b – 0.36 0.35
General healthc
w3: very good/w4: excellent (%) 0.26 0.13 0.12
w3: good/w4: very good (%) 0.43 0.29 0.29
w3: fair/w4: good (%) 0.24 0.32 0.33
w3: bad/w4: fair (%) 0.06 0.19 0.19
w3: very bad/w4: poor (%) 0.01 0.07 0.07
a
The education division is from a level lower than“O-level”or equivalent (typically 0–11 years of schooling), qualified to a level lower than“A-level”or equivalent (typically 12–13 years), and a higher qualification (typically >13 years)
b
Income groups were formed by dividing equalised total income into three approximately equally sized groups based on the sample
c
The response options for the general health question differed for the two waves, leading to a very different response pattern.“w3”and“w4”are abbreviations for wave 3 and wave 4, respectively
Fig. 1Person-item map for the final PCM. The top part displays the distribution of persons’health levels separately for wave 3 and wave 4. The bottom part shows the item locations (bullets) and item thresholds (circles) for the 12 items. To facilitate the comparison of item thresholds with persons’abilities, the item thresholds are additionally plotted below the persons’distributions (of wave 4) by small vertical lines
Table 2Results on internal consistency reliability
Measure Wave 3 Wave 4 Waves 3 and 4 combined
Inter-item correlation: mean [min; max] 0.54 [0.23; 0.90] 0.53 [0.24; 0.92] 0.53 [0.25; 0.91]
Item-to-total correlation: mean [min; max] 0.76 [0.61; 0.84] 0.75 [0.59; 0.85] 0.75 [0.60; 0.84]
Cronbach’s alpha 0.93 0.93 0.93
McDonald’s omega hierarchical 0.60 0.61 0.61
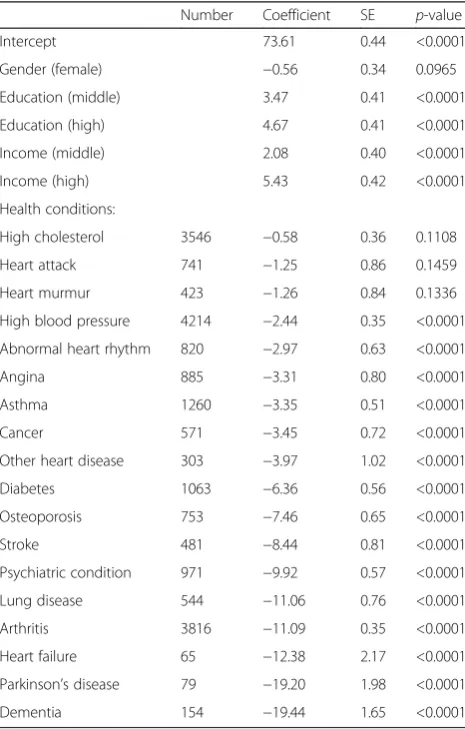
health conditions as independent variables indicates high concurrent validity. Detailed results are pre-sented in Table 3 and Fig. 2. As expected, all the listed health conditions have a negative effect on the health metric, with more severe health conditions, such as lung disease, arthritis, heart failure, Parkin-son's disease, and dementia, showing a larger nega-tive effect. This ranking is, where comparison is possible, in agreement with the disability weights estimated for 220 unique health states used in GBD 2010 [29].
Figure 2 shows the nonlinear effect of age on the health metric together with its 95 % confidence intervals. From an age of 68 on, age has an increasingly negative impact on health levels.
Predictive validity
Table 4 shows the results regarding the predictive valid-ity of the health metric. For wave-4 data, four different additive logit models predicting mortality are compared based on three model-fit criteria. When comparing the four models, all three criteria indicate higher model fit for those models with the health metric included (higher adjusted R-square, higher percentage of deviance ex-plained, smaller AIC). This means that the health metric has a higher predictive validity for mortality than the
Table 3Results on concurrent validity–linear additive model predicting the value of the health metric
Number Coefficient SE p-value
Intercept 73.61 0.44 <0.0001
Gender (female) −0.56 0.34 0.0965
Education (middle) 3.47 0.41 <0.0001
Education (high) 4.67 0.41 <0.0001
Income (middle) 2.08 0.40 <0.0001
Income (high) 5.43 0.42 <0.0001
Health conditions:
High cholesterol 3546 −0.58 0.36 0.1108
Heart attack 741 −1.25 0.86 0.1459
Heart murmur 423 −1.26 0.84 0.1336
High blood pressure 4214 −2.44 0.35 <0.0001
Abnormal heart rhythm 820 −2.97 0.63 <0.0001
Angina 885 −3.31 0.80 <0.0001
Asthma 1260 −3.35 0.51 <0.0001
Cancer 571 −3.45 0.72 <0.0001
Other heart disease 303 −3.97 1.02 <0.0001
Diabetes 1063 −6.36 0.56 <0.0001
Osteoporosis 753 −7.46 0.65 <0.0001
Stroke 481 −8.44 0.81 <0.0001
Psychiatric condition 971 −9.92 0.57 <0.0001
Lung disease 544 −11.06 0.76 <0.0001
Arthritis 3816 −11.09 0.35 <0.0001
Heart failure 65 −12.38 2.17 <0.0001
Parkinson’s disease 79 −19.20 1.98 <0.0001
Dementia 154 −19.44 1.65 <0.0001
Regression coefficients, standard errors (SE), andp-values resulting from the linear additive model predicting the value of the health metric for wave-4 data. For the health conditions, the number of cases with the respective health condition is additionally provided. Health conditions are sorted by increasing effect. The nonlinear effect of age is shown in Fig.2
The reference categories are male, low education, low income, and not having the respective health condition
30 40 50 60 70 80 90
−20
−15
−10
−5
0
5
Age
Fig. 2Results on concurrent validity–nonlinear effect of age. The nonlinear effect of age (solid line) and 95 % confidence intervals (dashed lines) resulting from the linear additive model predicting the value of the health metric for wave-4 data. As there are only a small number of observations below the age of 50, there is a lot of uncertainty in the estimation in this range
Table 4Results on predictive validity–comparison of model-fit criteria for four different models
Adjusted R-square
Percentage of deviance explained
AIC
Model 1 including only covariates
15.2 23.6 3362
Model 2 including covariates and the health metric
17.5 26.2 3251
Model 3 including covariates and the general health question
16.7 25.5 3285
Model 4 including covariates, the general health question and the health metric
17.9 26.6 3240
general health question and that it still has predictive validity when added to the general health question.
Sensitivity to change
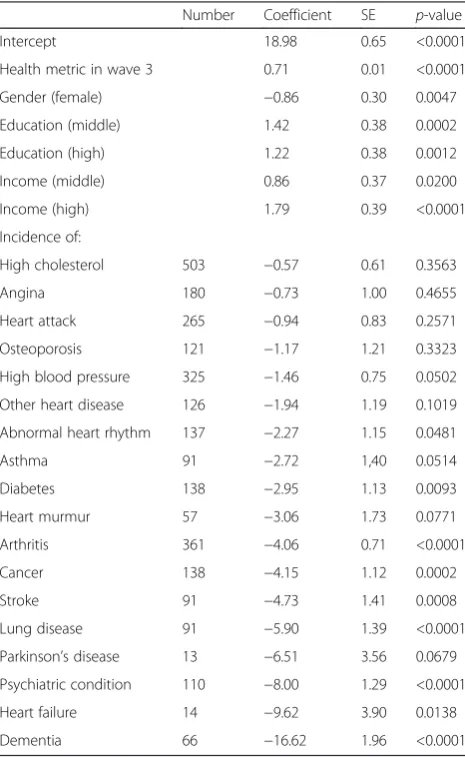
Table 5 and Additional file 6 show the results from the linear additive model predicting the value of the health metric in wave 4 based on the incidence of health conditions within the last two years when controlling for the value of the health metric in wave 3 and other covariates. Table 5 shows that the inci-dence of any of these health conditions has a negative effect on the value of the health metric. The inci-dence of severe health conditions, often without
effective therapy and progressing rapidly, have a large negative effect, while incidence of mild health condi-tions or those with effective therapy have a smaller negative impact. Therefore, these results indicate high sensitivity to change. Additional file 6 shows the non-linear effect of age from this model. However, age was only used as a control variable here.
Discussion
In this study, we demonstrated that it is possible to de-velop a psychometrically sound metric useful to track and compare population health based on a recently pro-posed minimal generic set of domains of functioning valid in both the clinical and the general populations. This metric showed high internal consistency reliability, high construct validity, and high sensitivity to change. This metric of health has a huge potential, as it contains health domains usually included in health surveys cur-rently conducted all over the world, which means that our approach can be applied, a posteriori, to many already existing surveys. Therefore, such a metric en-ables health comparisons even for studies in which no standardized instrument, like WHODAS 2.0, was, a priori, included.
The applicability of the PCM on the data was exam-ined in a rigorous manner. All three model assumptions of IRT analysis, i.e., unidimensionality, local indepen-dency, and monotonicity, were formally investigated and found to be fulfilled. None of the items showed DIF by gender or age groups, and all items reasonably fitted the PCM.
The developed metric differentiated well between per-sons in the medium range of health, but less precisely at the lower and upper ends. Its creation constitutes a trade-off between two conflicting aims: on the one hand, maximal measurement precision is desired to permit fine distinctions in persons’health levels and to increase its potential uses, both for group comparisons and com-parisons over time. On the other hand, the metric should be based on an extremely parsimonious set of domains that can be integrated at low cost, both with regards to financial resources and (interviewing) time, into any already existing or newly developed survey or questionnaire. Only if the metric is based on a frugal set of domains will its domains be frequently implemented in studies. This, in turn, constitutes the prerequisite for the subsequent application of the metric for comparison purposes. Therefore, loss in measurement precision, es-pecially at the margins of the continuum, must be ac-cepted for reasons of practicability. Also from a public health perspective, a good differentiation in the middle range of the continuum gains special relevance since persons in that range of health are at risk of further de-terioration, while little change in health state is expected
Table 5Results on sensitivity to change–linear additive model predicting the value of the health metric
Number Coefficient SE p-value
Intercept 18.98 0.65 <0.0001
Health metric in wave 3 0.71 0.01 <0.0001
Gender (female) −0.86 0.30 0.0047
Education (middle) 1.42 0.38 0.0002
Education (high) 1.22 0.38 0.0012
Income (middle) 0.86 0.37 0.0200
Income (high) 1.79 0.39 <0.0001
Incidence of:
High cholesterol 503 −0.57 0.61 0.3563
Angina 180 −0.73 1.00 0.4655
Heart attack 265 −0.94 0.83 0.2571
Osteoporosis 121 −1.17 1.21 0.3323
High blood pressure 325 −1.46 0.75 0.0502
Other heart disease 126 −1.94 1.19 0.1019
Abnormal heart rhythm 137 −2.27 1.15 0.0481
Asthma 91 −2.72 1,40 0.0514
Diabetes 138 −2.95 1.13 0.0093
Heart murmur 57 −3.06 1.73 0.0771
Arthritis 361 −4.06 0.71 <0.0001
Cancer 138 −4.15 1.12 0.0002
Stroke 91 −4.73 1.41 0.0008
Lung disease 91 −5.90 1.39 <0.0001
Parkinson’s disease 13 −6.51 3.56 0.0679
Psychiatric condition 110 −8.00 1.29 <0.0001
Heart failure 14 −9.62 3.90 0.0138
Dementia 66 −16.62 1.96 <0.0001
Regression coefficients, standard errors (SE), andp-values resulting from the linear additive model predicting the value of the health metric in wave 4 based on the incidence of health conditions within the last two years and controlled for the value of the health metric in wave 3 and other covariates. For the health conditions, the number of cases with incidence in the last two years is provided. Health conditions are sorted by increasing effect. The nonlinear effect of age is shown in Additional file6
for those at the margins–which does not mean that in-formation on the margins is not relevant for policy-makers. However, this does not imply that only questions addressing the six domains of the generic set should be used in every study. For specific purposes, e.g., in clinical studies, additional questions addressing other domains can be added, as has been previously pro-posed [5].
In addition to the validity criteria already mentioned, the validity of the metric is supported by further findings. As can be seen from the linear additive model to evaluate concurrent validity (Table 3), all of the well-known gradients of health–age, education, and income levels – are captured by the health metric [31]. The well-documented gender differences in health are also captured by the metric [31, 32]. Women are slightly worse off than men, even when several covariates are taken into account.
The health metric makes it possible to compare the health of populations at the same point in time and over a time period. Subgroups of the sample can be compared based on the results of the linear additive model used to examine concurrent validity. For example, persons with psychiatric conditions are expected to have about 10 fewer points on the metric, i.e., worse health than per-sons without psychiatric conditions when assuming that all other characteristics are the same. The distribution of health levels for wave 3 and wave 4 samples is visualized in the top part of the person-item map (Fig. 1). Further-more, in the linear additive model used to examine sen-sitivity to change, the health status in wave 3 is used to explain the health status in wave 4, taking the incidence of specific health conditions into account.
In this study, the ELSA data was used for several reasons. It contained questions to operationalize all six domains from the minimal generic set. In addition to the questions on functioning, it contained information on socio-economic status, health-related variables and detailed information on health conditions. Finally, longi-tudinal data were available, which permitted the creation of the health metric for two waves, making comparisons over time possible. Because of all these properties, the ELSA data enabled all the analyses necessary to examine the psychometric properties of the developed health metric. From our experience with this longitudinal cohort study, we assume that similar analyses can be carried out in a straightforward manner with further existing surveys and studies.
There are some limitations of this study. Only one exemplary dataset, ELSA, was analyzed. England is a high-resource Western country and not representative of the general population worldwide. In addition, the focus of ELSA was on persons aged 50 and above and not on the general population without age restrictions.
As the analyses were restricted to a single data source, the investigated set of questions was limited. But pro-posing questions is beyond the scope of the study. If slightly different content is asked in the questions or dif-ferent response options are used, results might differ. Therefore, the results shown need to be validated in further studies using data from different populations with regards to country, age group, and setting. Add-itionally, as shown in our analyses, the set of items in-cluded in this metric does not allow discriminations at both ends of the distribution in the general population. In order to allow for more fine-grained separation at these levels of health, additional domains or items, possibly with more fine-grained response options, will be necessary to separate individuals who are relatively healthy or those that are in very poor levels of health. Finally, in the regression models, an additive effect was assumed for the different health conditions. As there is a huge number of possible interaction terms and several health conditions were rather rare, we decided not to include interaction terms to obtain a more stable and better interpretable model. Nonetheless, the same principle of constructing a metric using the approach we have used would hold true.
Conclusions
The health metric developed in this study–based on the domains of the minimal generic set–proved useful for a wide range of health comparisons, especially for different groups of persons, and both cross-sectionally and over time. Monitoring health over time provides especially use-ful information for health care providers and health policymakers and both in clinical settings and the general population. Such a health metric offers a wide range of applications, including comparisons of levels of health among different groups in the general population, clinical populations, and even populations within and across dif-ferent countries. Yet, for difdif-ferent countries and settings, the metric must be systematically evaluated.
Additional files
Additional file 1:Questions used to operationalize the six domains of the minimal generic set of functioning and health. Questions used to operationalize the six domains of the minimal generic set and items created based on these questions. When more than one question was used to create an item, the name of the created summary measure is provided. (DOC 42 kb)
Additional file 2:Item locations, item thresholds, and outfit and infit mean squares (DOC 40 kb)
Additional file 4:Boxplots on convergent and discriminant validity. Boxplots of the health metric by general health, long-standing illness, life satisfaction, grouped number of falls, and age groups. Boxes are drawn with widths proportional to the square-roots of the number of observations in the groups, i.e., the smaller the box, the smaller the group size. Groups with a very small number of observations were merged. (PDF 9 kb)
Additional file 5:Correlation matrix on convergent and discriminant validity. Spearman correlation matrix for the health metric and additional health-related variables for wave-4 data. General health and long-standing illness are more related to health (relevant for convergent validity), while life satisfaction, the number of falls, and age are less related to health (relevant for discriminant validity). (DOC 31 kb)
Additional file 6:Results on sensitivity to change–nonlinear effect of age. Nonlinear effect of age (solid line) and 95 % confidence intervals (dashed lines) resulting from the linear additive model predicting the value of the health metric in wave 4 based on the incidence of health conditions within the last two years, when controlling for the value of the health metric in wave 3 and other covariates. (PDF 5 kb)
Competing interests
The authors declare that they have no competing interests.
Authors’contributions
CO and AC conceived of the study and its design and drafted the manuscript. CO carried out the statistical analyses. SC and CS critically revised the manuscript. All authors read and approved the final manuscript.
Funding
This study was supported by a R21 grant from the National Institute on Aging, National Institutes of Health (1R21AG034263) to SC.
Author details
1
Department of Medical Informatics, Biometry and Epidemiology—IBE, Chair for Public Health and Health Services Research, Research Unit for
Biopsychosocial Health, LMU Munich, Munich, Germany.2Faculty of Social and Human Sciences, School of Psychology, University of Southampton, Southampton, UK.3Swiss Paraplegic Research, Nottwil, Switzerland.4Surveys, Measurement and Analysis, Department of Measurement and Health Information Systems, World Health Organization, Geneva, Switzerland.
Received: 4 January 2016 Accepted: 5 May 2016
References
1. World Health Organization. World report on disability. Geneva: World Health Organization; 2011.
2. Salomon JA, Mathers CD, Chatterji S, Sadana R, Üstün TB, Murray CJL. Quantifying Individual Levels of Health: definitions, concepts, and measurement issues. In: Murray CJL, Evans DB, editors. Health systems performace assessment: debates, methods and empiricism. Geneva: WHO; 2003. p. 301–18.
3. US Department of Health and Human Services. Healthy people 2010. Washington, DC: US Department of Health and Human Services; 2000. 4. World Health Organization. International Classification of Functioning,
Disability and Health: ICF. Geneva: World Health Organization; 2001. 5. Cieza A, Oberhauser C, Bickenbach J, Chatterji S, Stucki G. Towards a
minimal generic set of domains of functioning and health. BMC Public Health. 2014;14:218.
6. World Health Survey Instruments and Related Documents.
[http://www.who.int/healthinfo/survey/instruments/en/]. Accessed 28 Jul 2013.
7. Üstün TB, Chatterji S, Mechbal A, Murray CJL, Groups WC. The World Health Surveys. In: Murray CJL, Evans DB, editors. Health systems performace assessment: debates, methods and empiricism. Geneva: WHO; 2003. 8. Üstün TB, Chatterji S, Kostanjsek N, Rehm J, Kennedy C, Epping-Jordan J,
Saxena S, Korff Mv, Pull C. Developing the World Health Organization disability assessment schedule 2.0. Bull World Health Organ. 2010;88:815–23. 9. English Longitudinal Study of Ageing: Insight into a maturing population.
[http://www.elsa-project.ac.uk/]. Accessed 28 Jul 2013.
10. Mair P, Hatzinger R. Extended Rasch modeling: The eRm package for the application of IRT models in R. J Stat Softw. 2007;20:1–20.
11. Bond TG, Fox CM. Applying the Rasch model: fundamental measurement in the human sciences. 2nd ed. Mahwah: Lawrence Erlbaum Associates, Inc.; 2007. 12. Masters GN. A Rasch model for partial credit scoring. Psychometrika. 1982;
47:149–74.
13. Reeve BB, Hays RD, Bjorner JB, Cook KF, Crane PK, Teresi JA, Thissen D, Revicki DA, Weiss DJ, Hambleton RK, et al. Psychometric evaluation and calibration of health-related quality of life item banks: plans for the Patient-Reported Outcomes Measurement Information System (PROMIS). Med Care. 2007;45:S22–31.
14. Reise SP. The rediscovery of bifactor measurement models. Multivar Behav Res. 2012;47:667–96.
15. Jennrich RI, Bentler PM. Exploratory Bi-factor analysis. Psychometrika. 2011; 76:537–49.
16. Reise SP, Morizot J, Hays RD. The role of the bifactor model in resolving dimensionality issues in health outcomes measures. Qual Life Res. 2007;16 Suppl 1:19–31.
17. Buja A, Eyuboglu N. Remarks on parallel analysis. Multivar Behav Res. 1992; 27:509–40.
18. Roscino A, Pollice A. A Generalization of the Polychoric Correlation Coefficient. In: Zani S, Cerioli A, Riani M, Vichi M, editors. Data analysis, classification and the forward search. Berlin, Heidelberg: Springer; 2006. p. 135–42. Studies in Classification, Data Analysis, and Knowledge Organization.
19. Ekström J. A generalized definition of the polychoric correlation coefficient. UC Los Angeles: Department of Statistics, UCLA; 2011.
20. Reeve BB, Fayers P. Applying item response theory modeling for evaluating questionnaire item and scale properties. In P. Fayers and R. D. Hays, editors. Assessing Quality of Life in Clinical Trials: Methods of Practice. 2nd ed. Oxford: Oxford University Press; 2005. p. 55–73.
21. Pallant JF, Tennant A. An introduction to the Rasch measurement model: an example using the Hospital Anxiety and Depression Scale (HADS). Br J Clin Psychol. 2007;46:1–18.
22. Crane PK, Gibbons LE, Jolley L, van Belle G. Differential item functioning analysis with ordinal logistic regression techniques. DIFdetect and difwithpar. Med Care. 2006;44:S115–23.
23. Choi SW, Gibbons LE, Crane PK. Lordif: An R package for detecting differential item functioning using iterative hybrid ordinal logistic regression/item response theory and Monte Carlo simulations. J Stat Softw. 2011;39:1.
24. Smith AB, Rush R, Fallowfield LJ, Velikova G, Sharpe M. Rasch fit statistics and sample size considerations for polytomous data. BMC Med Res Methodol. 2008;8:33.
25. The Research Methods Knowledge Base. [http://www.socialresearchmethods.net/kb/ ]. Accessed 28 Jul 2013.
26. Cronbach LJ. Coefficient alpha and the internal structure of tests. Psychometrika. 1951;16:297–334.
27. Revelle W, Zinbarg RE. Coefficients alpha, beta, omega, and the glb: Comments on Sijtsma. Psychometrika. 2009;74:145–54.
28. Wood SN. Generalized additive models: an introduction with R. Boca Raton: Chapman & Hall; 2006.
29. Salomon JA, Vos T, Hogan DR, Gagnon M, Naghavi M, Mokdad A, Begum N, Shah R, Karyana M, Kosen S, et al. Common values in assessing health outcomes from disease and injury: disability weights measurement study for the Global Burden of Disease Study 2010. Lancet. 2012;380:2129–43. 30. R Development Core Team. R: A language and environment for statistical
computing. Vienna: R Foundation for Statistical Computing; 2013. 31. Hosseinpoor AR, Williams JS, Jann B, Kowal P, Officer A, Posarac A, Chatterji
S. Social determinants of sex differences in disability among older adults: a multi-country decomposition analysis using the World Health Survey. Int J Equity Health. 2012;11:52.