Single-Viewpoint Panorama Construction with
Wide-Baseline Images using SIFT and SURF
Features
Kripa S Monisha Menon
PG Student Assistant Professor
Department of Electronics & Communication Engineering Department of Electronics & Communication Engineering Marian Engineering College, Trivandrum, India Marian Engineering College, Trivandrum, India
Abstract
This paper presents an image stitching approach, which can produce visually plausible wide baseline panoramic images with input taken from different viewpoints. Unlike previous methods, this approach uses Harris corner detector for the detection of corner point and the image stitching based on common stitching algorithms such as scale invariant feature transform (SIFT) combined with speeded up robust features (SURF) feature detection and random sample consensus (RANSAC) parameter estimation also uses homography similarity to identify if input images have enough correlation. This paper improves the composition and achieves good performance on misaligned areas.
Keywords: homogarphy, image acquisition, image conversion, RANSAC, SIFT, SURF, single view-point panorama ________________________________________________________________________________________________________
I. INTRODUCTION
Images are obviously an integral part of our daily life. Image stitching or photo stitching is the process of combining multiple photographic images with overlapping fields of view to produce one panoramic image or high-resolution image. It is commonly performed through the use of computer software, most approaches to image stitching require nearly exact overlaps between the images and identical exposures to produce seamless results although some stitching algorithms actually benefit from differently exposed images by doing HDR (High Dynamic Range) imaging in regions of overlap. Some of the digital cameras can stitch their photos internally. Stitched images are used in applications such as interactive panoramic viewing of images, architectural walk-through, multi-node movies and other applications using images acquired from the real world.
Image stitching aims to combine multiple images to produce a high-resolution image. Through image stitching, user can get more data from combined image and wide angle of view. Also image stitching has been researched in various fields, and there are many algorithms which handle image stitching efficiently. In this paper for the image stitching process the image acquisition and conversion is done firstly. Secondly detection of each corner of the images using Harris corner detection operator is done which efficiently predicts the features. Up to now common image stitching algorithm uses scale invariant feature transform (SIFT) [2] or speeded up robust features (SURF) [5] algorithm to detect feature points in images. Here we use SIFT combined with SURF to improve the performance. Thirdly from the detected feature points matching points are extracted. Finally estimate homography matrix using random sample consensus (RANSAC) [4] algorithm from matching point. Then overlap two images by using geometric transformation using homography matrix. Thus most of the images can produce combined image successfully. But in several environments, there are some problems that can confirm by eyes, such as misalignment. Misalignment is caused by difference of distance in image. The combined SIFT and SURF features can improve the performance of matching the baseline alignment, and make the alignment correction for linear and orientation alignment are preserved.
II. RELATED WORKS
General Image Stitching:
Scale Invariant Feature Transform (SIFT):
The SIFT algorithm (Scale Invariant Feature Transform) proposed by Lowe is an approach extract distinctive invariant features from images. SIFT is used in computer vision problems based on feature matching including object recognition, pose estimation, image retrieval and for many other applications. However, in real world applications SIFT still needs improvement in the algorithm’s robustness with respect to the correct matching of SIFT features.
In the work done by Tejasha Patil, Shweta, Mishra ,Poorva Chaudhari and Shalaka Khandale an improvement of the original SIFT algorithm provides more reliable feature matching for the purpose of object recognition is proposed. The main idea of SIFT is to divide the features extracted from both the images i.e. the test and the model object image; into several sub -collections before they are matched. In SIFT the features are divided into several sub collections considering the features arising from different octaves, that is from different frequency domains. The major stages of computation used to generate set of image features are as follows:
Scale-space extreme detection: The first stage of computation searches over all scales and image locations and is implemented efficiently by using a difference-of-Gaussian function to identify potential interest points that are invariant to scale and orientation
Keypoint localization: Location is determined by fitting a detailed model and scale. Based on measures of their stability keypoints are selected.
Orientation assignment: For each keypoint location based on local image gradient directions one or more orientations are assigned. Further operations are performed on image data that has been transformed relative to the assigned orientation, scale, and location for each feature, thus providing invariance to these transformations.
Key point descriptor: This approach transforms image data into scale invariant coordinates relative to the local features. In the region around each key point the local image gradients are measured at the selected scale. These are then transformed into a representation which allows for significant levels of local shape distortion and change in the illumination.
Many previous approaches use SIFT to find correspondences. For extremely challenging data, ASIFT can be adopted to obtain more feature matches.
Random Sample Consensus Algorithm:
The Random sample Consensus algorithm (RANSAC) which is proposed by Fischler and Bolles is a general parameter estimation approach designed to avoid outliers of large proportion in the input data. Many of the common robust estimation techniques like M-estimators and least median squares that have been adopted by the computer vision community from the statistics literature and works differently than RANSAC. RANSAC was developed from within the computer vision community. RANSAC is a resampling technique that generates candidate solutions by using the minimum number of observations (data points) which is required to estimate the underlying model parameters. As pointed out by Fischler and Bolles, unlike conventional sampling techniques that use as much of the data as possible in order to obtain an initial solution and then proceed to prune outliers, RANSAC uses the smallest set possible and proceeds to enlarge this set with consistent data points.
The basic algorithm is summarized as follows,
Select randomly the minimum number of points required to determine the model parameters. Then the parameters of the model are solved.
Number of points from the set of all points fit with a predefined tolerance is determined.
If the fraction of the number of inliers over the total number points in the set exceeds a predefined threshold τ, using all the identified inliers model parameters are re-estimated and then terminate.
Else, repeat steps 1 through 4
Speeded Up Robust Features:
In computer vision SURF is a patented local feature detector and descriptor. It can be used for tasks such as object recognition, image registration and classification or three dimensional reconstructions. It is partly inspired by the scale-invariant feature transform (SIFT) descriptor. The standard version of SURF is several times faster than SIFT and is more robust against different image transformations while comparing with SIFT.
SURF uses an integer approximation of the determinant of Hessian blob detector to detect the interest point, which can be computed with 3 integer operations using an integral image which are pre computed. Its feature descriptor is based on the sum of the Haar wavelet response around the point of interest. These are computed with the aid of the integral image. SURF descriptors have been used to reconstruct 3D scenes, to locate and recognize objects, people or faces, to track objects and to extract points of interest.
III. IMAGE STITCHING
Image Acquisition and Conversion:
In image processing image acquisition can be defined as the action of retrieving an image from some source, usually a hardware-based source, so it can be passed through whatever processes need to occur afterward, this is called image conversion. Performing image acquisition in image processing is always the first step in the workflow sequence because, without an image, no processing is possible. The image that is acquired is completely unprocessed. Depending on the field of work, it can be processed.
Fig 1 shows a challenging scene example where three images are captured from different position and these images are read in the first stage. These images are selected from a file and return these filename as string. Then these images are made in same dimension.
(a) (b) (c) Fig. 1: Three input images captured from different positions
Corner Feature Point Detection:
Corner is the point in which testing function energy is very intense in any direction changes. It is one of the most important feature of the data information. The results of image processing depends on the accuracy and quality of the corner detection, and can determine the outline features and important information of the image. Corner detection are used for optical flow velocit y measuring, camera calibration, measurement and positioning motion estimation, etc., and has become an important tool for image processing. Corner detection can keep the useful image information. It can reduce data redundancy and improve the detection efficiency.
In order to take full advantage of the corner information in different scales, this paper uses Harris corner detector operation. Harris and Stephens improved upon Moravec's corner detector by considering the differential of the corner score with respect to direction directly, instead of using shifted patches that is the corner score is often referred to as autocorrelation function.
In this paper Harris edge detection is used to do the feature alignment or feature point detection [3] for that the RGB input image is first converted to gray scale image and then it is double précised. Normally each feature point is represented as a weighted sum of their four enclosing control vertices, and minimizing alignment errors of the warped points over all features which uses affine transformation for each grid. Instead of assuming affine transformation here Gaussian filter is used i.e. providing Gaussian transformation to the whole image. Assume two Gaussian filters g1 and g2 with standard deviation σd and σi respectively and is then convoluted so the center portion of the matrix is obtained. Consider taking an image patch over the area (u,v) and shifting it by (x,y). Let the image is I and its partial derivative is Ix and Iy.
The Harris matrix is given as equation (1),
𝐻 = [ 𝐼𝑥
2 𝐼
𝑥𝐼𝑦
𝐼𝑥𝐼𝑦 𝐼𝑦2
] (1)
The corner point is identified using the equation (2),
𝑅 = 𝑑𝑒𝑡 (𝐻)
𝑡𝑟𝑎𝑐𝑒(𝐻)+ ∈ (2)
(a) (b) (c)
Fig. 2: (a) Harris corner point of image 1. (b) Harris corner point of image 2. (c) Harris corner point of image 3.
SIFT Feature Extraction:
The next step after feature point detection is the scale preservation where the variation in orientation is detected and is amended which is done using Scale Invariant Feature Transform (SIFT). SIFT [2] is an algorithm to detect and describe local features in an image. SIFT key points of objects are first extracted from a set of reference images and stored in a database. In a new image an object is recognized by individually comparing each feature from the new images to this database and finding candidate matching features based on Euclidean distance of their feature vectors. Then the subsets of key points that agree on the object and its location, scale and orientation in the new image are identified to filter out good matches from the full set of matches.
Here first image is taken as the input and is considered as the first parameter then two more parameters like circle with a radius 10 since the SIFT descriptor used here is circle and an enlargement factor of 1.5 is defined. The output from the Harris corner detector i.e. the point detected from Harris corner detector is given to the SIFT descriptor. By using the SIFT, orientation can be found i.e. the angle variation in the images and the point where it varied can be detected. For the primary measurement of angle, number of angles and number of binaries is taken and from that number of samples is found. Let the number of angles be A, number of binaries be B and number of samples be S then S=B*B. Then the angle variation between 0° and 360° is found since all the point between this specified intervals have to be detected and for finding those points the angle is shifted by 45°. To find the accurate point on where the angular variation occurs and to know how much it get varied SIFT array has to be created which needs the number of angles (A) and their locations.
Consider an edge image as 1 and then generate the de-Gaussian with this value. On the x-axis (Ix) and y-axis (Iy) of the corresponding image 2D digital filtering is done. From those values the gradient magnitude(Imag ) and the angle (Iθ) is found using the equation (3) and (4) respectively.
If needed assume Iθ as 0.
Imag = √Ix2+ Iy2 (3)
Iθ = tan−1 IIx
y (4)
Then a default grid i.e. the mesh grid centered at zero is applied to all the images in the interval, L of [2
B: 2
B: 2 ] on x axis and
[L-1
B-1] on y axis is created and the x-axis and y-axis of the grid is then reshaped based on the number of samples (S) and let it be gx on x-axis and gy on y axis.
An orientation image Io is then defined with height, width and number of angles (A) of the image. Then a temporary array (tmp) is created. Io can be further defined as, i.e. the column element of Io is the dot product of the temporary array (tmp) created and Imagand this is calculated for the total number of angles. This means that the weight provided by the point which has angular variation is (5),
Io = tmp* Imag (5)
The Harris detector output is taken and its x value and y value is multiplied with the enlargement factor so that these values get enlarged by a factor of 1.5. Let the enlarged values of x-axis and y-axis be Cx and Cyrespectively. For finding the co-ordinates of the sample point, increment the grid values gx and gy. Therefore the coordinate on x-axis changes to gxtand
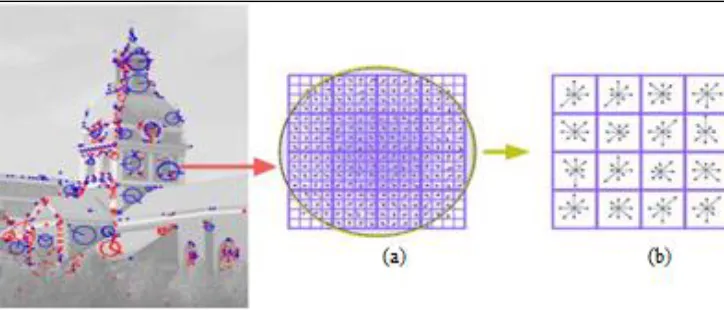
Fig. 3: (a) Image gradient (b) Key point descriptor
The orientation value Io is then given to a temporary array (temp). The product of the temporary array and the total weight calculated on the above step is multiplied to get the current SIFT, this is done to provide more accuracy and has to find this value for all the images. After this step the current value should be reshaped i.e. corresponding to the value found new value should replace it. Then the descriptor should be normalized and suppress the large gradient. Finally renormalize to unit length. Thus the SIFT description is done. Fig 3 shows an example of how the SIFT descriptor works.
SURF Feature Extraction:
The next step is the SURF [5] detector which will enhances the output. SIFT mainly handle with the orientation whereas SURF can handle other constraints to. To detect interest points, SURF uses an integer approximation of the determinant of Hessian detector, which can be computed with 3 integer operations using a pre computed integral image. Its feature descriptor is based on the sum of the Haar wavelet response around the point of interest and are computed with the aid of the integral image. SURF descriptors have been used to reconstruct 3D scenes, to locate and recognize objects, people or faces, to track objects and to extract points of interest. The SURF algorithm is based on the same principles and steps as SIFT; but details in each step are different. The algorithm has three main parts like interest point detection, local neighbourhood description and matching. SURF uses square-shaped filters as an approximation of Gaussian smoothing. If the integral image is used, filtering the image with a square is much faster as in (6):
𝑆(𝑥, 𝑦) = ∑𝑥𝑖=0 ∑ 𝐼(𝑖, 𝑗)
𝑦
𝑗=0 (6)
Using the integral image sum of the original image within a rectangle can be evaluated quickly, requiring evaluations at the rectangle's four corners. The output from the integral image is then taken and its first two points is assumed as the initial sample. For extracting the interest point fast hessian is taken. Here the index map is filtered and then the response map is created for that we have to get the image attributes. First image and the second image are taken then it is divided by the initial sample. The new value is then propagated and computed from each point. Let the first image is taken as W and the second image is taken as H and the initial sample which is the cumulative sum is taken as C. The new values formed are w and h and it is defined in equation (7) and (8) respectively.
𝑤 =𝑊
𝐶 (7)
ℎ =𝐻
𝐶 (8)
At each individual scale, the Hessian affine detector chooses interest points based on the Hessian matrix at that point is (9):
𝐻(𝑥) = [𝐿𝐿𝑥𝑥 𝐿𝑥𝑦
𝑥𝑦 𝐿𝑦𝑦] (9)
where 𝐿𝑎𝑎 is second partial derivative in the a direction and 𝐿𝑎𝑏 is the mixed partial second derivative in the a and b directions. It's important to note that the derivatives are computed in the current iteration scale. As discussed in the Harris affine region detector article, the derivatives must be scaled appropriately by a factor related to the Gaussian kernel 𝜎𝐼2.
Interest points are those points that simultaneously are local extrema of both the determinant as in equation (10) and trace of the Hessian matrix as in equation (11) at each scale. The trace of Hessian matrix is identical to the Laplacian of Gaussians (LoG)
𝐷𝑒𝑡 = 𝜎𝐼2(𝐿𝑥𝑥 𝐿𝑦𝑦− 𝐿2𝑥𝑦) (10)
𝑇𝑅 = 𝜎𝐼 (𝐿𝑥𝑥+ 𝐿𝑦𝑦) (11)
𝑁𝑜𝑟𝑚𝑎𝑙𝑖𝑧𝑎𝑡𝑖𝑜𝑛 𝑓𝑎𝑐𝑡𝑜𝑟 (𝑁) = 1
𝑓𝑖𝑙𝑡𝑒𝑟 𝑠𝑖𝑧𝑒2 (12)
where the filter size is doubled précised. Then the response component is computed and let it be𝐷𝑥𝑥, 𝐷𝑥𝑦, 𝐷𝑦𝑦 and is normalized by multiplying each component with the normalized factor. Therefore those components changes as in equation (13), (14) and (15) respectively.
𝐷𝑋𝑋 = 𝐷𝑥𝑥∗ 𝑁 (13)
𝐷𝑌𝑌 = 𝐷𝑦𝑦∗ 𝑁 (14)
𝐷𝑋𝑌= 𝐷𝑥𝑦∗ 𝑁 (15)
Then the determinant of Hessian response and Laplacian is found by the equation (16) and (17) respectively
𝑅𝑒𝑠𝑝𝑜𝑛𝑠𝑒 = 𝐷𝑋𝑋𝐷𝑌𝑌− 0.81𝐷𝑋𝑌2 (16) Laplacian = 𝐷𝑋𝑋+ 𝐷𝑌𝑌 (17) Then the Laplacian and the response map is calculated.
If the interest point is empty then surf descriptor is used. Here we define the information about first 40 points then the size of the descriptor is defined. Orientation has to be found out for that the descriptor for different interest point is calculated. Get rounded interest point i.e. round the interest point to the nearest integer. In order to achieve rotational invariance, the orientation of the point of interest needs to be found. The Haar wavelet responses in both x- and y-directions within a circular neighbourhood around the point of interest are computed. The obtained responses are weighted by a Gaussian function centered at the point of interest, then plotted as points in a two-dimensional space, with the horizontal response in the abscissa as in equation (18) and the vertical response in the ordinate as in equation (19).
Response of x-axis =gaussian filter* haar x (18) Response of y-axis= gaussian filter* haar y (19)
The dominant orientation is estimated by calculating the sum of all responses within a sliding orientation window of size π/3. The horizontal and vertical responses within the window are summed. The two summed responses then yield a local orientation vector. The longest such vector overall defines the orientation of the point of interest. The size of the sliding window is a parameter that has to be chosen carefully to achieve a desired balance between robustness and angular resolution.
To extract SURF descriptor gets rounded interest point data. To describe the region around the point, a square region is extracted, centered on the interest point and oriented along the orientation as selected above. The interest region is split into smaller sub-regions, and for each one, the Haar wavelet responses are extracted for regularly spaced sample points. The responses are weighted with a Gaussian (to offer more robustness for deformations, noise and translation).
SURF descriptor significantly outperformed the base implementation of the Harris detector with square descriptor. SURF HAS closer performance as that of SIFT. SURF detector should outperform SIFT in many cases. SURF also runs very slowly. The detection step is quite fast but calculating the descriptors takes a very long time.
Homography Prediction:
Then we have find the matching, for that the matching between image 1 and image 2 then matching between image 2 and image 3 is found using homography. In homography we define a 3x3 homography matrix H and the correspondence value is calculated where correspondence12 is the image location and matched location of image 1 and image 2 likewise correspondence23 is also calculated. Then the inliers have to be found out and the outliers have to be rejected for that RANSAC technique is used.
Random sample consensus (RANSAC) [4] is an iterative method used to estimate the parameters of a mathematical model from a set of observed data that contains outliers, when outliers are to be accorded no influence on the values of the estimates. Therefore, it can also be interpreted as an outlier detection method since this can detect the outliers and inliers seperately. It is a non-deterministic algorithm because with a certain probability only it produces a reasonable result, with this probability increasing as more iteration is allowed.
(a) (b) Fig. 4: (a) SURF features of image 1 and image 2 (b) SURF features of image 2 and image 3
enumerating all feature points in 𝐼𝑖 , inlier is obtained set B1 for (𝐼𝑖, 𝐼𝑗). Then we swap 𝐼𝑖 and 𝐼𝑗to get another inlier set B2 by Algorithm 1.The final inlier set is B1 ∩ B2.
Algorithm 1 Outliers Rejection with Local Homographies using RANSAC 1: procedure VERIFY(𝐼𝑠𝑟𝑐, 𝐼𝑑𝑠𝑡
2: 𝐵𝑖𝑛𝑙𝑖𝑒𝑟 = ∅ 3: for all p∈ 𝐼𝑠𝑟𝑐do
4: Solve for H for {(𝑝′, 𝑞′)|𝑝′∈ 𝑁(𝑝)} 5: for all {(𝑝′, 𝑞′)|𝑝′∈ 𝑁(𝑝)} do 6: if |𝐻(𝑝′) − 𝑞′|2 < 𝛾 then 7: 𝐵𝑖𝑛𝑙𝑖𝑒𝑟 (𝑝′, 𝑞′) 8: end if
9: end for 10: end for 11: return 𝐵𝑖𝑛𝑙𝑖𝑒𝑟 12: end procedure
Fig. 4: shows the SURF feature combined with the matching technique and the fig 5 is the inlier identification.
(a) (b) Fig. 5: (a) and (b) Inlier extraction
Warping The Image:
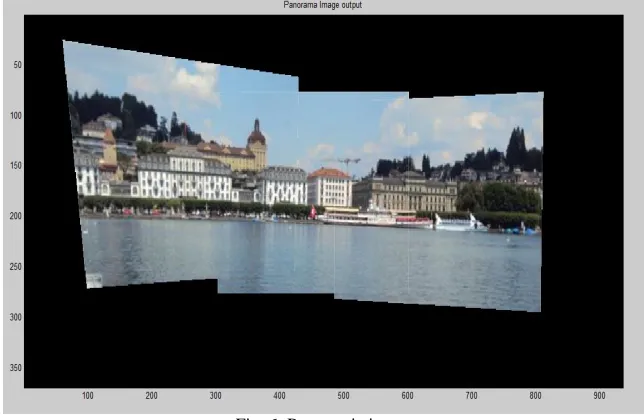
Image warping is a transformation which is applied to the domain of an image. Warping will modifies the geometrical properties of the image itself. The intensity of the warped image has to be same as the intensity of the original image at corresponding points. The images of features are compared and if it was matched with another image it is stored and form as single combined frame of panorama. For constructing the panorama the output image is made as the same class of input image then assigns some input arguments. Later on linear interpolation is done. Thus the image is stitched in this step. Fig 6 shows the panoramic image. The result produced with elapsed time of 60.053490 seconds.
IV. CONCLUSION
We have presented a new image stitching approach for wide-baseline images. Detection of each corner of the images using Harris corner detection operator efficiently predicts the features. Extracting the features of scale and alignment variation contents of certain searching range is done using SIFT descriptors. This feature extraction includes the feature alignment, scale preservation and line preservation. To improve the performance of matching the baseline alignment, we combine the SURF with SIFT and make the alignment correction for linear and orientation alignment are preserved. Multi-homography model has more degrees of freedom and can represent warping of a general smooth scene. The images of features are compared and if it was matched with another image it stored and form as single combined frame of panorama.
ACKNOWLEDGEMENT
I would like to express my special gratitude and thanks for giving me attention and time.
REFERENCES
[1] Guofeng Zhang, Yi He, Weifeng Chen, Jiaya Jia, and Hujun Bao, “Multi-Viewpoint Panorama Construction with Wide-Baseline Images,” vol. 25, no. 7, July 2016.
[2] D. G. Lowe, “Distinctive image features from scale-invariant keypoints,” Int. J. Comput. Vis., vol. 60, no. 2, pp. 91–110, 2004.
[3] Ting Feng, Jie Yuan, "Feature point detection and matching of wide baseline image based on scale space theory and guided matc hing algorithm", Multimedia Technology (ICMT) 2011 International Conference on, pp. 538-542, 2011.
[4] M A Fishler, R C. Bolles, "Random Sample Consensus A paradigm for model fitting with applications to image analysis and automated cartography", [J]. Communications of ACM, vol. 24, no. 6, pp. 381-395, 1981.