Research Article
Vol: 2; Issue: 2
FORMULATION AND EVALUATION OF SOLID
DISPERSION OF GLIPIZIDE FOR SOLUBILITY AND
DISSOLUTION RATE ENHANCEMENT
Ankit Gupta
1*, Mahesh Kumar Kataria
2, Ajay Bilandi
31
M.Pharm. SEM IVth (Pharmaceutics), 2Assistant Professor and Head Department of Pharmaceutics,
3
Lecturer, Department of Pharmaceutics, Seth G.L. Bihani S.D. College of Technical Education,
Sri Ganganagar, Rajasthan, India
Date Received: 28TH Jan 2014
Date of Accepted: 4th Feb 2014
Date Published: 11th Feb 2014
74
Abstract:
The poor solubility of drug substances in water and their low dissolution rate in aqueous G.I.T fluid often leads to insufficient bioavailability. Glipizide is a class-II antidiabetic drug which is purely insoluble in water. Since only dissolved drug can pass the gastro intestinal membrane, proper solubility of the drug is ultimately desired. Solubility of the poorly soluble drug, glipizide, is enhanced by formulating solid dispersion using melting fusion and solvent evaporation method. Drug and carriers like Eudragit E-100, Croscarmellose and Sodium Starch Glycolate in different ratios like 1: 1, 1: 2, 1: 3 and 1:4 were used for formulating solid dispersions. The FTIR spectra of the glipizide and polymers alone and in combination show the compatibility of the drug and excipients. The solid dispersions were evaluated for practical yield and in vitro dissolution. It was concluded that 1:4 ratio of drug: SSG shows better in vitro dissolution rate compared to the pure drug and marketed preparation. Further the solid dispersion with highest release rate was formulated in tablet dosage form. The angle of repose, bulk density, tapped density, carr’s index and hausner ratio were calculated for the micromeritic characterization of the powder blend. The tablets were further studied for different pharmacopoeial and non pharmacopoeial evaluation test. Similarity factor F2 was 52 and difference factor F1 was 14 for glipizide was found to be within the standards. The in vitro release from the formulation was observed three times increased from the glipizide API.
Keywords:
Poor solubility, Eudragit E100, Croscarmellose sodium (CCS), Glipizide, Sodium Starch Glycollate (SSG), Solid dispersion, Solvent evaporation method.
Introduction
Oral drug delivery is the simplest and easiest way of administering drugs, because of the greater stability, smaller bulk, accurate dosage and easy production. Among the oral dosage form solid dosage forms have many advantages over other types of oral dosage forms. Therefore, most of the new chemical entities under development these days are intended to be used as a solid dosage form which produces an effective
Avalabile online at www.ijpda.com
Ankit Gupta et al; Vol: 2 Issue:2 Page:74-87
75
When delivering an active agent orally, it must firstdissolve in gastric and/or intestinal fluids before it can permeate the membranes of the GI tract to reach systemic circulation. Hence two areas of pharmaceutical research that focus on improving the oral bioavailability of active agents include enhancing solubility and dissolution rate of poorly water soluble drugs & enhancing permeability of poorly water-soluble drugs.
One of the major current challenges of the pharmaceutical industry is related to strategies that improve the water solubility of drug. Drug release is a crucial and limiting step for oral drug bioavailability, particularly for drug with low gastrointestinal solubility and high permeability. By improving the drug release profile of these drugs, it is possible to enhance their bioavailability and reduce side effects. Solid dispersions are one the most successful strategic approach to improve drug release of poorly soluble drugs. Solid dispersion can be defined as a molecular mixture of poorly water soluble drugs in hydrophilic carriers, which present the drug release profile that is driven by the polymer properties[1].
Need of Solubility Enhancement
Drug absorption from the gastrointestinal tract can be limited by a variety of factors, most significant contributors being poor aqueous solubility and poor membrane permeability of the drug molecule. When delivering an active agent orally it must first dissolve in gastric and/or intestinal fluids before it can permeate the membranes of the GI tract to reach systemic circulation. Hence, two areas of pharmaceutical research that focus on improving the oral bioavailability of active agents include; enhancing solubility and dissolution rate of poorly water-soluble drugs and enhancing permeability of poorly water soluble drugs. The BCS is a scientific framework for classifying a drug substance based on its aqueous solubility and intestinal permeability.
Glipizide is an oral rapid- and short-acting anti-diabetic drug from the sulfonylurea class. It is classified as a second generation sulfonylurea, which means that it undergoes enterohepatic circulation. Second-generation sulfonylureas are both more potent and have shorter half-lives than the first-generation sulfonylureas. It helps to control blood sugar levels. This medication helps your pancreas produce insulin. Glipizide is used together with diet and exercise to treat type II diabetes[2],[3]. It is 100 times more potent than Tolbutamide. As per BP, It Glipizide is practically insoluble in water; because of its poor aqueous solubility (classified as BCS class II drug), conventional Glipizide dosage form show absorption problem, and its dissolutions are considered to be a rate determining step in its absorption from gastrointestinal tract.During high blood glucose level conditions, an
antidiabetic drug should show quick and high oral bioavailability, which can be achieved by high aqueous solubility. Many hydrophilic excipients like sodium starch glycolate, eudragit E-100, croscarmellose, PEG4000, PEG 6000, urea, Mannitol, PVP and poloxamers can be used to enhance the dissolution of drugs. So the rationale is to enhance the solubility rate of Glipizide with the use of combination of polymers like sodium starch glycollate (SSG), eudragit E-100 and croscarmellose (CCS)[4],[5].
Several approaches has been used to enhance the dissolution of glipizide by solid dispersion with polyethylene glycol, mannitol and PVP K 30[6], Polyethylene glycol (PEG 4000 and 6000)[7], PVP K30 and PEG 6000 and with Skimmed Milk (SM)[8], PVP K30[9], PEG (Polyethylene glycol) 4000[10], Poloxamer (PXM) 188 and Poloxamer (PXM) 407[11], liquisolid approaches by Avicel PH-102 and Aerosil 200[12], bio nano composites (BNCs) by microwave-induced diffusion (MIND)[13], microemulsion (ME) using Capmul® MCM-based ME formulation with Cremophor EL and Transcutol[14], nanoparticles by HPMC-E15[15].
EXPERIMENTAL
MATERIALS:
Glipizide was obtained as a gift sample from Morepen Laboratories Ltd, Baddi, Himachal Pradesh. Croscarmellose sodium and Sodium starch glycolate was obtained from Maple Biotech Pvt Ltd., Pune. Eudragit e 100 was obtained from Evonik Degussa India Pvt. Ltd., Mumbai. All other reagents and solvents used were of analytical grade.
METHODS
Preformulation studies:
Preformulation studies focus on those physiochemical properties of the drug that could affect performance and development of an efficacious dosage form. It is necessary to determine purity of API before formulation any dosage form. Preformulation studies are useful in determining the formulation components and physiochemical properties of new drug substance.
Description of drug
The sample of drug was observed for colour, state and odour.
Infra red spectrophotometry:
Avalabile online at www.ijpda.com
Ankit Gupta et al; Vol: 2 Issue:2 Page:74-87
76
ratio. The excipients used cros carmellose, sodium starchglycolate and eudragit E- 100. These studies performed from faculty of pharmaceutical sciences Jodhpur National University.
Standard calibration curve:
A stock solution of glipizide (100 µg/ml) was prepared by disolving 10 mg of glipizide in small volume of methanol, in volumetric flask and the volume was adjusted to 100 ml with 7.4 pH phosphate buffers. Spectral absorbance measurement was made on Shimadzu-1700 UV-visible spectrophotometer.
Preparation of solid dispersion:
The melting or fusion method:
Four different formulation of glipizide solid dispersion prepared with polymer Eudragit E 100 in 4 different ratios 1:1, 1:2, 1:3, 1:4 by using melting fusion method. The preparation of physical mixture involves of a drug and a water-soluble carrier and heating it directly until it melted. The melted mixture is then solidified rapidly in an ice-bath under vigorous stirring. The final solid mass is crushed, pulverized and sieved.
Solvent Evaporation Method:
Eight different formulation of glipizide solid dispersion prepared with 2 different polymers cros carmellose, and sodium starch glycolate in 4 different ratios 1:1, 1:2, 1:3, 1:4 by using solvent evaporation method. The required amount of Glipizide and the carrier were dissolved in sufficient volume of methanol with continuous stirring. The solvent was then completely evaporated at 45º C with continuous stirring to obtain dry mass. The dried mass was pulverized passed through 44 mesh sieve and stored in dessicator until used for further studies. Formulation batches are prepared with different ratio of polymer and drug as shown in table no. 2.
Final batch was evaluated for angle of repose, bulk and true density, compressibility index, hausner ratio.
Evaluation of solid dispersion:
Percentage yield:
Thoroughly dried solid dispersion were collected and weighed accurately. The percentage yield was then calculated using formulae given below,
Percentage Yield = × 100
Estimation of drug content:
An accurately weighed quantity of solid dispersion equivalent to 50 mg of drug was taken into a 100 ml volumetric flask and dissolved in minimum amount of methanol and the volume was made up to the mark with phosphate buffer pH 7.4, and measure at 274 nm using UV double beam spectrophotometer[16].
In Vitro Dissolution:
The dissolution study was carried out using USP apparatus type-II. The dissolution medium was 900 ml 7.4 pH phosphate buffer kept at 37±1ºC. The basket was rotated at 50 rpm. Samples of 5 ml were withdrawn at specified time intervals and analyzed spectrophotometrically at 275 nm using Shimadzu-1700 UV-visible spectrophotometer. The samples withdrawn were replaced by fresh buffer solutions. The dissolution study was continued for next 2 h.
Tablet preparation for optimized formulation:
1. Powder blend evaluation:
Bulk density
The bulk density of the formulated granules was evaluated using a bulk density apparatus. It is expressed in gm/ml and is given by
Bulk Density (ρb) =
! "# $ ( ) ' ()* +)(, ! "# $ ('-)
Tapped density
It is the ratio of total mass of powder to the tapped volume of powder. The tapped volume was measured by tapping the powder to constant volume. It is expressed in gram/ml and is given by[17]
Tapped Density (ρt) =
! "# $ ( ) . !! # ' ()* ! "# $ ('/)
Compressibility Index and Hausner Ratio
The Compressibility index and Hausner’s ratio are measures of the propensity of a powder to be compressed and the flow ability of granule. Carr’s index and Hausner’s ratio were calculated using following formula
Carr’s Index (I) = ρ/0ρ
-ρ/ × 100
Hausner’s ratio = ρ/
ρ
-Where, ρt – Tapped density of the powder, ρb – Bulk density of the powder
Angle of repose
Angle of repose was determined by Neumann’s method and calculated using the formula, for unlubricated as well as lubricated granules.
tanθ = h/r
θ = tan-1(h/r)
Ankit Gupta et al
2. Tablet preparation:
Direct compression method was used for tablets preparation because it is a simple method of tableting that can only be utilized when the powder mixture possesses adequate flowing properties and compressibility.
3. Tablet evaluation:
Shape of Tablets
Compressed tablets were examined under the magnifying lens for the shape of the tablets.
Tablet Dimensions:
Thickness and diameter of tablets were measured using Vernier Calipers. It was determined by checking ten tablets from final formulation. It is expressed in mm.
Hardness
Hardness indicates the ability of a tablet to withstand mechanical shocks while handling. The hardness of the tablets was determined using Pfizer hardness tester. It was expressed in kg/cm2.
Friability
It is performed as per I.P. specification. Maximum loss of weight (from a single test or from the mean of the three tests) not greater than 1.0 per cent is acceptable for most tablets[19].
Uniformity of Weight of Single-Dose Preparations It is performed as per I.P. specification. 20 tablets selected for the test.
Disintegration Test
Disintegration is defined as that state in which
of the unit under test remains on the screen of the apparatus or, if a residue remains, it consists of fragments of disintegrated parts of tablets component parts such as insoluble coating of the tablets or of capsule shells, or of any melted fatty substance from the pessary or suppository or is a soft mass with no palpable core. performed as per I.P. specification.
In Vitro Dissolution:
The dissolution study of final optimized formulation was carried out using USP apparatus type-II. Th
study was continued for next 2 h.
Dissolution Profile Comparison:
Similarity and Difference Factors:
The in vitro dissolution of glipizide solid dispersion tablets were prepared and matched with innovator product by calculating the similarity and difference
Avalabile online at www.ijpda.com
Ankit Gupta et al; Vol: 2 Issue:2 Page:74-87
Direct compression method was used for tablets preparation because it is a simple method of tableting that can only be utilized when the powder mixture possesses
properties and compressibility.
Compressed tablets were examined under the magnifying
Thickness and diameter of tablets were measured using Vernier Calipers. It was determined by checking ten
formulation. It is expressed in mm.[17].
Hardness indicates the ability of a tablet to withstand handling. The hardness of the tablets was determined using Pfizer hardness tester. It
It is performed as per I.P. specification. Maximum loss of weight (from a single test or from the mean of the three eater than 1.0 per cent is acceptable for most
Dose Preparations It is performed as per I.P. specification. 20 tablets
Disintegration is defined as that state in which no residue of the unit under test remains on the screen of the apparatus or, if a residue remains, it consists of fragments of disintegrated parts of tablets component parts such as insoluble coating of the tablets or of capsule shells, or of atty substance from the pessary or suppository or is a soft mass with no palpable core. It is
The dissolution study of final optimized formulation was The dissolution
The in vitro dissolution of glipizide solid dispersion tablets were prepared and matched with innovator product by calculating the similarity and difference
factors. A model independent approach estimate the dissimilarity factor (f
(f2) to compare the dissolution profile of optimized formulation (F12) with innovator’s preparation. The following equations were used for calculating f
The similarity factor (f2) is given by the following equation:
Where n = no of time points, Rt = dissolution value of the reference batch at time t,
Tt=dissolution value of the test batch at same time point. Number of time points, n = 8
where both products ≥ 85%
Number of points in Rt and Tt must be the same and must be the similar to n[20].
RESULT & DISCUSSION
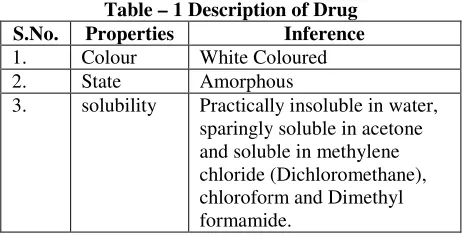
Description of drug
Various properties of drug related with physical appearance, state, solubility given in table
Table – 1 Description of Drug
S.No. Properties
1. Colour White Coloured 2. State Amorphous
3. solubility Practically insoluble in water, sparingly soluble in acetone and soluble in methylene chloride (Dichloromethane), chloroform and
formamide.
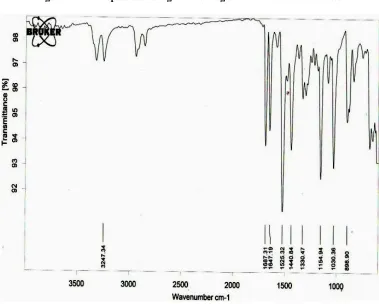
Drug excipients compatibility study
The possible interaction between drug and excipients were studied by IR spectroscopy. Below spectra shows the peaks of pure drug sample and polymers as compared to standard drug sample that is i.e
occurs between polymers and drug samples as shown in figure 1 – 6.
77
factors. A model independent approach was used to estimate the dissimilarity factor (f1) and similarity factor ) to compare the dissolution profile of optimized ) with innovator’s preparation. The following equations were used for calculating f1 and f2.The similarity factor (f2) is given by the following
= dissolution value of the
=dissolution value of the test batch at same time point. number of points
must be the same and must
Various properties of drug related with physical appearance, state, solubility given in table no. 1.
1 Description of Drug Inference White Coloured Amorphous
Practically insoluble in water, sparingly soluble in acetone and soluble in methylene chloride (Dichloromethane), chloroform and Dimethyl formamide.
Drug excipients compatibility study
Ankit Gupta et al
Figure 1:FT IR spectra of drug and Eudragit E 100 mixture immediate
Figure 2:FT IR spectra of drug and Eudragit E 100 mixture after 15 Days
Avalabile online at www.ijpda.com
Ankit Gupta et al; Vol: 2 Issue:2 Page:74-87
FT IR spectra of drug and Eudragit E 100 mixture immediate
FT IR spectra of drug and Eudragit E 100 mixture after 15 Days
78
FT IR spectra of drug and Eudragit E 100 mixture immediateAnkit Gupta et al
Figure 3:FT IR spectra of drug and Croscarmellose Sodium mixture immediate
Figure 4: FT IR spectra of drug and Croscarmellose Sodium mixture after 15 days
Avalabile online at www.ijpda.com
Ankit Gupta et al; Vol: 2 Issue:2 Page:74-87
FT IR spectra of drug and Croscarmellose Sodium mixture immediate
FT IR spectra of drug and Croscarmellose Sodium mixture after 15 days
79
FT IR spectra of drug and Croscarmellose Sodium mixture immediateAnkit Gupta et al
Figure 5: FT IR spectra of drug and Sodium Starch Glycolate mixture immediate
Figure 6: FT IR spectra of drug and Sodium Starch Glycolate mixture after 15 days
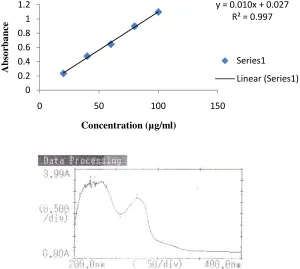
Analytical Method for glipizide using standard calibration curve:
Analytical methods were developed for analysis of glipizide in powder mixtures, formulations and in solutions of different pH values using UV Spectroscopy. The method obeyed Beer’s law and was found suitable for the study. Standard calibration curve of glipizide in different solvents of varying pH are shown in Figure 7.
Avalabile online at www.ijpda.com
Ankit Gupta et al; Vol: 2 Issue:2 Page:74-87
Figure 5: FT IR spectra of drug and Sodium Starch Glycolate mixture immediate
IR spectra of drug and Sodium Starch Glycolate mixture after 15 days
Analytical Method for glipizide using standard
Analytical methods were developed for analysis of glipizide in powder mixtures, formulations and in different pH values using UV Spectroscopy. The method obeyed Beer’s law and was found suitable for the study. Standard calibration curve of glipizide in different solvents of varying pH are shown in Figure 7.
FTIR Studies showed the follow at 1646 cm-1 due to CONH stretc SO2NH stretching, 1154 cm -stretching and 1648 cm-1 due obtained in the spectrum of pure d given in standards.
80
Figure 5: FT IR spectra of drug and Sodium Starch Glycolate mixture immediateIR spectra of drug and Sodium Starch Glycolate mixture after 15 days
ing characteristic peaks ching, 1330 cm-1 due to -1
Avalabile online at www.ijpda.com
Ankit Gupta et al; Vol: 2 Issue:2 Page:74-87
81
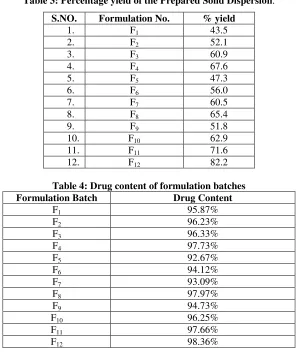
Evaluation Tests:Percentage yield: Percentage yield of different
formulation was determined by weighing the solid dispersion after drying. The percentage yield of different formulation was in range of 43.5 - 82.2% as shown in Table 3. The maximum percentage yield was found in F12.
Figure 7: Glipizide standard calibration curve and UV scan in phosphate buffer pH 7.4 at 275 nm λmax
Formulation Batches:
Table- 2: Formulation batches of glipizide solid dispersion
F1 – F4 batch were prepared with Melting Fusion and F5 – F12 Batches were prepared with solvent evaporation method.
S.NO. Formulation
code
Drug (mg)
Eudragit E 100 (mg)
Croscarmellose (mg)
Sodium Starch Glycolate (mg)
1 F1 5 5 0 0
2 F2 5 10 0 0
3 F3 5 15 0 0
4 F4 5 20 0 0
5 F5 5 0 5 0
6 F6 5 0 10 0
7 F7 5 0 15 0
8 F8 5 0 20 0
9 F9 5 0 0 5
10 F10 5 0 0 10
11 F11 5 0 0 15
12 F12 5 0 0 20
y = 0.010x + 0.027 R² = 0.997
0 0.2 0.4 0.6 0.8 1 1.2
0 50 100 150
A
b
so
rb
a
n
ce
Concentration (µg/ml)
Series1
Avalabile online at www.ijpda.com
Ankit Gupta et al; Vol: 2 Issue:2 Page:74-87
82
Table 3: Percentage yield of the Prepared Solid Dispersion.
S.NO. Formulation No. % yield
1. F1 43.5
2. F2 52.1
3. F3 60.9
4. F4 67.6
5. F5 47.3
6. F6 56.0
7. F7 60.5
8. F8 65.4
9. F9 51.8
10. F10 62.9
11. F11 71.6
12. F12 82.2
Table 4: Drug content of formulation batches
Formulation Batch Drug Content
F1 95.87%
F2 96.23%
F3 96.33%
F4 97.73%
F5 92.67%
F6 94.12%
F7 93.09%
F8 97.97%
F9 94.73%
F10 96.25%
F11 97.66%
F12 98.36%
2. Drug Content:
Only F12 formulation complied with the test of glipizide content uniformity according to Indian Pharmacopoeia, as beside these all formulations fall outside the limit of 98-102 %. This is because of R value ( R=Q/q), ratio of carrier (Q) to coating material (q) of 10 contained by these formulations, which had sufficient concentration of carrier (Eudragit E-100 & SSG) that might lead to uniform distribution of drug by either adsorption onto, or absorption into carrier, therefore having more homogeneous distribution throughout the batch.
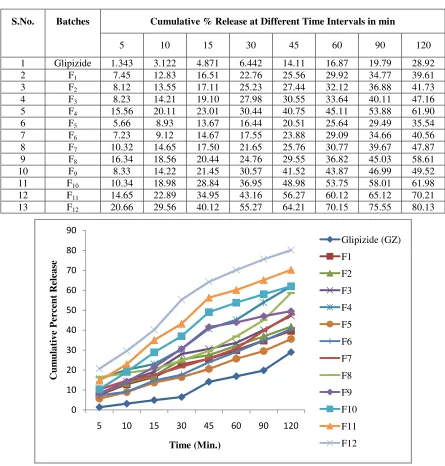
3. In-vitro dissolution Studies
Glipizide solid dispersions presented better dissolution performance over corresponding the pure GZ. Glipizide with Eudragit E 100 Solid Dispersion showed a marked increase in the cumulative % drug release upto 61.90%. Similarly Solid Dispersion of Glipizide with Croscarmellose Na showed marked drug release upto 58.61% respectively as shown in table 5. Solid Dispersion of Glipizide with Sodium Starch Glycolate showed significantly increases the drug release upto 80.13%. The
enhanced dissolution was observed in case of Glipizide: Sodium Starch Glycolate in 1:4 ratio solid dispersions. Dissolution profile shown in the form of curve shape in figure 8.
As per as the percentage yield, drug content and dissolution studies are concerned, it indicated that f12 formulation gives best yield, having best drug content and shows best dissolution release. By the result observation, it can conclude that F12 formulation should be a better candidate for solid dispersion with best output.
Formula and evaluation test of final formulation:
1. Physical evaluation of solid dispersion powder:
Avalabile online at www.ijpda.com
Ankit Gupta et al; Vol: 2 Issue:2 Page:74-87
83
Table 5: In-vitro Dissolution Profile of Glipizide and Solid Dispersions of polymers in pH 7.4 Buffer.S.No. Batches Cumulative % Release at Different Time Intervals in min
5 10 15 30 45 60 90 120
1 Glipizide 1.343 3.122 4.871 6.442 14.11 16.87 19.79 28.92 2 F1 7.45 12.83 16.51 22.76 25.56 29.92 34.77 39.61 3 F2 8.12 13.55 17.11 25.23 27.44 32.12 36.88 41.73 4 F3 8.23 14.21 19.10 27.98 30.55 33.64 40.11 47.16 5 F4 15.56 20.11 23.01 30.44 40.75 45.11 53.88 61.90 6 F5 5.66 8.93 13.67 16.44 20.51 25.64 29.49 35.54 7 F6 7.23 9.12 14.67 17.55 23.88 29.09 34.66 40.56 8 F7 10.32 14.65 17.50 21.65 25.76 30.77 39.67 47.87 9 F8 16.34 18.56 20.44 24.76 29.55 36.82 45.03 58.61 10 F9 8.33 14.22 21.45 30.57 41.52 43.87 46.99 49.52 11 F10 10.34 18.98 28.84 36.95 48.98 53.75 58.01 61.98 12 F11 14.65 22.89 34.95 43.16 56.27 60.12 65.12 70.21 13 F12 20.66 29.56 40.12 55.27 64.21 70.15 75.55 80.13
Figure 8: Scatter chart of dissolution profile of various solid dispersion of glipzide with different polymer F1-F4=glipizide with Eudragit E-100, F5-F8= glipizide with Cros Carmellose, F9-F12= glipizide with Sodium Starch
Glycollate
Table 6: Physical evaluation of solid dispersion containing glipizide and SSG
S.NO. EVALUATION GLIPIZIDE : SSG (1:4)
1. Bulk density 0.37
2. Tapped density 0.42
3. Compressibility 11.8±3.55 4. Hausner ratio 1.13±0.05 5. Angle of repose 26°65”±0.63 6. Drug content 98.10%±0.2602
0 10 20 30 40 50 60 70 80 90
5 10 15 30 45 60 90 120
C
u
m
u
la
ti
v
e
P
er
ce
n
t
R
el
ea
se
Time (Min.)
Glipizide (GZ)
F1
F2
F3
F4
F5
F6
F7
F8
F9
F10
F11
Avalabile online at www.ijpda.com
Ankit Gupta et al; Vol: 2 Issue:2 Page:74-87
84
2. Formulation of tablets of glipizide solid dispersion
with sodium starch glycolate (1:4):
Tablets of final formulation prepared with direct compression method using the various ingredients listed in table no. 7 in different quantity as needed.
3. Evaluation of final formulation tablets:
The tablets prepared were flat faced round with 8mm diameter. Tablet thickness was almost uniform in all the formulations and values for tablets ranged from 3.2 to 3.5 mm. The weight variation values of tablets ranged from 0.18 gm to 0.21 gm. All the tablets passed weight variation test as the % weight variation was within the Pharmacopoeias limits of ±7.5% of the weight as shown in table no. 8.
Selected glipizide formulation meets the requirements of friability test, hence they are expected to show durability and withstand abrasion in handling, packaging and shipment. All tablet formulations had acceptable hardness (Table 8). The optimized hardness for each formulation was such that the tablets would be sufficiently hard to resist breaking during normal handling and yet soft enough to disintegrate after swallowing.
The disintegration time test revealed that all the formulae disintegrated in less than 5 minutes (Table 8). Hence we say that microcrystalline cellulose, the disintegrants have similar disintegration property, and therefore microcrystalline cellulose can be a good candidate of disintegrant.
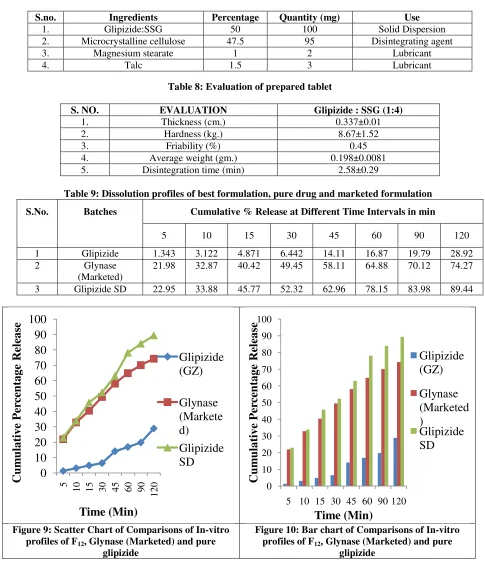
In vitro dissolution study was carried out for pure drug, Glynase (marketed) and solid dispersion in phosphate buffer pH 7.4 (table 9). The dissolution curve of Glipizide from F12 solid dispersion & Glynase presented in figure 9,10. The release rate profile were plotted as the percentage glipizide dissolved from the solid dispersion, from marketed and pure Glipizide verses time. In case of pure drug only 28.92% was dissolved at the end of 2 hours in phosphate buffer pH 7.4, but the dissolution of the drug was increased with increase in the carrier ratio in the formulations. From the result obtained, it can be seen that in phosphate buffer pH 7.4, Glynase marketed product, the percent release was found 74.27% & Glipizide: SSG solid dispersion (1:4 ratio), the percent release was found 89.44% up to 2 hours. This result demonstrates that glipizide dissolution rate is significantly enhanced by solid dispersion using solvent evaporation method. Solubility of solid dispersion is increased because of reduce particle size of drug, improved wettability & drug becomes in amorphous state.
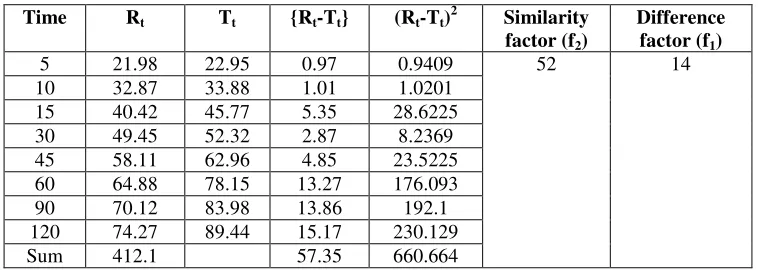
4. Dissolution Profile Comparison:
Rt = Cumulative percentage dissolved of reference product (marketed) at time t
Tt = Cumulative percentage dissolved of Test Product (Solid dispersion) at time t
The data for calculation of f1 and f2 were shown in Table 10. The similarity and dissimilarity factor obtained for glipizide was found to be within the standards. The standards for similarity factor and dissimilarity factor are 50-100 and 0-15.
CONCLUSION
Glipizide, an anti diabetic drug has poor water solubility there by posing problems in their formulations in absorption leads to poor bioavailability. As it is anti diabetic drug it has to be absorbed rapidly. So enhancement of the solubility of drug is important. Solid dispersions of glipizide were prepared with polymers (SSG, CCS) in different ratios by solvent evaporation method. From the studies it is concluded that the formulation with drug: polymer ratio 1:4 showed better dissolution rate in comparison with glipizide API and marketed drug. Solid dispersion of GZ: SSG showed faster release than other dispersions in ratio of 1:4. It was noticed from the study that increases in the polymer concentration increases the drug release from solid dispersions. The formulation was successful converted to tablet dosage form. The micromeritic characterizations of the powder blend were in favorable range. The tablets formulated were in acceptable hardness, disintegration time and in vitro release. The tablet of glipizide from optimized formulation shows almost 30percent increase in the dissolution from the marketed tablet. Thus this can be concluded from the work that such combination can further be used for the development of glipizide tablet for enhanced dissolution.
ACKNOWLEDGMENT
The author is thankful for the cooperation and facilities provided by the institute with kind permission of Prof.
Sanjeev Thacker, Director/Principal, Seth G.L. Bihani
Avalabile online at www.ijpda.com
Ankit Gupta et al; Vol: 2 Issue:2 Page:74-87
85
Table 7: Composition of the Glipizide 20mg tabletS.no. Ingredients Percentage Quantity (mg) Use
1. Glipizide:SSG 50 100 Solid Dispersion 2. Microcrystalline cellulose 47.5 95 Disintegrating agent 3. Magnesium stearate 1 2 Lubricant
4. Talc 1.5 3 Lubricant
Table 8: Evaluation of prepared tablet
S. NO. EVALUATION Glipizide : SSG (1:4)
1. Thickness (cm.) 0.337±0.01 2. Hardness (kg.) 8.67±1.52
3. Friability (%) 0.45
4. Average weight (gm.) 0.198±0.0081 5. Disintegration time (min) 2.58±0.29
Table 9: Dissolution profiles of best formulation, pure drug and marketed formulation
S.No. Batches Cumulative % Release at Different Time Intervals in min
5 10 15 30 45 60 90 120
1 Glipizide 1.343 3.122 4.871 6.442 14.11 16.87 19.79 28.92 2 Glynase
(Marketed)
21.98 32.87 40.42 49.45 58.11 64.88 70.12 74.27
3 Glipizide SD 22.95 33.88 45.77 52.32 62.96 78.15 83.98 89.44
Figure 9: Scatter Chart of Comparisons of In-vitro
profiles of F12, Glynase (Marketed) and pure
glipizide
Figure 10: Bar chart of Comparisons of In-vitro
profiles of F12, Glynase (Marketed) and pure
glipizide
0
10
20
30
40
50
60
70
80
90
100
5 10 15 30 45 60 90
1
2
0
C
u
m
u
lat
ive
P
er
ce
n
tage
R
el
eas
e
Time (Min)
Glipizide
(GZ)
Glynase
(Markete
d)
Glipizide
SD
0 10 20 30 40 50 60 70 80 90 100
5 10 15 30 45 60 90 120
C
u
m
u
lat
ive
P
er
ce
n
tage
R
el
eas
e
Time (Min)
Glipizide
(GZ)
Glynase
(Marketed
)
Avalabile online at www.ijpda.com
Ankit Gupta et al; Vol: 2 Issue:2 Page:74-87
86
Table 10: Calculation of Difference factor f1 and Similarity factor f2
Time Rt Tt {Rt-Tt} (Rt-Tt)2 Similarity
factor (f2)
Difference
factor (f1)
5 21.98 22.95 0.97 0.9409 52 14 10 32.87 33.88 1.01 1.0201
15 40.42 45.77 5.35 28.6225 30 49.45 52.32 2.87 8.2369 45 58.11 62.96 4.85 23.5225 60 64.88 78.15 13.27 176.093 90 70.12 83.98 13.86 192.1 120 74.27 89.44 15.17 230.129 Sum 412.1 57.35 660.664
REFERENCES
1. Aggarwal S, Gupta G D, Chaudhary S. 2010 Solid dispersion as an eminent strategic approach in solubility enhancement of poorly soluble drugs. International Journal of Pharmaceutical Sciences and Research, Volume 1, 12.
2. Glipizide. Drug Information online. Available from: http://www.drugs.com/glipizide. html [Accessed
09
thSeptember 2013
]3. Dehghan, M.H.G., Saifee, M. & Hanwate, R.M. 2010 Comparative Dissolution Study of Glipizide by Solid Dispersion Technique. Journal of Pharmaceutical Science and Technology; 2 (9): 293-297.
4. Kataria, M.K. and Bhandari, A. 2012 Biopharmaceutics Drug Disposition Classification System: An Extension of Biopharmaceutics Classification System. International Research Journal of Pharmacy. 3(3). , 5-10
5. Chaudhary, D., Kumar, S. & Gupta, G.D. 2009 Enhancement of solubility and dissolution of glipizide by solid dispersion (kneading) technique. Asian Journal of Pharmaceutics, 3(3), 245-251. 6. Dehghan, M.H.G., Saifee, M. & Hanwate, R.M.
2010 Comparative Dissolution Study of Glipizide by Solid Dispersion Technique. Journal of Pharmaceutical Science and Technology; 2 (9), 293-297.
7. Adel, M.A. and Ahmed, S.A. 2010 Preparation and Evaluation of Glipizide Tablets Containing both Enhanced and Sustained Release Solid Dispersions. International Journal of Pharmaceutical Sciences and Nanotechnology, 2(4), 714-725.
8. Rote, H., Thakare, V.M., Tekade, B.W., Zope, R.P., Chaudhari, R.Y. & Patil, V.R. 2012 Solubility enhancement of glipizide using solid dispersion technique. World Journal of Pharmaceutical research, 1(4), 1096-1115.
9. Hanwate, R.M., Dehghan, M.H.G., Saifee, M. & Kondapure, A.A. 2012 Study of dissolution behaviour of glipizide pvp k 30 solid dispersion prepared by solvent evaporation method. International Journal of Universal Pharmacy and Life Sciences, 2(1), 2249-6793.
10. Shukla, M., Rathore, P., Jain, A. & Nayak, S. 2010 Enhanced solubility study of glipizide using different solubilization techniques. International Journal of Pharmacy and Pharmaceutical Sciences, 2(2), 46-48.
11. Chaudhary, D., Kumar, S. & Gupta, G.D. 2009 Enhancement of solubility and dissolution of glipizide by solid dispersion (kneading) technique. Asian Journal of Pharmaceutics, 3(3), 245-251. 12. Mahajan, H.S., Dhamne, M.R., Gattani, S.G., Rasal
A.D. & Shaikh, H.T. 2011 Enhanced Dissolution Rate of Glipizide by a Liquisolid Technique. International Journal of Pharmaceutical Sciences and Nanotechnology, 3(4), 1205-1213
13. Kushare, S.S. and GATTANI, S.G. 2012 Microwave-generated bionano composites for solubility and dissolution enhancement of poorly water-soluble drug glipizide: in-vitro and in-vivo studies. Journal of Pharmacy and Pharmacology, 79-93.
14. Sarkar, B.K. and Hardenia, S.S. 2011 Microemulsion Drug Delivery System: For Oral Bioavailability Enhancement of Glipizide. Journal of Advanced Pharmacy Education & Research, 1(4), 195-200.
15. Patel, D., Chaudhary, P., Mohan, S. & Khatri, H. 2012 Enhancement of glipizide dissolution rate through nanoparticles: Formulation and In vitro evaluation. e-Journal of Science & Technology (e-JST), 7(4), 19-31.
Avalabile online at www.ijpda.com
Ankit Gupta et al; Vol: 2 Issue:2 Page:74-87
87
17. Lachman L., Lieberman H.A. & Kanig J.L. Thetheory and practice of industrial pharmacy, 3rd Edition, Varghese Publishing House, Bombay: 293-303, (1991)
18. Aulton, M E, Pharmaceutics- The Science of Dosage Form Design. 2 Edition, Harcourt Publishers Limited and Elsevier Science Limited, 241, (2002)
19. USP 28 NF 23 2005 The Official Compendia of Standards. Published by United States Pharmacopeial Convention, Inc. Rockville, MD, Asian Edition, Printed in Canada by webcome Ltd. Toronto, Ontorio