MJCCA9 – 678 ISSN 1857-5552 e-ISSN 1857-5625
Received: January 9, 2015 UDC: 543.552:[544.65:544.4
Accepted: February 19, 2015 Original scientific paper
ELECTRODE KINETICS FROM A SINGLE SQUARE-WAVE VOLTAMMOGRAM
Valentin Mirčeski1*, Dariusz Guziejewski2, Rubin Gulaboski3
1
Institute of Chemistry, Faculty of Natural Sciences and Mathematics,
Ss Cyril and Methodius University, P.O. Box 162, 1000 Skopje, Republic of Macedonia 2
Department of Inorganic and Analytical Chemistry, University of Lodż, Tamka 12, 91-403 Lodż, Poland 3
Faculty of Medical Sciences, Goce Delčev University, Štip, Republic of Macedonia
A novel methodological approach for processing electrochemical data measured under conditions of square-wave voltammetry (SWV) is proposed. The methodology takes advantage of the chronoam-perometric characteristics of the electrochemical system observed in the course of the voltammetric ex-periment, which are commonly not considered in conventional SWV. The method requires processing of a single voltammogram only, measured under given set of the potential modulation parameters (i.e. SW frequency and height of the potential pulses). The core idea is to analyze the variation of the current with time, considering the last quarter time period of each potential pulse of the potential modulation, instead of measuring the single current value from the very end of the pulses. Hence, a single point current meas-urement is replaced with a multisampling current procedure, leading to a series of new SW voltammo-grams measured at different time increments of each potential pulse. The novel method is illustrated by the theoretical analysis of a quasireversible electrode reaction of a dissolved and surface confined redox couple, as well as a reversible electrode reaction preceded by a chemical equilibrium reaction (CrEr mechanism).
Keywords: square-wave voltammetry; electrode kinetics; chronoamperometry; simulations
ОПРЕДЕЛУВАЊЕ НА КИНЕТИКАТА НА ЕЛЕКТРОДНИ РЕАКЦИИ ОД ЕДИНИЧЕН КВАДРАТНОБРАНОВ ВОЛТАМОГРАМ
Во овој труд е предложен нов метод за процесирање на податоците од електрохемиските мерења во услови на квадратнобранова волтаметрија. Методот се базира на хроно-амперометриските својства на електрохемиските системи што се забележуваат во текот на волтаметрискиот експеримент, а кои најчесто не се разгледуваат во конвенционалната квадратно-бранова волтаметрија. Методот подразбира процесирање на единичен волтамограм што е измерен при дадени инструментални параметри (квадратнобранова фреквенција и амплитуда). Главната идеја на овој пристап е да се анализираат промените во измерената струја како функција од времето, притоа земајќи ја предвид само последната четвртина од временскиот интервал на секој потенцијален пулс, наместо мерењето на единична вредност на струјата на крајот од секој потенцијален пулс. На овој начин класичната процедура во квадратнобрановата волтаметрија на мерење на струјата во една точка се заменува со повеќекратно мерење на струјата, што резултира со серија волтамограми измерени во различни временски интервали од секој потенцијален пулс. Новиот метод е тестиран преку теоретска анализа на волтамограмите на квазиреверзибилна електродна реакција симулирана за електродни реакции што се одвиваат од растворена и атсорбирана состојба на учесниците во електродната реакција, како и на реверзибилна електродна реакција што е поврзана со претходна хемиска реакција (CrEr механизам).
Клучни зборови: квадратнобранова волтаметрија; кинетика на електродни реакции;
хроноамперометрија; теоретски симулации
1. INTRODUCTION
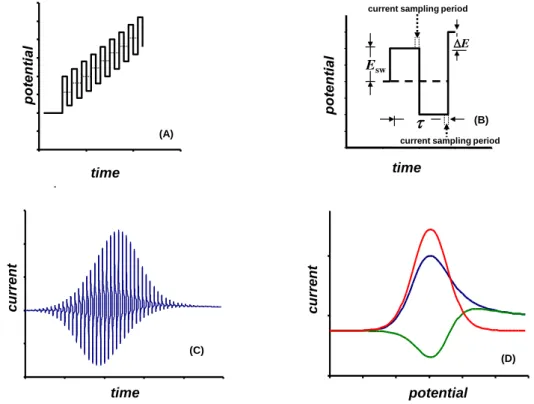
Square-wave voltammetry (SWV) is a well established electroanalytical technique in the fam-ily of pulsed voltammetric techniques attributed with superior performances from both analytical and electrokinetic perspectives [1–6]. As could be deduced from the shape of the potential modula-tion (Fig. 1A) and the current sampling procedure in the course of a single potential cycle (Fig. 1B), SWV could be seen as a repetitive double-step chronoamperometric technique, as at each step of the staircase ramp, two equal, oppositely directed potential pulses are imposed. Yet, though the cur-rent variation could be monitored in the whole du-ration of the voltammetric experiment (Fig. 1C), the current is sampled only at the end of each
po-tential pulse (Fig. 1B) in order to construct the conventional SW voltammogram, as presented in Figure 1D. The strategy to sample the current at the end of a potential pulse is well justified as it is a means to discriminate against the charging cur-rent and to enhance the noise-to-signal ratio as a critical determinant of the sensitivity of any analyt-ical technique. Besides, calculation of a net com-ponent (net) of the SW voltammetric response as
a difference between the measured forward (f)
and backward (c) voltammetric component (Fig.
1D) further participates in the enhanced sensitivity of the technique. On the other hand, similar to cy-clic voltammetry, the forward and backward volt-ammetric components (Fig. 1D) provide mechanis-tic information on the studied electrode reaction.
Fig. 1 time
(A)
(C)
time
c
urre
nt
(D)
potential
c
urre
nt
Esw
t
DE
time
(B) current sampling period
current sampling period
Fig. 1. (A) Potential waveform, (B) singlepotential cycle, (C) variation of the current with time and (D) typical dimensionless voltammogram in square-wave voltammetry. The dimensionless response in (D) consists of a forward (f –blue line), backward (b – green line) and net (net – red line) component.
When applied for mechanistic [7–11] and electrokinetic studies [12–16], SWV is most fre-quently conducted by varying the frequency (f) of the potential modulation, as the most critical time parameter of the voltammetric experiment, deter-mining the duration of a single potential cycle t (f
= 1/t), during which the studied electrode reaction is shifted in both anodic and cathodic directions. Together with the step potential (DE, cf. Fig. 1B), the frequency determines scan rate (v) of the stair-case potential ramp (v = f DE), hence the overall
time of the voltammetric experiment. We have, however, recently demonstrated that kinetic meas-urements are even possible at a constant time of the voltammetric experiment only by virtue of the potential pulses height (i.e. the SW amplitude, Esw,
cf. Fig. 1B) variation [15, 16]. The latter methods revealed how versatile SWV is, from both mecha-nistic and electrokinetic point of view.
volt-ammetric features, originating mainly from spe-cific chronoamperometric characteristics of studied electrode reactions [17–19] combined with the cur-rent sampling procedure in SWV. A typical exam-ple is the so called “quasireversible maximum” of surface confined [20, 21] and adsorption compli-cated electrode mechanisms [22–24], where the maximum of the frequency normalized voltammet-ric response is achieved for quasireversible proc-esses with a moderate rate of the charge transfer reaction. Another example is the splitting of the response of fast surface confined electrode proc-esses [25], or procproc-esses occurring in a limiting dif-fusion space [26], where the relative position of the anodic and cathodic SW voltammetric components is opposite compared to the typical voltammetric pattern observed under conditions of cyclic ammetry [27]. Moreover, the most peculiar volt-ammetric feature was observed for adsorption complicated ECi mechanism [18, 19], where the
backward voltammetric component, affected by the irreversible follow-up chemical reaction (i.e. Ci
step), increases by accelerating the chemical reac-tion, being completely opposite to the common cyclic voltammetric behaviour.
Given the high sensitivity of SWV to the chronoamperometric characteristics of a studied electrode reaction, it is reasonable to assume that more detailed analysis of the current variation with time in the course of potential pulses will be bene-ficial for electrokinetic purposes. In the present communication a novel and simple methodological approach for analyzing SW voltammetric data is proposed based on the analysis of the current varia-tion with time, considering the last porvaria-tion of each potential pulse. As will be demonstrated, a wealth of kinetic information could be derived from the chronoamperometric analysis of a SW voltammo-gram, enabling estimation of the electrode kinetics from a single voltammogram. The proposed meth-odology is illustrated by a theoretical analysis of a quasireversible electrode reaction of a dissolved redox couple, surface confined electrode reaction, and an electrode reaction coupled with a preceding chemical reaction, i.e. an CrEr mechanism.
2.RESULTS AND DISCUSSION
A quasireversible electrode reaction of two chemically stable, dissolved (sol) redox species (Ox/Red) at a planar macroscopic electrode is con-sidered (eq. 1). The mathematical modelling and the solution for numerical simulations are given elsewhere [1, 3, 5].
R(sol) ↔ O(sol) + ne– (1)
Theoretical results are presented in a form of dimensionless current defined as = I(nFAc*)–1 (Df)–0.5, where I is the current, n is the number of exchanged electrons, A is the electrode surface ar-ea, c* is the bulk concentration of initially present Red species, D is the common diffusion coefficient for both Ox and Red, and f is the frequency of the potential modulation. Voltammetric features of the system are well known [1, 3, 5, 15], being pre-dominantly determined by the electrode kinetic
parameter
f
D
k
s
, which relates the rate of theelectrode reaction, represented by the standard rate constant ks (cm s–1), with the diffusion rate
(
D
f
). Net peak currents of conventional SWvoltammograms (Dp) depend sigmoidally on
log(). For a normalized amplitude of nEsw = 50
mV, Dp increases linearly with log() over the
interval –0.7 log() –0.2 [15]. The latter kinet-ic region can be used for estimation of the standard rate constant ks. To this goal, a series of SW
volt-ammograms need to be recorded by varying the SW frequency, which affects the value of the
elec-trode kinetic parameter (
f
D
k
s
), keeping inmind that ks and D are typical constants for a single
electrode reaction under given experimental con-ditions.
In the present methodology only a single voltammogram is required for kinetic analysis of the system. Specifically, a single voltammogram is simulated for a given set of kinetic parameters (ks, D,and electron transfer coefficient ) and constant values of the potential modulation parameters (f,
Esw and DE). However, instead of applying a
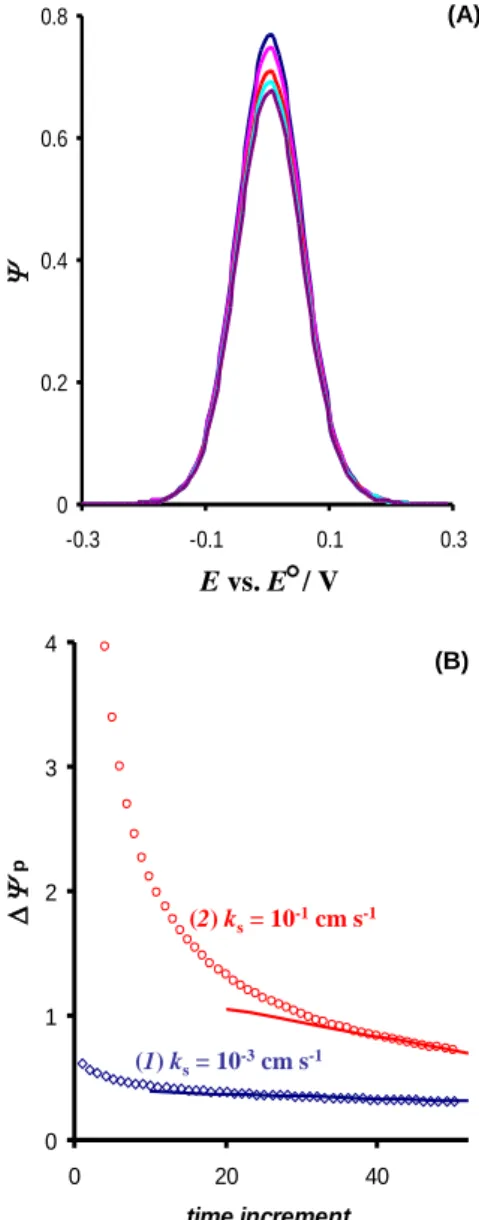
chronoamperometric characteristics of the system, reflecting the diminishing of the current with time during each potential pulse. On the other hand, all net voltammograms shown on Figure 2A are iden-tical with respect to the peak potential and half-peak width.
Fig. 2
0 0.2 0.4 0.6 0.8
-0.3 -0.1 0.1 0.3
(A)
0 1 2 3 4
0 20 40
time increment
D
p
(1)ks= 10-3cm s-1
(2)ks= 10-1cm s-1 (B)
Evs. E
/ V
Fig. 2
0 0.2 0.4 0.6 0.8
-0.3 -0.1 0.1 0.3
(A)
0 1 2 3 4
0 20 40
time increment
D
p
(1)ks= 10-3cm s-1
(2)ks= 10-1cm s-1 (B)
Evs. E
/ V
Fig. 2. Quasireversible electrode reaction of a dissolved redox couple. (A) Net voltammograms constructed by sampling the current at 40th, 42nd, 46th, 48th and 50th time increment of each potential pulse (from top to the bottom). The total time incre-ments of each pulse are 50. The conditions of the simulations are: frequency f = 10 Hz, amplitude Esw = 50 mV, step poten-tial DE = 10 mV, electron transfer coefficient = 0.5, standard
rate constant ks = 0.01 cm s–1, diffusion coefficient D = 5 10–6 cm2 s–1, and number of exchanged electrons n = 1. (B) Variation of the net peak current of voltammograms constructed at differ-ent time incremdiffer-ents of potdiffer-ential pulses versus time incremdiffer-ents for the standard rate constant of 10–3 (1) and 10–1 cm s–1 (2). The other conditions of the simulations are identical as for panel (A).
In addition, Figure 2B represents the varia-tion of net peak currents of all new SW
voltammo-grams with time increments, considering the whole duration of potential pulses, for two different rate constants of the electrode reaction. The last portion of the curves of Figure 2B, which corresponds to the last quarter of each potential pulse, could be approximated with a line, the slope of which de-pends on the electrode kinetics. Thus, the analysis of net peak currents of new SW voltammograms, constructed by multisampling the current at the last portion of each potential pulse, could provide an access to the electrode kinetics. More detailed analysis is presented in Figure 3, conducted for dif-ferent reversibility of the electrode reaction. Ob-viously, for electrode reactions featuring fast elec-tron transfer (log() > 1) the line is independent on the electrode reaction rate, as the decreasing of the current in the course of potential pulses depends on the rate of diffusion only. For the electrode reac-tions featuring moderate electrode transfer, cha-racterizedwith –2 log() 1, the lines of Figure 3 are sensitive to the electrode kinetics, taking into account both the slope and the intercept. Thus, the latter dependency can serve for electrode kinetics measurements, as the variation of the current in the course of potential pulses is affected by both elec-trode kinetics and diffusional mass transport. For electrode reactions with a very slow electron trans-fer step (log() < –2) the line is hardly dependent on the electrode kinetics again, and only approxi-mate estimation of the electrode kinetics can be done.
0 0.2 0.4 0.6 0.8 1
39 41 43 45 47 49 51
Fig. 3 time increment
D
p
(1-2)
(3)
(4)
(5)
(6)
(7)
(8)
Fig. 3. Quasireversible electrode reaction of a dissolved redox couple.Variation of the net peak current of voltammograms constructed by sampling the currents at different time incre-ments of potential pulses versus time increincre-ments, for the elec-trode kinetic parameter log(): 2.15 (1); 1.15 (2); 0.15 (3); –0.15 (4); –0.35 (5); –0.65 (6); –0.85 (7), and –1.8 (8). The other conditions of the simulations are identical as for Fig. 2.
quasireversible surface confined electrode reaction of two chemically stable species [5, 25] (eq. 2).
R(ads) ↔ O(ads) + ne– (2)
For this mechanism, sampling the current at different time intervals of potential pulses results in dramatic changes in the morphology of the re-sponse, as depicted in Figures 4A and B. Obvious-ly, the latter figure shows the phenomenon of split-ting of the net multi-sampled net voltammograms, achieved by increasing the time of the current sampling [25]. The phenomena of splitting is well-known and it is one of the most intriguing feature of SWV of surface confined electrode reactions attributed with high electron transfer rate [25]. The splitting is a peculiar, but useful phenomenon that can be utilized for complete thermodynamic and kinetic characterization of the surface electrode reaction, by analyzing the peak potential separation between split peaks. The present analysis reveals that the phenomenon of splitting is a direct conse-quence of the specific chronoamperometric fea-tures of the surface electrode reaction, and it could be even demonstrated by measuring a single SW voltammogram and applying a multi-sampling cur-rent procedure. The voltammetric profile presented in Figures 4A and B is attributed with a typical value of the electrode kinetic parameter, i.e. the electrode kinetic parameter = 3 and the normal-ized amplitude nEsw = 50 mV. For these parameters
the splitting appears at net SW voltammogram cor-responding to 44th time increment. For > 3, the splitting appears at 40th time increment, while for 2.5 the splitting vanishes and it could be ob-served only under conditions of large amplitudes,
nEsw > 50 mV. Hence, the evolution of the
volt-ammetric profile of multisampled net SW voltam-mograms can be effectively exploited for estima-tion of the electrode kinetics. Let us recall that the electrode kinetic parameter in the case of a surface
confined electrode reaction is defined as
f
k
sur
,where ksur is the surface standard rate constant (s–1)
[25]. Figure 4B shows the linear variation of the peak currents of multi-sampled net voltammo-grams with time, for different standard rate con-stants. Obviously, both slope and intercept of the liner functions are strongly sensitive to the elec-trode kinetics, the phenomenon being more pro-nounced compared to the electrode reaction of dis-solved redox species (cf. Fig. 3). These results are well understandable as the chronoamperometric characteristics of a surface confined electrode
re-action are dependent on the electrode rere-action rate only, while in the case of the electrode reaction of dissolved redox species the chronoamperometric features are affected by both electrode kinetics and mass transport.
Finally, the proposed methodology is tested on the electrode mechanism coupled with a chemi-cal reaction. Specifichemi-cally, reversible CrEr
mecha-nism is assessed, where the reversible electrode reaction (Er) (eq. 4) is preceded by a chemical
re-action (Cr) (eq. 3), characterized with a first order
forward (kf) and backward (kb) rate constants (s–1),
and the equilibrium constant K = kf/ kb [1, 5].
(3)
R ↔ O + ne– (4)
It is worth recalling that the voltammetric features of the CrEr are predominantly dictated by
the chemical kinetic parameter
f k kf b
andthe equilibrium constant K. While the latter pa-rameter determines the position of the chemical equilibrium (eq. 3), the represents the rate con-stant of re-establishing the chemical equilibrium during the time-frame of the current measurement in every single pulse. In the course of the voltam-metric experiment, the chemical equilibrium is dis-turbed by proceeding of the electrode reaction (eq. 4), prompting the chemical reaction to reestablish the equilibrium conditions at rate dictated by .
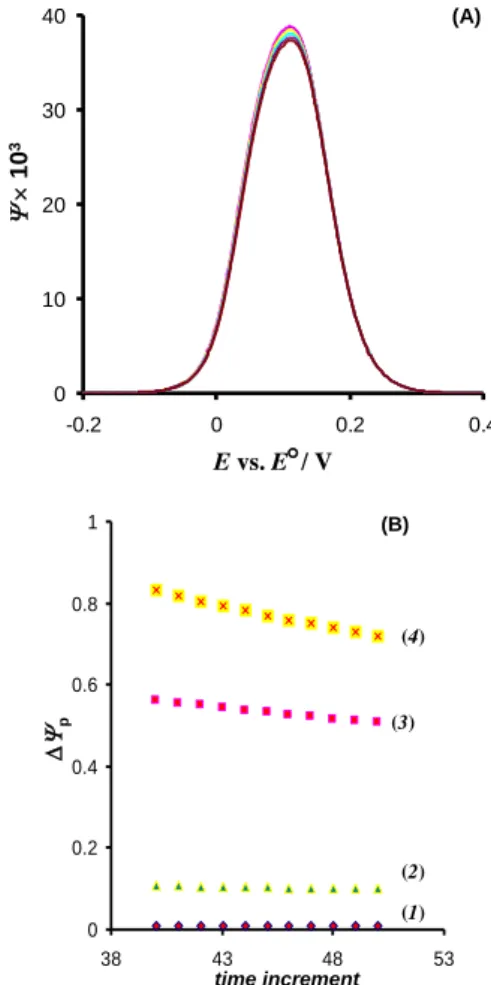
Figure 5A depicts the evolution of SW volt-ammograms constructed by the multisampling pro-cedure for the CrEr mechanism. The simulations
represent a specific case attributed with log(K) = –3 and log() = 2, which means that the chemical equilibrium is significantly shifted toward the ini-tial electrochemically inactive reactant Y, while the chemical system is able rapidly to re-establish the disturbed equilibrium. Figure 5A reveals that the declining of net voltammograms is very slow by increasing the sampling time. In particular, the net peak current of the voltammograms measured at the end of the potential pulse (50th time increment) is only 10% less than the voltammogram measured at the 40th time increment (i.e. the beginning of the last quarter of the potential pulse). For comparison, the decreasing of the current for simple reversible electrode reaction (eq. 1) is about 14% for the cor-responding conditions. Moreover, in the case of the surface confined electrode reaction (eq. 2), the cor-responding decrease could be up to 50% (cf. Fig. 4A).
Y
↔
R
k
fFig. 4A 0
0.1 0.2 0.3 0.4 0.5
-0.2 -0.1 0 0.1 0.2
Evs. E/ V
(A)
-0.4 -0.3 -0.2 -0.1 0 0.1 0.2 0.3 0.4
-0.2 -0.15 -0.1 -0.05 0 0.05 0.1 0.15 0.2
Fig. 4B Evs. E/ V
(B)
0.3 0.5 0.7 0.9 1.1
38 43 48 53
time increment
D
p
(1) (2)
(3) (C)
Fig. 4C
Fig. 4. Quasireversible surface confined electrode reaction. (A) Dimensionless net voltammograms constructed by sam-pling the current at 40th, 42nd, 44th, 46th, 48th and 50th time increment of each potential pulse (from top to the bottom). (B) Forward and backward SW voltammetric components corre-sponding to the net SW voltammograms depicted in panel (A). The time increment increases in the direction of the arrows. The total number of time increments of each pulse is 50. The conditions of the simulations are: frequency f = 10 Hz, nor-malized amplitude nEsw = 50 mV, step potential DE = 2 mV, electron transfer coefficient = 0.5, and standard rate constant
ksur = 30 s–1. (C) Variation of the net peak current of voltam-mograms constructed at different time increments of potential pulses versus time increments for the surface standard rate constant of 5 (1), 10 (2), and 20 s–1 (3). The other conditions of the simulations are identical as for panel (A). The dimen-sionless current is defined as = I(n F A*f)– 1, where *
is the total surface concentration.
Thus, the chronoamperometric characteris-tics of CrEr mechanism are significantly different
compared to the simple reversible reaction of a dissolved redox couple (eq. 1), which is clearly revealed by the multisampled SW voltammograms. Indeed, the exhaustion of the diffusion layer with electroactive material is significantly compensated by the chemical reaction (eq. 3), which causes a slow decreasing of the current in the course of po-tential pulses. As shown by panel B of Figure 5, the decreasing of the net peak currents of multi-salmpled voltammograms is insignificant for equi-librium constant log(K) –2 and is becoming ob-vious for log(K) –1, implying that the present methodology can be utilized for measuring the ki-netics and thermodynamics of the chemical reac-tion coupled to the reversible electrode reacreac-tion by fitting of the experimental and simulated data.
0 0.2 0.4 0.6 0.8 1
38 43 48 53
Fig. 5
0 10 20 30 40
-0.2 0 0.2 0.4
Evs. E/ V
10
3
(A) (B)
(1) (2) (4)
(3)
time increment
D
p
0 0.2 0.4 0.6 0.8 1
38 43 48 53
Fig. 5 0
10 20 30 40
-0.2 0 0.2 0.4
Evs. E/ V
10
3
(A) (B)
(1) (2) (4)
(3)
time increment
D
p
Fig. 5. Reversible CrEr electrode mechanism of a dissolved redox couple. (A) Net voltammograms constructed by sam-pling the current at 40th, 42nd, 46th, 48th and 50th time incre-ment of each potential pulse (from top to the bottom). Chemi-cal kinetic parameter is log() = 2 and the equilibrium constant is log(K) = –3. The parameters of the potential modulation are
3. CONCLUSIONS
The foregoing theoretical analysis of three different electrode mechanisms confirmed that chronoamperometric analysis of SW voltammo-grams is possible, resulting in novel and beneficial methodology in electrode kinetics. An important advantage of the proposed methodology is that it requires analysis of a single voltammogram only. Another important aspect is that the proposed methodology is based on a multisampling current procedure at a constant frequency of the potential modulation (i.e., at a constant duration of potential pulses), which is different than the conventional analysis in which the frequency of the potential modulation is changed. In the latter conventional approach all frequency-related kinetic parameters of the studied electrode mechanism are changed in the course of the experiment, whereas in the pre-sent methodology these parameters are kept unal-tered, which simplifies the electrokinetic analysis. The proposed methodology is based on a com-pletely new concept, which was not considered so far either in the theory or in the experimental anal-ysis. The implementation of the method in the ex-perimental analysis is expected to be simple, re-quiring the used potentiostat to provide all meas-ured current data in the course of each potential pulse, instead of selecting only the current values from the very end of potential pulses, as commonly done in conventional SWV so far.
Acknowledgements: VM acknowledges Alexander
von Humboldt foundation for the financial support from the Research Group Linkage Programme 3.4-Fokoop-DEU/1128670, as well as the support of DAAD foundation through multilateral project “International Masters and Post-graduate Programme in Materials Science and Catalysis” (MatCatNet). DG acknowledges with gratitude the support from the National Science Centre of Poland through the grant 2011/03/N/ST4/01338. VM also acknowledges the support through the COST Action CM1302.
REFERENCES
[1] J. Osteryoung, J. J. O`Dea, Square-wave voltammetry, In: A. J. Bard (Ed.), Electroanalytical Chemistry, Marcel Dekker, New York, Vol 14, p. 209 (1986).
[2] G. N. Eccles, Recent advances in pulse, cyclic and square-wave voltammetric analysis, Crit. Rev. Anal. Chem., 22, 345 (1991).
[3] M. Lovrić, Square-wave voltammetry, In: F. Scholz (Ed.) Electroanalytical methods, Springer, Berlin, 2002. [4] D. de Souza, S. A. S. Machado, L. A. Avaca,
Square-wave voltammetry, Quim. Nova, 26, 81–89 (2003). [5] V. Mirčeski, S. Komorsky-Lovrić, M. Lovrić,
Square-wave Voltammetry: Theory and Application, (Ed.) F. Scholz. Springer Verlag, Heidelberg, 2007.
[6] V. Mirčeski, R. Gulaboski, M. Lovrić, I. Bogeski, R. Kappl, M. Hoth, Square-wave voltammetry: A review on the recent progress, Electroanalysis, 25, 2411–2422 (2013).
[7] M. Lovrić, D. Jadresko, Theory of square-wave volt-ammetry of quasireversible electrode reactions using an inverse scan direction, Electrochim. Acta, 55, 948–951 (2010).
[8] A. Molina, M. M. Moreno, C. Serna, M. Lopez-Tenes, J. Gonzalez, N. Abenza, Study of multicenter redox mole-cules with square wave voltammetry, J. Phys. Chem. C, 111, 12446–12450 (2007).
[9] E. Laborda, D. Suwatchara, N. V. Rees, M. C. Hen-stridge, A. Molina, R. G. Compton, Variable tempera-ture study of electro-reduction of 3-nitrophenolate via cyclic and square wave voltammetry: Molecular insights into electron transfer processes based on the asymmetric Marcus-Hush model, Electrochim. Acta, 110, 772–779 (2013).
[10] V. Mirčeski, A. Bobrowski, J. Zarebski, F. Spasovski, Electrocatalysis of the first and second kind: Theoretical and experimental study in conditions of square-wave voltammetry, Electrochim. Acta, 55, 8696–8703 (2010). [11] R. Gulaboski, Surface ECE mechanism in protein film
voltammetry – A theoretical study under conditions of square-wave voltammetry, J. Solid State Electrochem., 13, 1015–1024 (2009).
[12] J. Gonzalez, C. M. Soto, A. Molina, Square wave vol-tammetry and voltcoulometry applied to electrocatalytic reactions. Oxidation of ferrocyanide at a ferrocene modi-fied gold electrode, J. Electroanal. Chem., 634, 90–97 (2009).
[13] X. Huang, L. Wang, S. Liao, Method of evaluation of electron transfer kinetics of a surface-confined redox system by means of Fourier transformed square wave voltammetry, Anal. Chem., 80, 5666–5670 (2008). [14] V. Mirčeski, F. Quentel, M. L’Her, Chiral recognition
based on the kinetics of ion transfers across liquid/liquid in-terface, Electrochem. Commun., 11, 1262–1264 (2009). [15] V. Mirčeski, E. Laborda, D. Guziejewski, R. G.
Comp-ton, New approach to electrode kinetic measurements in square-wave voltammetry: amplitude-based quasi-reversible maximum, Anal. Chem., 85, 5586–5594 (2013).
[16] V. Mirčeski, D. Guziejewski, K. Lisichkov, Electrode kinetic measurements with square-wave voltammetry at a constant scan rate, Electrochim. Acta, 114, 667–673 (2013).
[17] J. Gonzalez, C. M. Soto, A. Molina, Square wave vol-tammetry and voltcoulometry applied to electrocatalytic reactions. Oxidation of ferrocyanide at a ferrocene modi-fied gold electrode, J. Electroanal. Chem., 634, 90–97 (2009).
[18] V. Mirčeski, Square-wave voltammetry of an EC reac-tion of a partly adsorbed redox couple, J. Electroanal. Chem., 508, 138–149 (2001).
[20] S. Komorsky-Lovrić, M. Lovrić, Square-wave voltam-metry of quasi-reversible surface redox reactions, J. Electroanal. Chem., 384, 115−122 (1995)
[21] V. Mirčeski, M. Lovrić, Quasireversible maximum in cathodic stripping square-wave voltammetry, Electroa-nalysis,11, 984–989 (1999).
[22] M. Lovrić, S. Komorsky-Lovrić, R.W. Murry, Adsorp-tion effects in square-wave voltammetry of totally irre-versible redox reactions, Electrochim. Acta,33, 739–744 (1988)
[23] M. Lovrić, S. Komorsky-Lovrić, Square-wave voltammetry of an adsorbed reactant, J. Electroanal. Chem., 248, 239−253 (1988).
[24] V. Mirčeski, M. Lovrić, Square-wave voltammetry of a cathodic stripping reaction complicated by adsorption of the reacting ligand, Anal. Chim. Acta,386, 47–62 (1999). [25] V. Mirčeski, M. Lovrić, Split square-wave
voltammo-grams of surface redox reactions, Electroanalysis, 9, 1283–1287 (1997).
[26] V. Mirčeski, Charge transfer kinetics in thin-film volt-ammetry. Theoretical study under conditions of square-wave voltammetry, J. Phys. Chem. B, 108, 13719–13725 (2004).