A Randomized Controlled Study of
Neurofeedback for Chronic PTSD
Bessel A. van der Kolk1,2,3*, Hilary Hodgdon1,3, Mark Gapen1, Regina Musicaro1,4, Michael
K. Suvak1,4, Ed Hamlin5,6, Joseph Spinazzola1,3,4
1 Trauma Center at Justice Resource Institute (JRI), Brookline MA, United States of America, 2 Boston
University School of Medicine, Department of Psychiatry, Boston, MA, United States of America, 3 National Child Traumatic Stress Network, Brookline, Massachusetts, United States of America, 4 Department of Psychology, Suffolk University, Boston MA, United States of America, 5 University or North Carolina School of Medicine, Department of Psychiatry, Chapel Hill, NC, 6 Western Carolina University, Psychology Department, Cullowhee, NC, United States of America
Abstract
Introduction
Brain/Computer Interaction (BCI) devices are designed to alter neural signals and, thereby, mental activity. This study was a randomized, waitlist (TAU) controlled trial of a BCI, EEG neurofeedback training (NF), in patients with chronic PTSD to explore the capacity of NF to reduce PTSD symptoms and increase affect regulation capacities.
Study Design
52 individuals with chronic PTSD were randomized to either NF (n = 28) or waitlist (WL) (n = 24). They completed four evaluations, at baseline (T1), after week 6 (T2), at post-treatment (T3), and at one month follow up (T4). Assessment measures were:1. Traumatic Events Screening Inventory (T1); 2. the Clinician Administered PTSD Scale (CAPS; T1, T3, T4); 3. the Davidson Trauma Scale (DTS; T1-T4) and 4. the Inventory of Altered Self-Capacities
(IASC; T1-T4). NF training occurred two times per week for 12 weeks and involved a se-quential placement with T4 as the active site, P4 as the reference site.
Results
Participants had experienced an average of 9.29 (SD = 2.90) different traumatic events. Post-treatment a significantly smaller proportion of NF (6/22, 27.3%) met criteria for PTSD than the WL condition (15/22, 68.2%),χ2 (n = 44, df = 1) = 7.38, p = .007. There was a significant
treatment condition x time interaction (b = -10.45, t = -5.10, p<.001). Measures of tension reduction activities, affect dysregulation, and affect instability exhibited a significant Time x Condition interaction. The effect sizes of NF (d = -2.33 within, d = - 1.71 between groups) are comparable to those reported for the most effective evidence based treatments for PTSD.
Discussion
Compared with the control group NF produced significant PTSD symptom improvement in individuals with chronic PTSD, as well as in affect regulation capacities. NF deserves further
a11111
OPEN ACCESS
Citation: van der Kolk BA, Hodgdon H, Gapen M, Musicaro R, Suvak MK, Hamlin E, et al. (2016) A Randomized Controlled Study of Neurofeedback for Chronic PTSD. PLoS ONE 11(12): e0166752. doi:10.1371/journal.pone.0166752
Editor: Yutaka J. Matsuoka, National Cancer Center, JAPAN
Received: March 8, 2016
Accepted: October 27, 2016
Published: December 16, 2016
Copyright:©2016 van der Kolk et al. This is an open access article distributed under the terms of theCreative Commons Attribution License, which permits unrestricted use, distribution, and reproduction in any medium, provided the original author and source are credited.
Data Availability Statement: All relevant data are within the paper.
Funding: Funders did not contribute to the design or execution of the study
investigation for its potential to ameliorate PTSD and to improve affect regulation, and to clarify its mechanisms of action.
Scientific background and rationale
The potential of brain-computer interaction devices (BCI) to alter neural signals and associ-ated mental activity makes them strong candidates to emerge as a new generation of
psychiat-ric interventions [1]. BCIs utilize fMRI or EEG as information about brain activity and
provide visual and/or auditory feedback to alter neural activity. Thus far, most BCI research has focused on helping physically disabled users communicate commands, such as stimulation
of muscles in paralyzed individuals and in stroke rehabilitation [2].
However, a wide variety of BCIs are currently being explored for performance
enhance-ment, mental focus and tranquility [3]. EEG neurofeedback (NF) training represents one of
the earliest applications of BCIs, and even though it has been in use for about three decades with well documented effects in over 2000 peer reviewed scientific publications, serious
ques-tions remain about its clinical utility and the validity and scientific rigor of extant research [4].
NF is thought to indirectly modify behavior by changing neuronal activation or connectiv-ity patterns in the CNS via operant conditioning. NF has been shown to be able to reshape
neural activity, as measured by electroencephalogram (EEG) frequency components [5–7] and
fMRI [8–11]. NF research has focused mainly on performance enhancement (e.g. [12]) and on
clinical conditions such as Attention Deficit Hyperactivity Disorder (ADHD)[13–16]. A few
studies have investigated its potential in the treatment of depression[17,18], substance abuse
[19], and posttraumatic stress disorder (PTSD)[20–22].
In NF training, neural activity is recorded from scalp electrodes and fed back in real time to subjects in a readily understood, visual format (simple computer games). NF associated EEG changes have been correlated with changes in various functional outcomes, including cortico-motor excitability, memory, cognition, sleep, and mood, as well as increases in affect
regula-tion and executive funcregula-tion, sustained attenregula-tion, and working memory [23–25].
Specific objectives
NF training may help individuals with PTSD acquire self-regulation skills by stabilizing EEG activity, and thereby improve focus and attention. The objective of this study was to investigate whether NF could substantially alter affect regulation capacities, and thereby improve PTSD symptomatology. This is particularly important because recovery from PTSD depends on
being able to manage intense arousal [26]. Impaired affect regulation is a major cause of
dis-continuation of exposure-based PTSD treatments [27–29]. Improving affect regulation has
been shown to 1) reduce the severity of PTSD symptoms, 2) decrease risk behaviors (e.g. sui-cidal and self-injurious behaviors, substance use) and 3) make subsequent exposure therapy
more effective [30,31]. EEG markers of PTSD disordered arousal include increased cortical
activation (manifested in reduced alpha activity) and increased theta/alpha ratio [32–34].
Brain activity in the alpha-1 band has been linked to attentional processes [35,36], while theta
power has been linked to working memory performance [37,38], both of which are impaired
in PTSD [26]. A recent study examining potential mechanisms for NF’s effects on PTSD found
alterations in arousal (i.e., an increased sense of calm) correlated with changes in intrinsic
Study Design
This randomized, waitlist-controlled trial evaluated the efficacy of NF to increase affect regula-tion and reduce PTSD symptoms in adults with multiple trauma exposures and treatment resistant PTSD (i.e., having received six or more months of trauma focused therapy without sustained self-reported clinical improvement).
Study Sample
Following IRB review by the Justice Resource Institute Institutional Review Board and specific approval by that IRB of all aspects of the study, adults 18–58 years old with treatment non-responsive PTSD were recruited via newspaper and radio ads, the Trauma Center website (www.traumacenter.org), and solicitation from mental health professionals. The study was conducted between July 1, 2012 and July 1, 2015. Eligible subjects signed the IRB approved consent form that spelled out procedures, risks and benefits of the study. Trauma history was
obtained by self-report ad scored on the Traumatic Events Screening Inventory [39], an
18-item self-report measure assessing lifetime occurrence of both acute (e.g. accident, natural disaster, loss) and interpersonal (e.g. neglect, separation, physical / sexual / emotional abuse, domestic violence) forms of trauma. Individuals were eligible if they met DSM-IV criteria for
PTSD per the Clinician Administered PTSD Scale (CAPS) [40], and had received weekly
trauma-focused psychotherapy for a minimum of six months. After completion of all initial evaluations subjects were randomly assigned by a computer generated randomization program to either 12 weeks of twice weekly NF or a waitlist (WL) control condition. Both groups were required to continue all ongoing treatments (psychotherapeutic and pharmacological) and to refrain from making changes in their current treatment regimens for the duration of this study. Participants in the WL condition were provided 24 NF sessions free of charge after the time 3 (week 12) follow-up evaluation.
Exclusion criteria included: unstable medical condition; receiving disability benefits; active suicide risk or life-threatening self-mutilation; psychotic or bipolar disorder; traumatic brain injury (TBI); history of seizures; current substance or alcohol abuse; ongoing traumatic expo-sure (such as domestic violence); changing ongoing treatment during the course of the study;
Global Assessment of Functioning (GAF) score<40.
Of the 52 subjects in the ITT sample, 26 (50%) were on psychotropic mediation 21 (40%) were not, and 5 (10%) had missing data. A breakdown of medication rates and types for each group were as follows: waitlist control; 10 subjects on medication (41.7% of waitlist group) with 6 subjects (25%) on SSRIs, 3 subjects (12.5%) on benzodiazepines, 2 subjects (8.3%) on antianxiety, 2 subjects (8.3%) on buproprion, 2 subjects (8.3%) on an SSNRI, and 1 subject (4.2%) on a tricyclic antidepressant. Active NFB; 16 subjects on medication (57.1% of NF group), with 7 subjects (25%) on SSRIs, 4 subjects (14.3%) on stimulants, 3 subjects (10.7%) on antipsychotics, 5 subjects (17.8%) on benzodiazepines, and 3 subjects (10.7%) on buproprion.
Evaluation Procedures
the CAPS was established at 80% agreement. Strenuous efforts were made to keep evaluators blind to treatment condition, though in one case the blinding was inadvertently compromised.
NF Intervention Procedures
The NF system utilized EEGer neurofeedback software manufactured by EEG Spectrum Inter-national Education and Research, Inc. The system utilized a Procomp2 amplifier manufac-tured by Thought Technology LTD. The lowpass filtering is provided by the EEGer software. The training sites were fixed for all participants, and involved a sequential placement with T4 as the active site, P4 as the reference site, and the left ear (A1) as the ground (consistent with
previous research that demonstrates increased R temporal lobe activation in PTSD)[41,42].
Training was intended to teach subjects to alter the power spectrum of certain filtered fre-quencies of activity; specifically, we sought to help subjects decrease the power spectrum of slow (2–6 Hz) and fast (22–36 Hz) activity while simultaneously increasing the power spec-trum of mid-range (10–13 Hz starting point) activity. By convention, the slow activity we sought to decrease spans the delta and theta range and is generally associated with drowsiness and sleep, while the fast activity is called “high beta” and is associated with high levels of mental
activation [43]. In contrast, we sought to help subjects enhance alpha activity, which is
gener-ally associated with a calm, relaxed state.
The training protocol employed standard inhibit frequencies of 2–6 HZ for slow activity and 22–36 HZ for fast EEG activity and a beginning reward frequency of 10–13 HZ. These
spectral bands were selected based on previous research in studies of NF for PTSD [32,33],
including the results of our pilot study [22]. Subjects completed a short checklist after every
session, our internally generated “Checklist of Changes Observed After Neurofeedback Train-ing”. Adjustment of the reward band was based on subjects’ responses to the questions on that checklist, and followed a flexible, principle-based manual that provided rules for adjusting the training protocol.
NF training process
alertness or mental clarity; nausea; depressive symptoms; and decreased energy/fatigue)
cap-tured by theChecklist for Changes After Neurofeedback, as well as clinical judgment. If
partici-pants reported significant over-arousal symptoms for at least two training sessions, the reward frequency was lowered by 1 Hz. This procedure was continued until the participant reported no change, positive benefit, or symptoms of under-arousal. If the participant reported
symp-toms of under-arousal, the reward band was raised by½Hz until those symptoms remitted.
Training time started at 12 minutes; training time was raised in three-minute increments par-ticipants reported a positive change. All but one participant achieved an endstate of thirty min-utes per NF session.
Clinician Supervision, Fidelity, Assessment and Monitoring
NF sessions were conducted by experienced NF clinicians. Clinicians completed a session fidelity checklist designed to mirror the specific components of each session, requiring the rat-ing of the full, partial or unsuccessful implementation of each component, any factors that impeded protocol adherence, and any modifications to protocol required. Changes to the starting protocol, such as frequency adjustments, were automatically recorded by the NFB soft-ware. Clinicians met weekly with the supervisor to review specifics of each NFB session and individual subject logs, session fidelity checklists, and protocol adjustments. Twenty percent of sessions were randomly selected for neurofeedback protocol review to assure that they
matched adjustments dictated by supervisory staff.
Measures
1. Clinician Administered PTSD Scale (CAPS) [40], a clinician administered interview that is
considered the gold standard for assessing PTSD, was the primary outcome measure of the study. Each of the 17 DSM-IV-TR PTSD symptoms are assessed with regard to their frequency and intensity over the past month using a 5-point scale (0–4). Symptoms endorsed with a fre-quency equal to or greater than one, and an intensity of equal to or greater than two are con-sidered to meet the minimum threshold to count as a symptom of PTSD. The CAPS can be scored to indicate whether an individual meets the DSM criteria for a PTSD diagnoses, and frequency and intensity items can be summed to produce a symptom severity rating that can range from 0–136, with severity score equal to or greater than 45 necessary for a PTSD diagno-sis. The PTSD diagnoses variable was used to evaluate inclusion criteria, while the continuous PTSD severity score was the primary outcome for the study analyses.
2.The Davidson Trauma Scale (DTS) [44] is a self-report measure of PTSD assessing the
severity and frequency of PTSD symptoms that is structured similarly to CAPS with partici-pants rating the frequency and severity of the 17 DSM-IV-TR PTSD symptoms using a 0–4 scale. PTSD severity scores were computed by adding all of the frequency and intensity items of each symptom, which, like the CAPS, produces a continuous score that can range from 0–136.
3. Inventory of Altered Self-Capacities (IASC) [45] is a 63-item standardized self-report
measure consisting of seven subscales that assess the following domains of self-related psycho-logical problems: Interpersonal Conflicts, Idealization-Disillusionment, Abandonment Con-cerns, Identity Impairment, Susceptibility to Influence, Affect Dysregulation, and Tension Reduction Activities. The number of items per subscale ranges from 5–9 with each item rated using a 1 (never) to 4 (often) scale producing a continuous score for each subscale.
during NF-training (or the corresponding time on the waitlist). Including an additional assess-ment increases power to detect significant results in longitudinal studies. The IASC was administered as a secondary measure to evaluate whether NF impacted relevant emotion-regu-lation and interpersonal processes.
Statistical Power
A post-hoc power analysis using a Monte Carlo simulation method [46] with the Mplus
statis-tical software [47] was conducted to estimate obtained power. The Monte Carlo simulation
method provides precise estimates of power for specific, hypothesized or evaluated, models
and it can adjust for the missing data patterns in the observed data [48]. We conducted the
power analysis using the estimates obtained from the multilevel growth curve models (GCMs, described below) using the CAPS and the DTS. These power analysis indicated power esti-mates of .56 and .77 to detect a d = .80 (usually considered the cutoff for large effect sizes) dif-ference in change from pre-treatment to the follow-up assessment in the CAPS and DTS severity scores, respectively, between the two treatment conditions.
Participants
After initial phone screens 71 individuals were invited for a baseline assessment. Nineteen did not meet study criteria and were excluded: seven were on disability, six received subclinical scores on the CAPS, two due reported ongoing domestic abuse, one suffered a substance abuse relapse, one started another treatment, and one reported symptoms of psychosis. The remain-ing 52 individuals were randomized to either the WL (n = 24) or NF (n = 28) conditions and made up the intention-to-treat sample (ITT). Of the 28 individuals randomized to the NF group, six dropped out of treatment: four after having been randomized, but before starting
the actual treatment (Fig 1). After starting NF two subjects dropped out—one had a previously
undisclosed traumatic brain injury, and one subject reported increased flashbacks. Thus, 22 of the 28 participants assigned to NF completed the protocol. Of the 24 participants randomized to the WL group, one withdrew consent before treatment due to a medical illness; another was excluded after revealing that he received disability, leaving 22 participants assigned to the WL condition who completed the protocol. A chi-squared analysis showed that there was no sig-nificant difference between NF (6/28) and WL (2/24) ITT participants who failed to complete
the protocol conditions,χ2(n= 52, df = 1) = 1.70,p= .192.
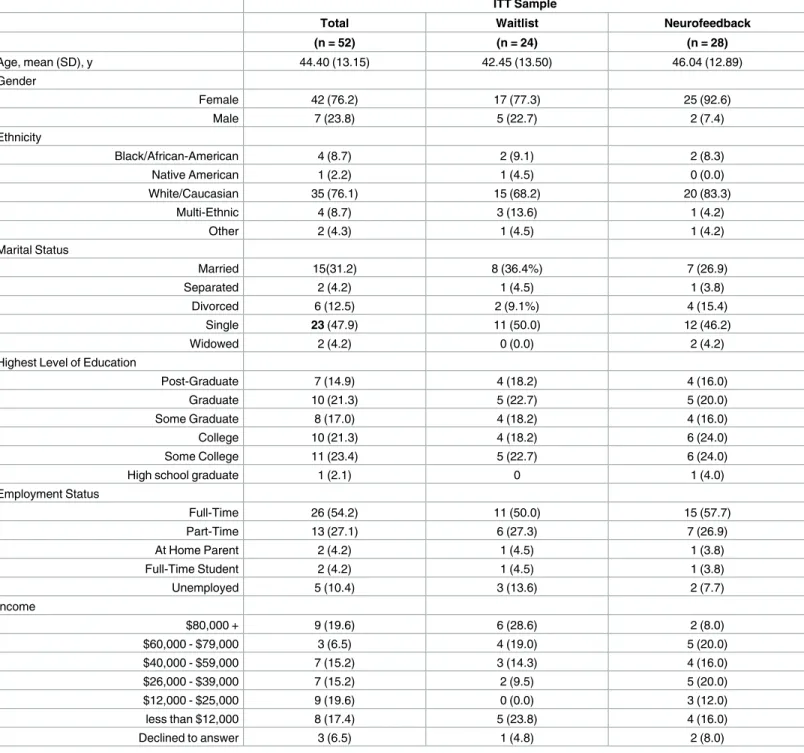
Table 1presents demographic information for the entire sample and as a function of treat-ment condition. The sample was on average middle-aged and mostly white and female. A series of one-way ANOVAS and chi-squared tests revealed no statistically significant differ-ences in demographic characteristics across conditions. A second series of one-way ANOVAs and chi-squared tests were then conducted to compare the treatment completers to ITT partic-ipants who dropped out or were excluded from the study. There was a significant difference
for only one demographic variable, marital status,χ2(n= 48, df = 1) = 15.62,p= .004. Because
drop-outs were relatively evenly distributed across conditions, we decided not to include mari-tal status as a co-variate.
Data Analyses
Chi-square analyses were first were used to evaluate the impact of NF on PTSD diagnoses (present/absent). Next multilevel Growth Curve Modeling (GCM) using the mixed procedure
of the Statistical Package for the Social Sciences (SPSS [48]) examined change in PTSD
become the standard for analyzing psychotherapy outcome data because of several advantages that this approach offers (i.e., efficiency in dealing with missing observations, efficient and
powerful estimation techniques, and modeling flexibility [49]). This allowed us to include the
entire intention-to-treat sample without using data imputation procedures. Time was modeled by including the number of weeks since baseline assessment (0, 6, 12, and 16, for pre-treat-ment, mid-treatpre-treat-ment, post-treatpre-treat-ment, and one-month post-treatment assessments). Prior to examining the impact of treatment condition on change, various unconditional change models (examining change without predictors) were evaluated to determine the most reliable manner to model time (e.g., linear using number of months, quadratic using number of months and number of months squared, or non-linear using a natural-log transformation of number of months). The best fitting change model was determined by examining the difference in the-2 Log Likelihood (i.e., deviance) estimate between competing models, which follows a chi-square distribution. To examine the impact of treatment condition on change in outcomes, a treatment
Fig 1. Flow of participants through the trial.
condition dummy-coded variable was added as a predictor of change parameters (to test treat-ment condition x time interactions). Effect sizes (d) for differences in change between
condi-tions was computed by the procedures described by Fiengold [50] producing effect size
estimates comparable to those derived from more traditional repeated measures designs (e.g., repeated measures ANOVA).
Table 1. Sample Demographic Information
ITT Sample
Total Waitlist Neurofeedback
(n = 52) (n = 24) (n = 28)
Age, mean (SD), y 44.40 (13.15) 42.45 (13.50) 46.04 (12.89)
Gender
Female 42 (76.2) 17 (77.3) 25 (92.6)
Male 7 (23.8) 5 (22.7) 2 (7.4)
Ethnicity
Black/African-American 4 (8.7) 2 (9.1) 2 (8.3)
Native American 1 (2.2) 1 (4.5) 0 (0.0)
White/Caucasian 35 (76.1) 15 (68.2) 20 (83.3)
Multi-Ethnic 4 (8.7) 3 (13.6) 1 (4.2)
Other 2 (4.3) 1 (4.5) 1 (4.2)
Marital Status
Married 15(31.2) 8 (36.4%) 7 (26.9)
Separated 2 (4.2) 1 (4.5) 1 (3.8)
Divorced 6 (12.5) 2 (9.1%) 4 (15.4)
Single 23 (47.9) 11 (50.0) 12 (46.2)
Widowed 2 (4.2) 0 (0.0) 2 (4.2)
Highest Level of Education
Post-Graduate 7 (14.9) 4 (18.2) 4 (16.0)
Graduate 10 (21.3) 5 (22.7) 5 (20.0)
Some Graduate 8 (17.0) 4 (18.2) 4 (16.0)
College 10 (21.3) 4 (18.2) 6 (24.0)
Some College 11 (23.4) 5 (22.7) 6 (24.0)
High school graduate 1 (2.1) 0 1 (4.0)
Employment Status
Full-Time 26 (54.2) 11 (50.0) 15 (57.7)
Part-Time 13 (27.1) 6 (27.3) 7 (26.9)
At Home Parent 2 (4.2) 1 (4.5) 1 (3.8)
Full-Time Student 2 (4.2) 1 (4.5) 1 (3.8)
Unemployed 5 (10.4) 3 (13.6) 2 (7.7)
Income
$80,000 + 9 (19.6) 6 (28.6) 2 (8.0)
$60,000 - $79,000 3 (6.5) 4 (19.0) 5 (20.0)
$40,000 - $59,000 7 (15.2) 3 (14.3) 4 (16.0)
$26,000 - $39,000 7 (15.2) 2 (9.5) 5 (20.0)
$12,000 - $25,000 9 (19.6) 0 (0.0) 3 (12.0)
less than $12,000 8 (17.4) 5 (23.8) 4 (16.0)
Declined to answer 3 (6.5) 1 (4.8) 2 (8.0)
Note: Except for Age, for which mean and standard deviation is reported, n’s with percentages in parenthesis are reported.
Subject Attrition and Missing Data
One of the benefits of using multilevel GCM is that we could use maximum likelihood estima-tion, so that subject attrition and missing data did not affect the analyses as they would for less nuanced methods. Data were screened for patterns of missingness as MLE does assume that data is missing at random.
Results
On average participants endorsed exposure to 9.29 (SD= 2.90) of the 18 traumatic events
assessed by the TESI, which did not significantly vary as a function of condition,F(1,43) = .02,
p= .879. The most frequently endorsed events were childhood caregiver emotional abuse
(78.8%), sexual abuse (69.2%) and domestic violence, 61.5%. At baseline, all participants met past month criteria for PTSD, and there was not a significant difference between WL (18/24,
75.0%) and NF conditions (24/27, 88.9%) meeting PTSD criteria during the past week,χ2(n=
51,df= 1) = 1.69,p= .194. At week 12 (post-treatment) assessment, a higher proportion of
WL participants (15/22, 68.2%) met criteria for PTSD than participants receiving NF (6/22,
27.3%),χ2(n= 44,df= 1) = 7.38,p= .007. At the week 16 (one-month post-treatment), a
higher proportion of WL participants (17/19, 90%) met criteria for PTSD in the past month
than participants receiving NF (8/19, 42%),χ2(n= 38,df= 1) = 9.47,p= .002.
CAPS severity scores were approximately normally distributed at each time point, with the highest skewness-to-standard-error of skewness ratio being1.91 at the post-assessment. The unconditional change model for the CAPS severity score indicated that modeling time as the natural-log transformation of number of weeks since baseline fit the data best accounting for 79.4% of the within-subjects variance. This pattern of change was characterized by large initial decreases in symptoms (during treatment) that flatten out over time (during the follow-up
period). A significant treatment condition x time interaction emerged (b= -10.45,t= -5.10,
p<.001). The nature of this effect is depicted inFig 2with change over time and associated
effect size estimates reported inTable 2. Both the WL (d= -.62) and NF (d= -2.33) conditions
exhibited significant decreases from the pre-treatment to the second (1 month) post treatment
assessment; however, this decrease was substantially larger for the NF condition (d= -1.71).
Both groups exhibited small decreases in CAPS severity score from the first to the second
post-treatment to follow-up that did not significantly differ between conditions (d= -.16). The
aver-age decrease in CAPS score from the pre-treatment to the 1-month post treatment assessments was 40.35 for the NF condition and 10.78 for the WL group, the former well above and the latter well below the commonly adopted 20-point change in CAPS criteria used to indicate
clinically significant change [49]. The bottom portion ofTable 2depicts the results when
restricting the analyses to completers only and indicates that the results when using the ITT sample or the completers only sample were virtually identical.
Estimates for the means of the self-report measures administered at pre-treatment,
mid-treat-ment, post-treatmid-treat-ment, and at the follow-up assessments are displayed inTable 3with the
corre-sponding change parameters depicted inTable 4. DTS scores were also approximately normally
distributed at each time point, with the highest skewness-to-standard error of skewness ration being 3.60 at the post-treatment assessment. A linear change model best fit the data for the DTS total score. Mirroring the CAPS severity score findings, a significant treatment condition x time
interaction emerged for the DTS (b= -1.52,t= -3.89,p<.001). The WL condition did not
exhibit a significant decrease in pre-post change in the DTS (d= -.25) while the NF condition
exhibited a significant and large decrease (d= -1.23) with a large effect size difference between
was virtually identical. Therefore, we present the results for the self-report measures for only the ITT sample.
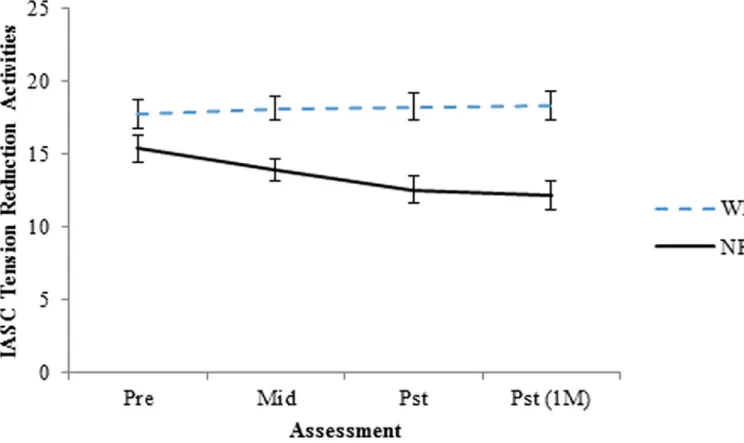
As depicted inTable 4, four of the IASC subscales (tension reduction activities, affect
dysre-gulation total, affect skill deficits, affect instability) exhibited significant Time x Condition
interactions, with a fifth (affect instability) approaching statistical significance (p= .053). The
interpersonal conflict and identity related subscales did not exhibit significant Time x Condi-tion interacCondi-tions. The IASC subscale with the largest difference between the two condiCondi-tions
Fig 2. Change in PTSD symptom severity (Total CAPS score) as a function of treatment condition. WL = waitlist, NF = Neurofeedback.
Standard Error bars included at each assessment.
doi:10.1371/journal.pone.0166752.g002
Table 2. Pre-treatment, Post-treatment, and One-Month Post-treatment CAPS levels and Change Estimates
Sample Pre Pst 1 Month Post ΔPre-1 Month Post effect-size (d)
n M (95%CI) n M (95%CI) n M (95%CI) M (95%CI) Pre-Pst(1M)
ITT WL 24 76.24 (69.13, 83.36) 22 66.49 (57.39, 75.6) 19 65.46 (55.83, 75.1) -10.78 (-19.1, -2.48) -0.62 N = 52 NF 28 79.45 (72.86, 86.04) 22 42.95 (34.1, 51.8) 19 39.1 (29.69, 48.51) -40.35 (-48.67, -32.12) -2.33 Difference 3.2 (-6.5, 12.9) -23.54 (-36.24, -10.85) -26.36 (-39.83, -12.9) -29.6 (-41.33, -17.87) -1.71 Completers WL 22 75.18 (67.84, 82.51) 22 65.68 (56.48, 74.88) 19 64.68 (54.96, 74.39) -10.5 (-18.83, -2.19) -0.61 N = 44 NF 22 80.98 (73.64, 88.31) 22 44.12 (34.92, 53.31) 19 40.23 (30.51, 49.95) -40.75 (-49.11, -32.47) -2.38 Difference 5.8 (-4.57, 16.17) -21.56 (-34.57, -8.55) -24.45 (-38.19, -10.7) -30.28 (-42.05, -18.51) -1.77
Note: WL = waitlist condition, NF = Neurofeedback condition, Pre = pre-treatment assessment, Pst = immediate post-treatment assessment, Pst (1M) = 1-month post-treatment assessment; M = mean, 95%CI = 95% Confidence Interval, d = effect size indicator with .2, .5, and .8 indicating small, medium, and large effect sizes.
Table 3. Pre-treatment, Mid-Treatment, Post-treatment, and One-Month Post-treatment Means and Confidence Intervals for Self-Report Measures
Variable Condition Pre Mid Pst Pst (1M)
Est. (95%CI) Est. (95%CI) Est. (95%CI) Est. (95%CI)
Davidson Trauma Scale (DTS)
WL 62.97 (52.47, 73.48) 60.59 (51.45, 69.74) 58.21 (49.26, 67.16) 56.62 (47.09, 66.15) NF 67.28 (57.55, 77.00) 55.74 (47.25, 64.22) 44.19 (35.76, 52.63) 36.5 (27.4, 45.6) Difference 4.30 (-10.01, 18.62) -4.86 (-17.33, 7.62) -14.02 (-26.32, -1.72) -20.12 (-33.3, -6.95)
Difference d 0.18 -0.23 -0.66 -0.89
IASC interpersonal conflicts
WL 23.49 (21.11, 25.87) 23.04 (20.87, 25.22) 22.6 (20.23, 24.97) 22.3 (19.61, 24.98) NF 19.22 (16.99, 21.45) 18.28 (16.21, 20.34) 17.33 (15.05, 19.62) 16.71 (14.09, 19.32) Difference -4.27 (-7.53, -1.01) -4.77 (-7.77, -1.77) -5.26 (-8.56, -1.97) -5.59 (-9.34, -1.84)
Difference d -0.76 -0.94 -0.96 -0.90
IASC tension reduction activities
WL 17.75 (15.86, 19.63) 18.14 (16.44, 19.83) 18.26 (16.4, 20.12) 18.31 (16.35, 20.27) NF 15.55 (13.78, 17.32) 13.25 (11.61, 14.89) 12.52 (10.70, 14.33) 12.20 (10.28, 14.12) Difference -2.2 (-4.78, 0.39) -4.89 (-7.25, -2.53) -5.74 (-8.34, -3.14) -6.11 (-8.85, -3.37)
Difference d -0.50 -1.25 -1.35 -1.36
IASC affect dysregulation total
WL 25.14 (22.11, 28.17) 24.63 (22.03, 27.23) 24.12 (21.46, 26.78) 23.78 (20.81, 26.75) NF 22.35 (19.5, 25.19) 20 (17.54, 22.46) 17.65 (15.08, 20.22) 16.08 (13.18, 18.99) Difference -2.79 (-6.95, 1.36) -4.63 (-8.21, -1.05) -6.47 (-10.17, -2.77) -7.7 (-11.85, -3.54)
Difference d -0.39 -0.76 -1.04 -1.13
IASC affect skill deficits
WL 13.68 (11.69, 15.66) 13.4 (11.72, 15.09) 13.13 (11.43, 14.83) 12.95 (11.07, 14.83) NF 12.18 (10.32, 14.04) 10.83 (9.24, 12.43) 9.49 (7.85, 11.13) 8.59 (6.76, 10.43) Difference -1.5 (-4.22, 1.22) -2.57 (-4.89, -0.25) -3.64 (-6, -1.28) -4.35 (-6.98, -1.72)
Difference d -0.33 -0.65 -0.94 -1.04
IASC affect instability
WL 11.45 (10.00, 12.90) 11.22 (9.95, 12.49) 10.99 (9.68, 12.3) 10.84 (9.38, 12.29) NF 10.15 (8.79, 11.51) 9.17 (7.97, 10.37) 8.18 (6.92, 9.45) 7.52 (6.10, 8.95) Difference -1.3 (-3.29, 0.69) -2.06 (-3.80, -0.31) -2.81 (-4.63, -0.99) -3.32 (-5.35, -1.28)
Difference d -0.38 -0.68 -0.90 -0.97
IASC identity impairement total
WL 23.16 (19.77, 26.54) 22.9 (19.88, 25.92) 22.65 (19.52, 25.79) 22.48 (19.02, 25.95) NF 21.40 (18.23, 24.58) 19.75 (16.9, 22.61) 18.1 (15.08, 21.13) 17.00 (13.62, 20.39) Difference -1.75 (-6.39, 2.89) -3.15 (-7.31, 1.01) -4.55 (-8.91, -0.19) -5.48 (-10.32, -0.64)
Difference d -0.22 -0.44 -0.62 -0.68
IASC idealization-disillusionment
WL 19.51 (16.53, 22.49) 19.44 (16.55, 22.33) 19.37 (16.25, 22.49) 19.32 (15.89, 22.75) NF 16.31 (13.58, 19.05) 15.12 (12.45, 17.79) 13.93 (10.99, 16.87) 13.13 (9.86, 16.40) Difference -3.2 (-7.24, 0.84) -4.32 (-8.25, -0.39) -5.44 (-9.73, -1.15) -6.19 (-10.93, -1.45)
Difference d -0.46 -0.65 -0.75 -0.77
IASC abandonment concerns
WL 21.5 (18.28, 24.73) 21.4 (18.45, 24.36) 21.37 (18.17, 24.58) 21.36 (18.01, 24.71) NF 20.25 (17.22, 23.28) 16.9 (14.06, 19.74) 15.83 (12.71, 18.95) 15.37 (12.09, 18.65) Difference -1.26 (-5.68, 3.17) -4.51 (-8.61, -0.40) -5.54 (-10.01, -1.07) -5.99 (-10.68, -1.30)
Difference d -0.17 -0.65 -0.73 -0.76
IASC susceptibility to influence
was tension reduction, with the NF group exhibiting significant decreases and the WL group exhibiting slight increases. The effect size for the difference in tension reduction activities from pre-treatment to the post-treatment assessment was -.75.
Discussion
Twenty-four sessions of NF produced significant improvements in PTSD symptomatology in multiply traumatized individuals with PTSD who had not responded to at least six months of trauma-focused psychotherapy, compared to a waitlist control group that continued to receive
treatment as usual. The effect sizes of NF in this study (d= -2.33 within, d = - 1.71 between
groups) is comparable to the results reported for the best evidence based treatments for PTSD: Prolonged Exposure, CBT and EMDR, which, like this study, also generally have employed
TAU control groups, and better than any published drug intervention for PTSD [51]. The rate
of completion of the NF protocol (79%) was comparable to reported exposure-based PTSD
treatments (76%) [52]. In this study 72.7% of the NF sample no longer met criteria for PTSD.
This is comparable to the 62% reported in metanalyses of other treatment studies [53]. Only
one participant in the active treatment condition (4%) reported significant side effects, an increase in flashbacks.
The NF subjects also had statistically significant improvements in measures of affect regula-tion, identity impairment, abandonment concerns, and tension reduction activities. In con-trast with most evidence based therapies for PTSD, which focus on processing memories of traumatic events, the target of NF is neural regulation and stabilization. Since lack of
self-regu-lation has been identified as a principal cause of failure of exposure-based treatments [27–30],
NF may be particularly helpful for traumatized individuals who are too anxious, dissociated or dysregulated to tolerate exposure based treatments. Finding cost-effective treatments for PTSD and other psychiatric conditions is particularly important in light of the limitations of existing treatments. Our results suggest that NF deserves further investigation for its potential to improve affect regulation, executive functioning and attention.
The former Director of the US National Institutes of Mental Health, calling for the develop-ment of a next generation of interventions, has noted that four decades of drug developdevelop-ment has resulted in over 20 antipsychotics and over 30 antidepressants that have not demonstrably
reduced the morbidity or mortality of mental disorders [54]. In an emerging new framework
mental disorders are considered to be driven, at least in part, by abnormalities in underlying
neural circuits [55]. A concerted effort is currently underway to map these networks, the
so-called “human connectome project” [56,57]. The fact that mental disorders frequently are
associated with abnormal brain-wave patterns and neural connectivity, including those
mea-sured by the EEG, lends support this approach [58].
Table 3. (Continued)
Variable Condition Pre Mid Pst Pst (1M)
Est. (95%CI) Est. (95%CI) Est. (95%CI) Est. (95%CI)
WL 19.08 (15.83, 22.34) 18.64 (15.78, 21.51) 18.2 (15.36, 21.04) 17.91 (14.87, 20.94) NF 17.79 (14.73, 20.84) 16.12 (13.41, 18.82) 14.44 (11.71, 17.17) 13.32 (10.37, 16.28) Difference -1.29 (-5.76, 3.17) -2.53 (-6.47, 1.42) -3.76 (-7.7, 0.18) -4.58 (-8.82, -0.35)
Difference d -0.17 -0.38 -0.56 -0.64
Note: WL = waitlist condition, NF = Neurofeedback condition, Pre = pre-treatment assessment, Pst = immediate post-treatment assessment, Mid = mid-treatment assessment, Pst (1M) = 1-month post-mid-treatment assessment; M = mean, 95%CI = 95% Confidence Interval, d = effect size indicator with .2, .5, and .8 indicating small, medium, and large effect sizes.
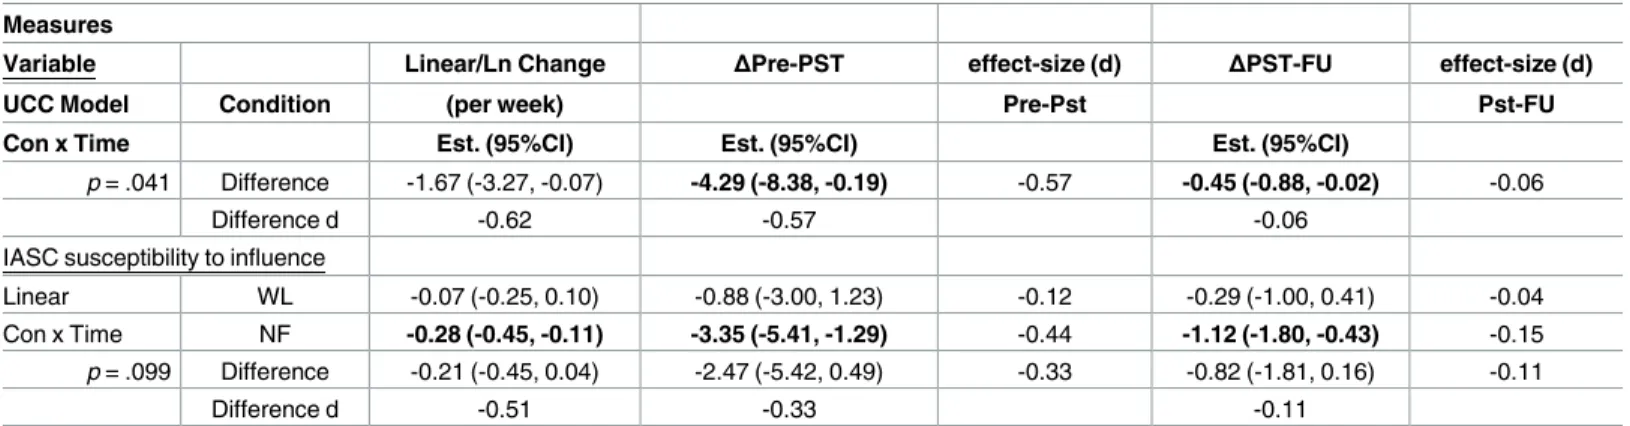
Table 4. Change Estimates for Self-Report Measures
Measures
Variable Linear/Ln Change ΔPre-PST effect-size (d) ΔPST-FU effect-size (d)
UCC Model Condition (per week) Pre-Pst Pst-FU
Con x Time Est. (95%CI) Est. (95%CI) Est. (95%CI)
Davidson Trauma Scale (DTS)
Linear WL -0.4 (-0.97, 0.17) -4.76 (-11.6, 2.07) -0.19 -1.59 (-3.87, 0.69) -0.06
Con x Time NF -1.92 (-2.47, -1.37) -23.08 (-29.68, -16.48) -0.92 -7.69 (-9.89, -5.49) -0.31 p<.001 Difference -1.53 (-2.32, -0.74) -18.32 (-27.82, -8.82) -0.73 -6.11 (-9.27, -2.94) -0.24
Difference d -1.16 -0.73 -0.24
IASC interpersonal conflicts
Linear WL -0.07 (-0.23, 0.08) -0.9 (-2.8, 1) -0.15 -0.3 (-0.93, 0.33) -0.05
Con x Time NF -0.16 (-0.31, 0) -1.89 (-3.74, -0.03) -0.32 -0.63 (-1.25, -0.01) -0.11 p = .456 Difference -0.08 (-0.3, 0.14) -0.99 (-3.64, 1.67) -0.17 -0.33 (-1.21, 0.56) -0.06
Difference d -0.23 -0.17 -0.06
IASC tension reduction activities
Natural Log WL 0.2 (-0.51, 0.91) 0.51 (-1.31, 2.32) 0.11 0.05 (-0.14, 0.24) 0.01
Con x Time NF -1.18 (-1.87, -0.49) -3.03 (-4.81, -1.26) -0.64 -0.32 (-0.50, -0.13) -0.07 p = .007 Difference -1.38 (-2.37, -0.39) -3.54 (-6.08, -1.00) -0.75 -0.37 (-0.64, -0.11) -0.08
Difference d -0.86 -0.75 -0.08
IASC affect dysregulation total
Linear WL -0.09 (-0.28, 0.11) -1.02 (-3.36, 1.32) -0.15 -0.34 (-1.12, 0.44) -0.05
Con x Time NF -0.39 (-0.58, -0.2) -4.7 (-6.97, -2.42) -0.67 -1.57 (-2.32, -0.81) -0.22 p = .028 Difference -0.31 (-0.58, -0.03) -3.68 (-6.94, -0.41) -0.53 -1.23 (-2.31, -0.14) -0.18
Difference d -0.68 -0.53 -0.18
IASC affect skill deficits
Linear WL Est. (95%CI) Est. (95%CI) Est. (95%CI)
Con x Time NF -0.05 (-0.17, 0.08) -0.55 (-2.05, 0.96) -0.12 -0.18 (-0.68, 0.32) -0.04 p = .045 Difference -0.22 (-0.35, -0.10) -2.69 (-4.15, -1.23) -0.59 -0.9 (-1.38, -0.41) -0.20 Difference d -0.18 (-0.35, -0.003) -2.14 (-4.24, -0.05) -0.47 -0.71 (-1.41, -0.02) -0.16
-0.63 -0.47 -0.16
IASC affect instability
Linear WL -0.04 (-0.13, 0.05) -0.46 (-1.56, 0.64) -0.14 -0.15 (-0.52, 0.21) -0.05
Con x Time NF -0.16 (-0.25, -0.08) -1.97 (-3.04, -0.90) -0.58 -0.66 (-1.01, -0.30) -0.19 p = .053 Difference -0.13 (-0.25, 0.001) -1.51 (-3.04, 0.02) -0.45 -0.5 (-1.01, 0.01) -0.15
Difference d -0.60 -0.45 -0.15
IASC identity impairment total
Linear WL -0.04 (-0.25, 0.16) -0.50 (-2.97, 1.96) -0.06 -0.17 (-0.99, 0.65) -0.02
Con x Time NF -0.28 (-0.48, -0.07) -3.30 (-5.72, -0.88) -0.41 -1.10 (-1.91, -0.29) -0.14 p = .110 Difference -0.23 (-0.52, 0.05) -2.80 (-6.25, 0.66) -0.35 -0.93 (-2.08, 0.22) -0.12
Difference d -0.51 -0.35 -0.12
IASC idealization-disillusionment
Linear WL -0.01 (-0.18, 0.15) -0.14 (-2.12, 1.83) -0.02 -0.05 (-0.71, 0.61) -0.01
Con x Time NF -0.2 (-0.36, -0.04) -2.39 (-4.32, -0.46) -0.35 -0.8 (-1.44, -0.15) -0.12 p = .109 Difference -0.19 (-0.42, 0.04) -2.24 (-5.01, 0.52) -0.33 -0.75 (-1.67, 0.17) -0.11
Difference d -0.50 -0.33 -0.11
IASC abandonment concerns
Natural Log WL -0.05 (-1.19, 1.09) -0.13 (-3.05, 2.79) -0.02 -0.01 (-0.32, 0.29) 0.00 Con x Time NF -1.72 (-2.84, -0.60) -4.42 (-7.28, -1.55) -0.59 -0.46 (-0.76, -0.16) -0.06
Neurofeedback is a promising change agent for habitual dysfunctional neuronal patterns. The vast potential of EEG. based brain-computer interface techniques to train neuronal pat-terns is illustrated by recent research at the University of Minnesota. Using advanced func-tional neuroimaging including BOLD funcfunc-tional fMRI and EEG source imaging, they trained normal research subjects to control the flight of a virtual helicopter in 3-dimensional space
through an obstacle course, based only upon motor imagination [59]. The equipment used in
our study was much less sophisticated than that used in the helicopter navigation study, but it cost less than $10,000. If further research confirms the results from our study, neurofeedback has the potential of becoming widely available in community settings since can be economi-cally administered by well-trained technicians in small offices and clinics.
Limitations
There are major limitations in this relatively small, non-placebo controlled study, including: 1) This study employed a waitlist control group that received TAU (psychotherapy + medica-tions). While this is an appropriate control, findings would be more robust with a sham con-trol condition; 2) This study only had a one-month follow up. Further studies are needed to establish the relative permanency of NF generated clinical improvements and investigate the necessity for follow-up booster sessions. 3) In this study we used clinical indications- PTSD symptoms- to guide our approach. It remains to be determined whether it is optimal to target specific abnormalities in brain EEG patterns, or clinical symptomatology in NF research. 4) This study did not examine to what degree clinical changes are correlated with specific alter-ations in EEG, or other neural activation patterns. 5) The NF protocol targeted R temporal lobe EEG patterns. Future research need to determine the optimal targets and procedures for the treatment of PTSD and other clinical conditions, including whether there are optimal pro-tocols for different clinical conditions, or whether psychiatric patients are best served by indi-vidualized targeted interventions that use advanced EEG imaging technologies such as
sLORETA [60].
Table 4. (Continued)
Measures
Variable Linear/Ln Change ΔPre-PST effect-size (d) ΔPST-FU effect-size (d)
UCC Model Condition (per week) Pre-Pst Pst-FU
Con x Time Est. (95%CI) Est. (95%CI) Est. (95%CI)
p = .041 Difference -1.67 (-3.27, -0.07) -4.29 (-8.38, -0.19) -0.57 -0.45 (-0.88, -0.02) -0.06
Difference d -0.62 -0.57 -0.06
IASC susceptibility to influence
Linear WL -0.07 (-0.25, 0.10) -0.88 (-3.00, 1.23) -0.12 -0.29 (-1.00, 0.41) -0.04
Con x Time NF -0.28 (-0.45, -0.11) -3.35 (-5.41, -1.29) -0.44 -1.12 (-1.80, -0.43) -0.15 p = .099 Difference -0.21 (-0.45, 0.04) -2.47 (-5.42, 0.49) -0.33 -0.82 (-1.81, 0.16) -0.11
Difference d -0.51 -0.33 -0.11
Note: WL = waitlist condition, NF = Neurofeedback condition, Est. = estimate, 95%CI = 95% Confidence Interval, d = effect size indicator with .2, .5, and .8 indicating small, medium, and large effect sizes,ΔPre-Pst(1M) = the estimate of total change from the pre-treatment to the 1-month post-treatment assessment, NA = Not Applicable (there is not quadratic estimate for linear and natural-log change models). The far left column denotes the outcome (underlined), the unconditional model (UCC) that best fit the data (linear, quadratic, or natural log), and the significance of the overall time x condition interaction (con x time). Z–because quadratic change models involve two change parameters (linear, quadratic) the 95% confidence intervals for these models could not be calculated.
Finally, the power analysis indicated that the study was slightly underpowered. There are two primary problems with underpowered studies: 1) increased risk of Type II errors, and 2) insufficient sample to produce unbiased or stable parameter estimates. Regarding #1, the cur-rent study produced hypothesized statistically significant effects ruling out Type II error. Regarding #2, the Monte Carlo procedure used for the power analysis produced estimates of 0.1%, 4.8%, and 92.6% for parameter estimate bias, standard error bias, and coverage, respec-tively, for the condition x time interaction for the CAPS, and 0.04%, 5.05,% and 93.5% for the
DTS power. As per criteria specified by Muthe´n and Muthe´n [46] these values suggest that the
sample size for the current study produced unbiased and stable estimates. The current study produced statistically significant effects despite being underpowered, which mitigates concerns that have been expressed regarding the use of post-hoc power analysis to argue that the results of negative trials may be meaningful despite the failure to detect significant effects due to being
underpowered (e.g., [61]). The current study used post-hoc analysis to investigate the stability
of the produced coefficients, and we followed recommendations of those who caution against the use of post-hoc test to report confidence intervals for coefficients.
Future directions
This study suggests that BCIs may have similar clinical potential for psychiatry as they do for rehabilitation medicine. Further clinical trials are needed to further substantiate to what degree BCIs can improve attention and affect regulation, and enhance cognitive performance and executive functioning. Using a combination of fMRI and quantitative EEG technology to define neural circuitry abnormalities, and studying the capacity of targeted neurofeedback interventions to alter these circuits would be a major step in that direction (e.g.11). Clarifying to what degree NF induced psychological changes are correlated with specific changes in neu-ral activity will be a complex scientific challenge akin to correlating the clinical effects of vari-ous psychiatric medications with specific neurochemical changes in the brain.
Supporting Information
S1 File. CONSORT Checklist Part 1 (PDF)
S2 File. CONSORT Checklist Part 2 (PDF)
S3 File. Study Protocol (PDF)
Acknowledgments
Marla Zucker PhD, Janice Stubblefield-Tave LICSW, Ainat Rogel. Clinical trials.gov registr. NCT01259921
These data have been previously presented at the annual meeting of the International Soci-ety for Traumatic Stress Studies, New Orleans LA, October 20, 2015.
Author Contributions
Conceptualization: BvdK, EH.
Data curation: HH, MG, BvdK.
Funding acquisition: BvdK.
Investigation: MG, RM, MG.
Methodology: BvdK, JS, EH, MS.
Project administration: MG, HH, BvdK.
Resources: BvdK, HH,JS.
Software: N/A.
Supervision: EH, BvdK.
Validation: HH, RM, JS.
Visualization: RM.
Writing – original draft: BvdK, MS, HH.
Writing – review & editing: MG, EH, BvdK.
References
1. Edlinger G, Rizzo C, Guger C: "Brain Computer Interface." Springer Handbook of Medical Technology. Springer, Berlin Heidelberg, 2011. 1003–1017.
2. Shih JJ, Krusienski DJ, Wolpaw JR: Brain-Computer Interfaces in Medicine.Mayo Clinic Proceedings. 2012; 87: 268–279. doi:10.1016/j.mayocp.2011.12.008PMID:22325364
3. http://sharpbrains.com/pervasive-neurotechnology/
4. Hurt E., Arnold L. E., & Lofthouse N. Quantitative EEG neurofeedback for the treatment of pediatric attention-deficit/hyperactivity disorder, autism spectrum disorders, learning disorders, and epilepsy. Child and adolescent psychiatric clinics of North America, 2014; 23, 465–486. doi:10.1016/j.chc.2014. 02.001PMID:24975622
5. Egner T, Gruzelier JH. Learned self-regulation of EEG frequency components affects attention and event related brain potentials in humans. Neuroreport. 2001; 12: 4155–4159. PMID:11742256 6. Egner T, Gruzelier JH. EEG Biofeedback of low beta band components: frequency-specific effects on
variables of attention and event-related brain potentials Clinical Neurophysiology. 2004; 115: 131–139. PMID:14706480
7. Zoefel B, Huster RJ, Herrmann CS. Neurofeedback training of the upper alpha frequency band in EEG improves cognitive performance. Neuroimage. 2011; 54: 1427–1431. doi:10.1016/j.neuroimage.2010. 08.078PMID:20850552
8. Beauregard M and L´Evesque J. Functional Magnetic Resonance Imaging Investigation of the Effects of Neurofeedback Training on the Neural Bases of Selective Attention and Response Inhibition in Chil-dren with Attention-Deficit/Hyperactivity Disorder. Applied Psychophysiology and Biofeedback. 2006; 31:3–20. doi:10.1007/s10484-006-9001-yPMID:16552626
9. Paquette V., Beauregard M., & Beaulieu-Prevost D. Effect of psychoneurotherapy on brain electromag-netic tomography in individuals with major depressive disorder. Psychiatry Research: Neuroimaging. 2009; 174: 231–239. doi:10.1016/j.pscychresns.2009.06.002PMID:19914046
10. Ros T., The´berge J., Frewen P. A., Kluetsch R., Densmore M., Calhoun V. D., et al. Mind over chatter: plastic up-regulation of the fMRI salience network directly after EEG neurofeedback. Neuroimage. 2013; 65: 324–335. doi:10.1016/j.neuroimage.2012.09.046PMID:23022326
11. Nicholson A, Rabellino D, Densmore M; Frewen P, Paret C, Kluetsch R. et al The Neurobiology of Emo-tion RegulaEmo-tion in Posttraumatic Stress Disorder: Amygdala DownregulaEmo-tion via Real-Time fMRI Neuro-feedback. Human Brain Mapping, in Press, 2016
12. Gruzelier J. H. EEG-neurofeedback for optimising performance. I: a review of cognitive and affective outcome in healthy participants. Neuroscience & Biobehavioral Reviews 2014; 44:124–141.
14. Arnold L. E., Lofthouse N., Hersch S., Pan X., Hurt E., Bates B et al. EEG neurofeedback for ADHD: double-blind sham-controlled randomized pilot feasibility trial. J Atten Disord. 2013 Jul; 17(5):410–9. Epub 2012 May 22. doi:10.1177/1087054712446173PMID:22617866
15. Steiner N. J., Frenette E. C., Rene K. M., Brennan R. T., & Perrin E. C. In-school neurofeedback training for ADHD: sustained improvements from a randomized control trial. Pediatrics, 2014; 133, 483–492. doi:10.1542/peds.2013-2059PMID:24534402
16. Wangler S., Gevensleben H., Albrecht B., Studer P., Rothenberger A., Moll G. H et al. Neurofeedback in children with ADHD: specific event-related findings of a randomized controlled trial. Clinical Neuro-physiology. 2011; 122: 942–950. doi:10.1016/j.clinph.2010.06.036PMID:20843737
17. Linden D. E., Habes I., Johnston S. J., Linden S., Tatineni R., Subramanian L et al Real-time self-regu-lation of emotion networks in patients with depression. PLoS One, 2012; 7(6), e38115. doi:10.1371/ journal.pone.0038115PMID:22675513
18. Johnston S., Linden D. E. J., Healy D., Goebel R., Habes I., & Boehm S. G. Upregulation of emotion areas through neurofeedback with a focus on positive mood. Cognitive, Affective, & Behavioral Neuro-science. 2011; 11: 44–51
19. Sokhadze T. M., Cannon R. L., Trudeau D. L. EEG biofeedback as a treatment for substance use disor-ders: review, rating of efficacy and recommendations for further research. Appl. Psychophysiol. Bio-feedback. 2008; 33: 1–28 doi:10.1007/s10484-007-9047-5PMID:18214670
20. Peniston E.G., &Kulkosky P.J. Alpha-theta brainwave neurofeedback therapy for Vietnam veterans with combat-related post-traumatic stress disorder. Medical Psychotherapy. 1991; 4: 47–60.
21. Kluetsch R. C., Ros T., Theberge J., Frewen P. A., Calhoun V. D., Schmahl C., et al. Plastic modulation of PTSD resting-state networks and subjective wellbeing by EEG neurofeedback. Acta Psychiatrica Scandinavica. 2014; 130: 123–136. doi:10.1111/acps.12229PMID:24266644
22. Gapen M., van der Kolk B. A., Hamlin E., Hirshberg L., Suvak M., & Spinazzola J. A Pilot Study of Neu-rofeedback for Chronic PTSD. Applied psychophysiology and biofeedback, 2016; 40, 1–11.
23. Kouijzer M E.J., de Moor J M.H., Gerrits B J.L., Congedo M, van Schie H T. Neurofeedbackimproves executive functioning in children with autism spectrum disorders. Res Autism Spectrum Disorders. 2009; 3: 145–162
24. Ros T., Munneke M. A. M., Parkinson L. A., & Gruzelier J. H. Neurofeedback facilitation of implicit motor learning. Biological psychology. 2014; 95: 54–58. doi:10.1016/j.biopsycho.2013.04.013PMID:
23702458
25. Harmon-Jones E, Harmon-Jones C, Fearn M, Sigelman JD and Johnson P: Left Frontal Cortical Activa-tion and Spreading of Alternatives: Tests of the AcActiva-tion-Based Model of Dissonance. J Personality and Social Psychology. 2008; 94: 1–15
26. Frewen P. A., Dozois D. J., Neufeld R. W., & Lanius R. A. (2012). Disturbances of emotional awareness and expression in posttraumatic stress disorder: Meta-mood, emotion regulation, mindfulness, and interference of emotional expressiveness. Psychological Trauma: Theory, Research, Practice, and Pol-icy, 4(2), 152.
27. Jaycox LHF, Foa EB. Obstacles in implementing exposure therapy for PTSD: Case discussions and practical solutions. Clin Psychol Psychotherapy. 1996; 3: 176–184.
28. Burnstein A. Treatment noncompliance in patients with posttraumatic stress disorder. Psychosomatics. 1986; 27: 37–40. doi:10.1016/S0033-3182(86)72741-2PMID:3952245
29. Lanius R. A., Vermetten E., Loewenstein R. J., Brand B., Schmahl C., Bremner J. D., et al. (2010). Emo-tion modulaEmo-tion in PTSD: Clinical and neurobiological evidence for a dissociative subtype. American Journal of Psychiatry, 167(6), 640_647. doi:10.1176/appi.ajp.2009.09081168PMID:20360318 30. Pitman R., Altman B., Greenwald E., Longre R. E., Macklin M. L., Pore R. E., et al Psychiatric
complica-tions during flooding therapy for posttraumatic stress disorder. J Clin Psychiatry. 1991; 52: 17–20.
31. Cloitre M., Stolbach B., Herman J.L., van der Kolk B., Pynoos R., Wang J. et al.,. A developmental approach to complex PTSD: Childhood and adult cumulative trauma as predictors of symptom com-plexity. J Trauma Stress. 2009; 22: 399–408. doi:10.1002/jts.20444PMID:19795402
32. Keizer AW, Verment RS, Hommel B. Enhancing cognitive control through neurofeedback: A role of gamma-band activity in managing episodic retrieval. NeuroImage. 2010; 49: 3404–3413 doi:10.1016/j. neuroimage.2009.11.023PMID:19925870
33. Kropotov JD, Grin-Yatsenko VA, Ponomarev VA, Chutko LS,Yakovenko EA, Nikishena IS: ERPs corre-lates of EEG relative beta training in ADHD children. Int J Psychophysiology. 2005; 55: 23–34
34. Jokic-Begic N, Begic D. Quantitative electroencephalogram (qEEG) in combat veterans with post-trau-matic stress disorder (PTSD). Nordic J Psychiat, 2003; 57: 351–355.
36. Klimesch W EEG-alpha rhythms and memory processes, Int J Psychophysiol.1997; 26: 319–340. PMID:9203012
37. Klimesch W. EEG alpha and theta oscillations reflect cognitive and memory performance: A review and analysis. Brain Res Brain Res Rev. 1999; 29:169–195. PMID:10209231
38. Tesche CD, Karhu J, Theta oscillations index human hippocampal activation during a working memory task, P Natl Acad Sci USA. 2000; 97: 919–924.
39. Ford J, Fournier D. Psychological trauma and post-traumatic stress disorder among women in commu-nity mental health aftercare following psychiatric intensive care. J Psychiatric Intensive Care. 2007; 3, 27–34.
40. Blake D. D., Weathers F. W., Nagy L. M., Kaloupek D. G., Gusman F. D., Charney D. S. The develop-ment of a clinician-administered PTSD scale. J Trauma Stress. 1995; 8: 75–90. PMID:7712061 41. Rauch S. L., Van der Kolk B., Fisler R., Alpert N. M., Orr S. P., Savage C. R. et al A Symptom
Provoca-tion Study of Posttraumatic Stress Disorder Using Positron Emission Tomography and Script-Driven Imagery. Arch General Psychiat. 1996; 53: 380–387.
42. Georgopoulos AP; Tan H-R M; Lewis SM; Leuthold A C; Winskowski A M; Lynch J K et al. The synchro-nous neural interactions test as a functional neuromarker for posttraumatic stress disorder (PTSD): a robust classification method based on the bootstrap. Journal of Neural Engineering. 2010; 7: 016011,
43. Sanei S., & Chambers J. A. Introduction to EEG. EEG signal processing, 2007;1–34.
44. Davidson J. R. T., Tharwani H. M., & Connor K. M. Davidson Trauma Scale (DTS): Normative scores in the general population and effect sizes in placebo-controlled SSRI trials. Depr Anxiety. 2002; 15: 75–78.
45. Briere J. R., M. The Inventory of Altered Self-Capacities: A standardized measure of identity, affect reg-ulation, and relationship disturbance. Assessment.2002; 9(3), 230–239. PMID:12216780
46. Muthe´n L.K., & Muthe´n B.O. How to use a Monte Carlo study to decide on sample size and determine power. Structural Equation Modeling, 2002; 4, 599–620.
47. Muthe´n L.K. and Muthe´n B.O. Mplus User’s Guide. Fifth Edition. Los Angeles, CA: (1998–2009) Muthe´n & Muthe´n.
48. Peugh J. L. & Enders C. K. Using the SPSS mixed procedure to fit crosssectional and longitudinal multi-level models. Educational & Psychological Measurement, 2005; 65, 714–741.
49. Singer J., & Willett J. Applied longitudinal data analysis: Modeling change and event occurrence. NY. Oxford University Press. 2003.
50. Feingold A. Effect sizes for growth-modeling analysis for controlled clinical trials in the same metric as for classical analysis. Psychological methods, 2009; 14, 43. doi:10.1037/a0014699PMID:19271847 51. Jacobson NS, Truax P. Clinical significance: a statistical approach to defining meaningful change in
psychotherapy research. J Consult Clinical Psychol. 1991; 59: 12–19.
52. Van Etten ML, Taylor S. Comparative efficacy of treatments for post-traumatic stress disorder: a meta-analysis. Clin. Psychol. Psychother. 1998; 5: 126–144
53. Bradley R., Greene J., Russ E., Dutra L., Westen D. A multidimensional meta-analysis of psychother-apy for PTSD. Am J Psychiat. 2005; 162: 214–227. doi:10.1176/appi.ajp.162.2.214PMID:15677582 54. Insel T: The NIMH Experimental Medicine Initiative. World Psychiatry. 2015; 14: 151–153. doi:10.
1002/wps.20227PMID:26043323
55. Van Essen DC, Barch DM: The human connectome in health and psychopathology World Psychiatry. 2015; 14: 154157.
56. Uhlhaas PJ, Singer W:. Neuronal dynamics and neuropsychiatric disorders: toward a translational para-digm for dysfunctionallarge-scale networks. Neuron 2012; 75:963–80. doi:10.1016/j.neuron.2012.09. 004PMID:22998866
57. http://www.humanconnectome.org/
58. Duncan N. W., Hayes D. J., Wiebking C., Tiret B., Pietruska K., Chen D. Q., & Northoff G. (2015). Nega-tive childhood experiences alter a prefrontal-insular-motor cortical network in healthy adults: A prelimi-nary multimodal rsfMRI-fMRI-MRS-dMRI study. Human brain mapping, 36(11), 4622–4637. doi:10. 1002/hbm.22941PMID:26287448
59. Doud AJ; Lucas J P, Pisansky MT, He B. Gribble P L, ed. Continuous Three-Dimensional Control of a Vir-tual Helicopter Using a Motor Imagery Based Brain-Computer Interface. PLoS ONE 2011 6 (10): e26322. Bibcode:2011PLoSO. . .626322D. PMC 3202533. doi:10.1371/journal.pone.0026322PMID:22046274 60. Pascual-Marqui RD, Biscay RJ, Bosch-Bayard J, Lehmann D, Kochi K, Kinoshita T, et al. Assessing
direct paths of intracortical causal information flow of oscillatory activity with the isolated effective coher-ence (iCoh). Front Hum Neurosci. 2014; 20:448. eCollection 2014.