Durham Research Online
Deposited in DRO:
13 June 2018Version of attached le:
Published VersionPeer-review status of attached le:
Peer-reviewedCitation for published item:
Otava, M. and Shkedy, Z. and Kasim, A. (2014) 'Prediction of gene expression in human using rat in vivo gene expression in Japanese Toxicogenomics Project.', Systems biomedicine., 2 (1). pp. 8-15.
Further information on publisher's website:
https://doi.org/10.4161/sysb.29412 Publisher's copyright statement:
c
2014 The Author(s). Published with license by Taylor Francis Group, LLC cMartin Otava, Ziv Shkedy, and Adetayo Kasim This is an Open Access article distributed under the terms of the Creative Commons
Attribution-Non-Commercial License (http://creativecommons.org/licenses/by-nc/3.0/), which permits unrestricted non-commercial use, distribution, and reproduction in any medium, provided the original work is properly cited. The moral rights of the named author(s) have been asserted.
Use policy
The full-text may be used and/or reproduced, and given to third parties in any format or medium, without prior permission or charge, for personal research or study, educational, or not-for-prot purposes provided that:
• a full bibliographic reference is made to the original source • alinkis made to the metadata record in DRO
• the full-text is not changed in any way
The full-text must not be sold in any format or medium without the formal permission of the copyright holders. Please consult thefull DRO policyfor further details.
Durham University Library, Stockton Road, Durham DH1 3LY, United Kingdom Tel : +44 (0)191 334 3042 | Fax : +44 (0)191 334 2971
Full Terms & Conditions of access and use can be found at
http://www.tandfonline.com/action/journalInformation?journalCode=kssb20
Systems Biomedicine
ISSN: 2162-8130 (Print) 2162-8149 (Online) Journal homepage: http://www.tandfonline.com/loi/kssb20
Prediction of gene expression in human
using rat in vivo gene expression in Japanese
Toxicogenomics Project
Martin Otava, Ziv Shkedy & Adetayo Kasim
To cite this article: Martin Otava, Ziv Shkedy & Adetayo Kasim (2014) Prediction of gene expression in human using rat in vivo gene expression in Japanese Toxicogenomics Project, Systems Biomedicine, 2:1, 8-15, DOI: 10.4161/sysb.29412
To link to this article: https://doi.org/10.4161/sysb.29412
© 2014 The Author(s). Published with license by Taylor & Francis Group, LLC© Martin Otava, Ziv Shkedy, and Adetayo Kasim
Published online: 31 Oct 2014.
Submit your article to this journal
Article views: 482
View related articles
Prediction of gene expression in human using rat
in vivo gene expression in Japanese
Toxicogenomics Project
Martin Otava1,*, Ziv Shkedy1, and Adetayo Kasim21
Interuniversity Institute for Biostatistics and Statistical Bioinformatics; CenStat; Universiteit Hasselt; Hasselt, Belgium;2
Wolfson Research Institute for Health and Wellbeing; Durham University, Queen’s Campus; Stockton-on-Tees, UK
Keywords:toxicogenomics, gene expression, drug-induced liver injury, rat-human translatability, multiple contrast test, dose-response relationship
Abbreviations:ANOVA, analysis of variance; DILI, drug-induced liver injury; FARMS, factor analysis for robust microarray summarization; FDR, false discovery rate; FWER, family wise error rate; I/NI, informative/non-informative; MCT, multiple contrast
test; TGP, Japanese Toxicogenomics Project
The Japanese Toxicogenomics Project (TGP) provides large amount of data for the toxicology and safety framework. We focus on gene expression data of rat in vivo and human in vitro. We consider two different analyses for the TGP data. Thefirst analysis is based on two-way analysis of variance model and the goal is to detect genes with significant dose-response relationship in both humans and rats. The second analysis consists of a trend analysis at each time point and the goal is to detect genes in the rat in order to predict gene expression in humans. Thefirst analysis leads us to conclusions about the heterogeneity of the compound set and will suggest how to address this issue to improve future analyses. In the second part, we identify, for particular compounds, groups of genes that are translatable from rats to humans, so they can be used for prediction of human in vitro data based on rat in vivo data.
Introduction
The Japanese Toxicogenomics Project (TGP)1 represents a unique source of information for toxicology and safety studies. The main topic that we address in this paper is related to the pre-diction of drug-induced liver injury (DILI) in humans using rat in vivo data (henceforth referred to as rat data). The analysis can be viewed from the perspective of translational research. Transla-tion between rat and human data is an important topic,2due to high costs and ethical considerations of experiments that arise if development is moved to humans.3 Gaining strong scientific knowledge in animal models would prevent most risks. Transla-tional research gets attention in all medical fields (e.g., refs. 4 and 5) and genes are a valuable tool in revealing connections across species (e.g., refs. 6 and 7).
In our particular case, successful prediction of a compound being toxic during rat experiments would reduce failure of effica-cious compounds during the expensive phase III trials. An aver-age of 10% of marketed drugs is being withdrawn from the market or requiring black-box warnings because of adverse drug
reactions or toxicity. Moreover, failures in clinical phase III trial as well as in FDA submission have increased to approximately 50% in recent years.8In this paper, our aim is to explore the con-nection between humans and rats in terms of translatability of gene expression. Particularly, our goal is to model effect of dose on the gene expression in human in vitro data (henceforth referred to as human data) using the dose effect on the gene expression estimated from rat in vivo data. Therefore, our method would identify genes that enable translation of toxicity in rats into toxicity in humans.
The core part of the rat data set is gene expression level infor-mation across multiple compounds at multiple time points and dose levels. We focus on genes that are orthologous for rats and humans. Most of these genes are already annotated by biological processes or diseases (e.g., refs. 9 and 10). The analysis presented in this paper explores common dose-response pathways between rat and human genome using gene expression. Identifying a sub-set of genes that show similar dose-response gene expression pro-files in rats and humans would support the translation of gene expression from rat in vivo experiments to human experiments.
© Martin Otava, Ziv Shkedy, and Adetayo Kasim
*Correspondence to: Martin Otava; Email: [email protected] http://dx.doi.org/10.4161/sysb.29412
This is an Open Access article distributed under the terms of the Creative Commons Attribution-Non-Commercial License (http://creativecommons.org/licenses/ by-nc/3.0/), which permits unrestricted non-commercial use, distribution, and reproduction in any medium, provided the original work is properly cited. The moral rights of the named author(s) have been asserted.
8 Systems Biomedicine Volume 2 Issue 1
Systems Biomedicine 2:1, 8--15; January/February/March 2014; Published with license by Taylor & Francis Group, LLC RESEARCH PAPER
As in the case of DILI, this would enable the prediction of com-pounds’ toxicity in humans using rats’ in vivo experiments. The discovery of such genes would create knowledge about underly-ing mechanisms and connection between species which would significantly improve how rat toxicology is used as a model for human toxicology in the later stages of drug development.
Results
Analysis of variance
Figure 1shows the number of genes with significant interac-tion effect in both rats and humans and reveals a heterogeneous pattern across compounds. For example, for the compound sulin-dacthere are 201 genes with significant interaction effect in both
rats and humans while for the compoundperhexilinethere is only 1 gene in common. In total, only 54 compounds had at least one significant gene and only 10 compounds had more than 25 sig-nificant genes on the list. An example of one sigsig-nificant gene is shown inFigure 2. There exists a small set of genes that are sig-nificant in both rat and human data consistently across subsets of compounds, even in case of strict multiplicity corrections. For the results presented in this paper we applied Bonferroni correc-tion at significance level of 10%. The subset of compounds, iden-tified through common significant genes, consists of DILI related compound only (if we convert the DILI status into binary vari-able, by pooling together “most concern” and “less concern” cate-gories). Hence, the significance of the identified genes in rat in vivo could emphasize possible danger of DILI in humans. These genes are typically connected with the liver processes. Table 1 shows one of these genes, noted ASF1A (originally Asf1a in rat and ASF1A in human), that is significant for multiple com-pounds with DILI concern and not for any compound without DILI concern. Other genes from the identified set, FABP1, MCM4, SMC2, TXNRD1, show very similar behavior.
Trend analysis
As mentioned in the previous section, the second analysis con-sists of trend analysis per time point. An example of gene com-plying with monotonicity assumption is shown inFigure 3. Our aim in this section is to predict the dose effect in humans using the dose effect in rat in vivo. All tests are based on MCT andP values are adjusted using Bonferroni correction using significance level of 10%.
At the first stage of the analysis, we identify, in the rat, the time point with the strongest signal. Figure 4 presents the
Figure 1. Number of genes with significant interaction in two-way ANOVA model, for both rat and human. ThePvalues are adjusted using Bonferroni’s method on significance level of 10%.
Figure 2.Example of gene with significant interaction in two-way ANOVA model, for both rat and human. Compoundomeprazoleand gene Acsl1 in rat, respectively ACSL1 in human.
number of genes with significant dose-response relationship per time point. It clearly shows that there are much more significant genes in the last time point, both for rats and humans, than in any other time point. Hence, for the remainder of this section, the dose effects in rats at the last time point are used for predic-tion.Figure 5reveals that the number of significant genes in rats does not correspond with the number of significant genes in humans. For several compounds, there are no genes significant both in rats and humans. Hence, we focus on two gene sets: 1) genes significant in rats and, 2) genes significant both in rats and humans.
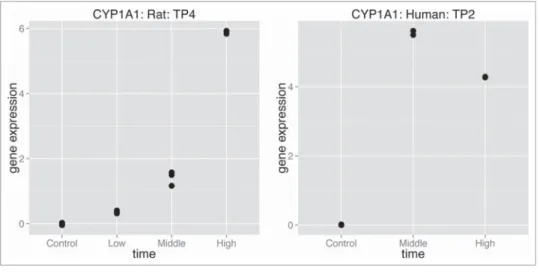
The dose effect in both rats and humans were estimated using isotonic regression. Only 91 compounds having high dose are considered for the analysis and we used the change in isotonic means of the rat (from the last to the first, i.e., control, dose level) in order to predict the change in isotonic means of the human. The example of resulting gene for the compound omeprazoleis presented in Figure 6. We can see one of the genes where the translatability of rat data into human data is apparent. The mean at high dose for the rat represents differential expression of almost 6-fold change increase, while isotonic mean for humans shows
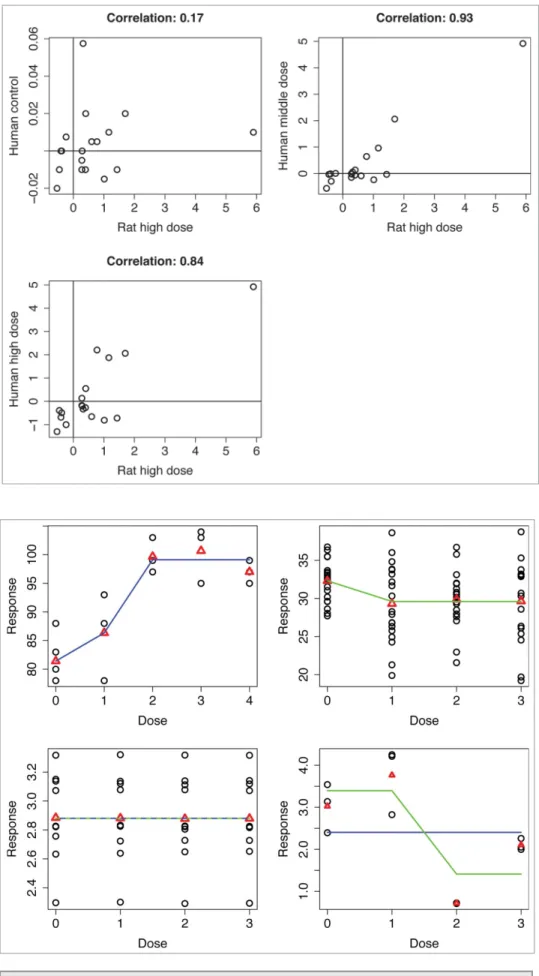
almost 5 log-fold change increase. Prediction of all dose effects on humans using high dose effect on rats, when only genes signif-icant in rats are used, are explored inFigure 7. As expected, pre-diction of control dose shows very low correlation, since all values for human control dose should be around zero. However, for higher doses we can see that there are genes with (nearly) the same value of isotonic means both for rat and human. Still, there is large amount of genes centered around zero. However, in Figure 8, where only genes that are significant in both rat and human in the last time point, the subset of genes around zero almost disappears. The resulting gene set reveals genes that are both consistently significant across species and translatable between species with respect to fold change induced by high dose of a given compound (omeprazolein this case).
Discussion
According to the ANOVA results, the number of significant genes varied among the compounds. This finding is not surpris-ing since the data set contains very distinct compounds, both with respect to their structural properties and biological effects. The data set contains vitamin A next to ibuprofen or nicotinic acid. The analyses presented in this paper suggest that searching for overall differentially expressed genes can fail due to heteroge-neity in the data set. Limiting ourselves to smaller subgroups of similar compounds can lead to more efficient analysis and mean-ingful results. One of such subsets was identified by our analysis, by grouping together 23 compounds with significant gene ASF1A. The presence of subgroups of compounds questions the
Table 1.Relationship between DILI concern status and simultaneous signifi -cance of interaction for both rat and human data for gene ASF1A
DILI status
ASF1A No concern Some concern
Significant interaction no 8 62
yes 0 23
Figure 3.Example of gene with monotone dose-response profile for all time points in rat. Compoundomeprazoleand gene Mafg in rat (MAFG in human).
meaningfulness of the goal of identifying genes useful for classifi-cation of compounds as DILI. If within given set of compounds would exist latent subgroups of compounds (similar with respect to their overall behavior), then particular genes could be good predictors of DILI in one subgroup, but not necessarily in other subgroups. In other words, genes that can be predictors for DILI within one subgroup will lose its predictive ability by considering whole data sets with several subgroups of compounds. Besides the fact that the DILI response is highly unbalanced, only 8
compounds out of 93 show “no DILI concern.” Therefore, we pro-pose to use a more specific response variable instead and simultaneously focus on possible identification of subgroups among compounds. These insights lead us to focus on translatability and means prediction in the second part of the analysis.
The second part of the analysis was mainly focused on the translat-ability of genes between humans and rats. The genes of interest are such that the fold change of their gene expression (precisely its log ratio against control) has similar values in rat and human data and moreover, the dose-response relationship is sta-tistically significant in both species. We have shown that for some com-pounds, no relevant results were found. This is mostly due to very low overall difference in expres-sions and high variability. However, for several compounds, we were able to identify gene sets behaving in the desired way. The impact of the finding is clear: the value of gene expression observed in rats can be used as biomarkers for the corresponding gene expression value in humans. If we are able to connect these genes with particular toxicological process, the signature made by these genes can serve us as early warning mechanism. The reli-ability of such genes as biomarkers will need to be validated, but
Figure 4.Number of genes with significant dose-response relationship per time point. Green compounds have maximum in last time point, red compounds in any other time point. Rat data results are displayed in left panel, human data in right panel.
Figure 5.Number of genes with significant dose-response relationship in last time point. Compounds are ordered according to the number of significant genes in rat and ordering is kept across all three panels. Rightmost panel then shows intersection of twofigures on the left.
the fact that they are significant in both species may highlight a com-mon underlying biological mecha-nism in both species after exposure to the compounds. This study may pro-vide a leeway into more extensive studies on rats and humans toxicoge-nomics connectivity in early drug developments.
Materials and Methods
Data sets
The data considered for the analy-sis presented in this paper conanaly-sists of 93 compounds that are common in rat in vivo and human experiments and have DILI information available. In total, 4440 Affymetrix microarrays that measured gene expression pro-files are available for rats (91 com-pounds with 48 arrays and 2 compound with 36 arrays) and 1116 arrays are available for humans (12 arrays per compound). We consider only genes that are orthologous for rats and humans. Further, we filter the genes using the I/NI calls crite-rion.11 The preprocessed and filtered data set consists of 4359 genes. Response is computed as log ratio of the gene expression level against mean of expression levels under control dose (vehicle). The gene expression values are based on FARMS12 sum-marized data.
For rat in vivo data, there are for each compound 48 arrays, 3 biological replicates measured at 4 dose levels (including control), each at 4 different time points (except 2 compounds with 36 arrays missing highest dose). In this study, human data set comprises 12 arrays per compound, 2 replicates measured at 3 doses and 2 time points. For the analysis presented in this paper we use the ordinal dose levels, i.e., low, middle or high as provided in original data sets.
Exploratory analysis: Analysis of variance approach
For the exploratory analysis, a gene specific linear model with dose and time as covariates is used. Interaction between
covariates is also included. Let Yijk denotes the gene expression
level for the ith compound (i D 1,. . .,93), jth gene (j D 1,. . .,4359) andkthobservation (k D1,. . .,48 or 36) based on
Figure 6.Example of gene translatable between rat and human for compoundomeprazole: gene Cyp1a1 in rat, respectively CYP1A1 in human.
Figure 7.Dose effect for the compoundomeprazole: estimated isotonic mean in particular dose in human against estimated isotonic mean in high dose in rat, both for last time point. Genes with signifi -cant dose-response relationship for rat in last time point (significance in human is not considered).
time-dose combinations. To test possible dose effect, time effect and as well as their interaction, a two-way analysis of variance (ANOVA) model is used:
YijkDa0ijCbDijDoseijkCbTijTijk
CgijDoseijkTimeijkCeijk:
Parameters a0, bD, bT, g are
gene (within compound) specific and the measurement error eijk is
considered to follow a Gaussian dis-tribution eijk»N.0;s2ij/. The
parameter vectorsbDij,bTij,gij
rep-resent the dose, time and interaction effects. In practice they comprise parameters representing particular level of explanatory variables [e.g., bDij D (bDijCONTROL, bDijDOSE 1,
bDijDOSE 2, bDijDOSE 3)]. Note that
the two-way ANOVA model speci-fied above is fitted as a gene specific model within each com-pound. Testing if the parameters differ from null gives us an indica-tion if the gene is differentially expressed for given compound, or not. However, gene specific omni-bus test based on F-distribution can also be used to test if there is any significant effect at all.
Whatever test is used, multiplicity adjustment have to be applied due to extensive number of tests performed (4359 per compound). Correction for multiplicity was applied within each compound. In general, either Family Wise Error Rate (FWER)13 or False Discovery Rate (FDR)14can be used. Controlling FWER trans-lates into level of certainty that there is no false positive finding among all our findings, but controlling FDR
Figure 9.Examples of isotonic regression. Red triangles represent sample means and blue and green lines resulting isotonic means, under either upward or downward monotone assumption.
Figure 8. Dose effect for the com-pound omeprazole: estimated isotonic mean in particular dose in human against estimated isotonic mean in high dose in rat, both for last time point. Genes with significant dose-response relationship for both rat and human in last time point.
assumes there is at least one false positive finding while control-ling for portion of false positive among all findings. Hence, FWER is a more conservative method than FDR. In our analysis, we apply Bonferroni method to control FWER to prevent false positives entering later stages of the analysis.
The whole procedure is conducted for both rat in vivo and human data. Only those genes that are found to be sig-nificant (according to test we choose) for both humans and rats are kept for further analysis. The resulting lists of signif-icant genes are compared across compounds to identify genes that are significantly expressed in multiple compounds. Indicators of significance of a particular gene can be com-pared with DILI status of compounds to find out if the gen-es’ appearance is connected with potential danger for the liver. In general, any information about compounds can be used in this stage and can be compared with indicator of genes significance. For example, pathological data available in the study can be used, information about compound chemical structure or grouping of compounds based on their phenotypic effect.
Main data analysis: Trend analysis approach
A trend analysis is a common analysis in toxicology. The aim of such analysis is to identify a subset of genes for which a monotone relationship with an increasing dose of a compound can be detected.15 Such an assumption of monotonicity allows us to gain power and it is scientifically reasonable. For toxico-logical studies, this assumption is typically used, since toxic effect usually gets stronger with increasing dose. Monotone means are computed for each gene using isotonic regression method.16-18 Isotonic regression pools together the means that violate assumption of monotonicity and makes these means equal.Figure 9shows examples of the isotonic meansmD(m0,
m1, m2, m3) for an experiment with control dose and three active dose levels.
Hence, within the second modeling approach the null hypothesis of no dose effect is tested against an ordered alterna-tive in the following way:
H0:m0Dm1Dm2Dm3 H1:m0m1m2m3 or
H0:m0Dm1Dm2Dm3 H1:m0m1m2m3
with at least one inequality strict. We start with simple ANOVA model:
YijklDm0ijlC@ijlDoseijklCeijkl;
where i stays for compound, j for gene, l for specific time point andkfor observation within each time point (within gene, within compound). The vector of parameters @ijl D (@1ijl,@2ijl, @3ijl) represents the change of the mean in particular dose
(com-pared with control dose) and parameters are either non-negative or non-positive (according to direction of monotonicity assump-tion). The measurement error follows a Gaussian distribution,
eijkl»N.0;s2ijl/. An advantage of the model is absence of any
parametrical assumption on dose response relationship shape. Dose-specific means are modeled separately, connected through deltas’ values.
The analysis is done per compound and per time point (and separately for human and rat). A multiple contrast test with Marcus’ monotone contrast (MCT)19is used to identify signifi-cant genes. The MCT is designed to cover all the possible param-eter space of each model while using as few tests as possible (and so keeping power as high as possible). It comprises of several sin-gle contrast tests, while different combination of contrasts can also be used. We follow implementation arising from Marcus’ test statistic20proposed for MCT by Bretz.21Multiplicity adjust-ment is conducted within each compound and time point combi-nation using FWER approach (with Bonferroni correction) within a gene and FDR adjustment across the genes.22
Finally, for each compound and time point combination, we create lists of genes that show significant dose-response relation-ship. The time points with highest rate of significant genes (if such exist) are identified and we focus on them. Then, such genes are listed that show significant dose-response relationship for such time points simultaneously in both rats and humans. For a particular gene on the resulting list, isotonic means at all doses are estimated and their values are compared between humans and rats. Hence, we can identify such genes in rats that can be used in order to predict the gene expression level in humans.
Disclosure of Potential Conflicts of Interest No potential conflicts of interest were disclosed.
Acknowledgments
Martin Otava and Ziv Shkedy gratefully acknowledge the sup-port from the IAP Research Network P7/06 of the Belgian State (Belgian Science Policy).
Funding
Martin Otava gratefully acknowledge the financial support of the Research Project BOF11DOC09 of Hasselt University. References
1. Uehara T, Ono A, Maruyama T, Kato I, Yamada H, Ohno Y, Urushidani T. The Japanese toxicogenomics project: application of toxicogenomics. Mol Nutr Food Res 2010; 54:218-27; PMID:20041446; http://dx.doi. org/10.1002/mnfr.200900169
2. McGonigle P, Ruggeri B. Animal models of human disease: challenges in enabling translation. Biochem Pharmacol 2014; 87:162-71; PMID:23954708; http:// dx.doi.org/10.1016/j.bcp.2013.08.006
3. Hobin JA, Deschamps AM, Bockman R, Cohen S, Dechow P, Eng C, Galey W, Morris M, Prabhakar S, Raj U, et al. Engaging basic scientists in translational
research: identifying opportunities, overcoming obstacles. J Transl Med 2012; 10:72; PMID:22500917; http://dx.doi.org/10.1186/1479-5876-10-72
4. Andrews NA. Skeletal regulation of glucose metabo-lism: challenges in translation from mouse to man.
IBMS BoneKEy 2013;10:353; http://dx.doi.org/ 10.1038/bonekey.2013.87
5. Mestas J, Hughes CCW. Of mice and not men: differ-ences between mouse and human immunology. J Immunol 2004; 172:2731-8; PMID:14978070; http:// dx.doi.org/10.4049/jimmunol.172.5.2731
6. Seok J, Warren HS, Cuenca AG, Mindrinos MN, Baker HV, Xu W, Richards DR, McDonald-Smith GP, Gao H, Hennessy L, et al.; Inflammation and Host Response to Injury, Large Scale Collaborative Research Program. Genomic responses in mouse mod-els poorly mimic human inflammatory diseases. Proc Natl Acad Sci USA 2013; 110:3507-12; PMID:23401516; http://dx.doi.org/10.1073/pnas. 1222878110
7. Rye MS, Bhutta MF, Cheeseman MT, Burgner D, Blackwell JM, Brown SDM, Jamieson SE. Unraveling the genetics of otitis media: from mouse to human and back again. Mamm Genome 2011; 22:66-82; PMID:21107580; http://dx.doi.org/10.1007/s00335-010-9295-1
8. Arrowsmith J. Trial watch: phase III and submission fail-ures: 2007-2010. Nat Rev Drug Discov 2011; 10:87; PMID:21283095; http://dx.doi.org/10.1038/nrd3375 9. Ashburner M, Ball CA, Blake JA, Botstein D, Butler H,
Cherry JM, Davis AP, Dolinski K, Dwight SS, Eppig JT, et al.; The Gene Ontology Consortium. Gene ontology: tool for the unification of biology. Nat Genet 2000; 25:25-9; PMID:10802651; http://dx.doi.org/ 10.1038/75556
10. Lamb J, Crawford ED, Peck D, Modell JW, Blat IC, Wrobel MJ, Lerner J, Brunet JP, Subramanian A, Ross KN, et al. The Connectivity Map: using gene-expres-sion signatures to connect small molecules, genes, and disease. Science 2006; 313:1929-35; PMID:17008526; http://dx.doi.org/10.1126/science.1132939 11. Talloen W, Clevert DA, Hochreiter S, Amaratunga D,
Bijnens L, Kass S, G€ohlmann HWH. I/NI-calls for the exclusion of non-informative genes: a highly effective filtering tool for microarray data. Bioinformatics 2007; 23:2897-902; PMID:17921172; http://dx.doi.org/ 10.1093/bioinformatics/btm478
12. Hochreiter S, Clevert DA, Obermayer K. A new sum-marization method for Affymetrix probe level data. Bioinformatics 2006; 22:943-9; PMID:16473874; http://dx.doi.org/10.1093/bioinformatics/btl033 13. Hochberg Y, Tamhane AC. Multiple comparison
pro-cedures. New York: Wiley; 1987. p. 480
14. Benjamini Y, Hochberg Y. Controlling the false discov-ery rate: a practical and powerful approach to multiple testing. J R Stat Soc B Met 1995; 57:289-300 15. Lin D, Shkedy Z, Yekutieli D, Amaratunga D, Bijnens
L, eds. Modeling dose-response microarray data in early drug development experiments using R: order-restricted analysis of microarray data. Berlin: Springer; 2012. p. 282
16. Barlow RE, Bartholomew DJ, Bremner MJ, Brunk HD. Statistical inference under order restriction. New York: Wiley; 1972. p. 388
17. Robertson T, Wright FT, Dykstra RL. Order Restricted Statistical Inference. New York: Wiley; 1988. p. 544
18. Shkedy Z, Amaratunga D, Aerts M. Estimations under order restrictions. In: Lin D, Shkedy Z, Yekutieli D, Amaratunga D, Bijnens L, editors. Modeling dose-response microarray data in early drug development experiments using R: order-restricted analysis of micro-array data. Berlin: Springer; 2012. p. 11-27 19. Mukerjee H, Robertson T, Wright FT. Comparison of
Several Treatments with a Control Using Multiple Contrasts. J Am Stat Assoc 1987; 82:902-10; http://dx. doi.org/10.1080/01621459.1987.10478515 20. Marcus R. The powers of some tests of the quality of
normal means against an ordered alternative. Biome-trika 1976; 63:177-83
21. Bretz F. An extension of the Williams trend test to gen-eral unbalanced linear models. Comput Stat Data Anal 2006; 50:1735-48; http://dx.doi.org/10.1016/j. csda.2005.02.005
22. Lin D, Hothorn LA, Djira GD, Bretz F. Multiple con-trast tests for testing dose-response relationships under order-restricted alternatives. In: Lin D, Shkedy Z, Yekutieli D, Amaratunga D, Bijnens L, editors. Model-ing dose-response microarray data in early drug devel-opment experiments using R: order-restricted analysis of microarray data. Berlin: Springer; 2012. p. 233-247