Kennesaw State University
DigitalCommons@Kennesaw State University
Grey Literature from PhD Candidates
Ph.D. in Analytics and Data Science Research
Collections
Spring 2-2019
A Product Affinity Segmentation Framework
Lili Zhang
[email protected]Jennifer Priestley
[email protected]Joseph DeMaio
[email protected]Sherry Ni
[email protected]Follow this and additional works at:
https://digitalcommons.kennesaw.edu/dataphdgreylit
Part of the
Business Analytics Commons
, and the
Marketing Commons
This Article is brought to you for free and open access by the Ph.D. in Analytics and Data Science Research Collections at
Recommended Citation
Zhang, Lili; Priestley, Jennifer; DeMaio, Joseph; and Ni, Sherry, "A Product Affinity Segmentation Framework" (2019).Grey Literature from PhD Candidates. 13.
A Product Affinity Segmentation Framework
Lili Zhanga,∗, Jennifer Priestleya, Joseph DeMaiob, Sherry Nic
aAnalytics and Data Science Institute, Kennesaw State University, USA bDepartment of Mathematics, Kennesaw State University, USA
cDepartment of Statistics and Analytical Sciences, Kennesaw State University, USA
Abstract
Product affinity segmentation discovers the linking between customers and prod-ucts for cross-selling and promotion opportunities to increase sales and profits. However, there are some challenges with conventional approaches. The most straightforward approach is to use the product-level data for customer segmen-tation, but it results in less meaningful solutions. Moreover, customer segmenta-tion becomes challenging on massive datasets due to computasegmenta-tional complexity of traditional clustering methods. As an alternative, market basket analysis may suffer from association rules too general to be relevant for important seg-ments. In this paper, we propose to partition customers and discover associated products simultaneously by detecting communities in the customer-product bi-partite graph using the Louvain algorithm that has good interpretability in this context. Through the post-clustering analysis, we show that this frame-work generates statistically distinct clusters and identifies associated products relevant for each cluster. Our analysis provides greater insights into customer purchase behaviors, potentially helping personalization strategic planning (e.g. customized product recommendation) and profitability increase. And our case study of a large U.S. retailer provides useful management insights. Moreover, the graph application, based on almost 800,000 sales transactions, finished in 7.5 seconds on a standard PC, demonstrating its computational efficiency and
∗Corresponding author
Email addresses: [email protected](Lili Zhang),
[email protected](Jennifer Priestley),[email protected](Joseph DeMaio), [email protected](Sherry Ni)
better facilitating the requirements of big data.
Keywords: product affinity, customer segmentation, market basket analysis, community detection, customer-product bipartite graph
1. Introduction
Product affinity segmentation is the task of partitioning customers into dif-ferent groups based on their natural liking of products [1]. By discovering cus-tomers’ product purchase preferences, it helps orgnizations make better market-ing strategies to increase sales and profits [2], for example, by sendmarket-ing coupons of specific products to target customers. Psychologically speaking, customers tend to spend more money with businesses that care about and satisfy their needs and interests.
To conduct product affinity segmentation, the most straightforward ap-proach is to use the product-level data (e.g. product purchase frequency) of each customer in the clustering process of customer segmentation. The most widely used clustering techniques include partitional clustering (K-means, K-medoid, etc.) and hierarchical clustering. There are two challenges with this approach. First, the algorithm computational complexity,O(n2) for partitional clustering andO(n3) for hierarchical clustering [3] [4], makes them too time-expensive to be efficiently executed on millions of customers’ profiles across an enterprise database. Second, the product-level data is high-dimensional, severely skewed, and contains lots of 0s, caused by the facts that many retailers have thousands of products and most individual customers only buy a few product items. This usually produces less meaningful solutions (e.g. one large segment, many small segments) [1].
An alternative approach, which avoids the issues brought by the product-level data, is to use other relevant market characteristics (e.g. demographics, lifetime value) and then profile the product-level data on the resulted clusters to gain additional insights [1]. Besides the suffering of computational complexity of traditional clustering methods mentioned above, these clustering models cannot
generate directly specific product-related results, although customers’ purchase behaviors with respect to RFM (i.e. recency, frequency, monetary) may be discovered at some point depending on attributes fitted into the model.
The third approach is market basket analysis, which finds itemsets that are frequently purchased together from all transactions, providing insights into what items can be promoted together [5] [6]. However, in a market basket analysis, interests of small customer groups may be ignored, resulting in lost opportunities [7], because support, confidence, and lift are calculated based on how frequent items are purchased together overall purely from transaction data. For example, the association strength of Product A and Product B is not strong overall, but can be very strong for a small but strategically relavant customer group.
To efficiently discover customer purchase patterns for product affinity seg-mentation, we propose using a product-oriented customer segmentation frame-work to tackle above limitations simultaneously. In this frameframe-work, the customer-product bipartite graph is constructed firstly, and then the Louvain algorithm is applied to detect communities in this graph. The Louvain algorithm, as a graph clustering method, uses the modularity as the similarity measurement and forms clusters with the modularity maximized [8], such that members in the same clus-ter are as similar as possible while members in different clusclus-ters are as dissimilar as possible. Its implementation is available in C++, Matlab, Python, and R, as well as commercial analytical platforms (e.g. SAS, TigerGraph, Neo4j). Com-pared with other community detection algorithms, the Louvain algorithm is very efficient by returning results in minutes or less for large graphs even comprising millions of customers and products [8]. It has been successfully applied in large graph contexts such as Twitter with 21 million vertices and 38 million edges [9], mobile phone network with 4 million vertices and 100 million edges [10], and citation network with 6 million vertices [11]. To our best knowledge, the present work is the first time to apply this algorithm to the context study of customer segmentation.
Moreover, the clusters generated by the framework we proposed contain both customers and products, and meanwhile differ from each other because of their
distinct characteristics in many dimensions of both customers and products (demographic, lifetime value, product style, product retail price, etc.). These clusters can provide a reference for making customer-related decisions and plan-ning better strategies on the customized-product recommendation to improve profitability. For example, top associated products purchased by customers in a cluster can be recommended to other customers in the same cluster, which have higher probabilities to acommodate customers’ interests in this cluster than top associated products generated from overall transaction data.
This paper is structured as follows. In the Section Related Work, relevant literature are reviewed. In the Section Data, the data used in the analysis is introduced. In the Section Modeling Framework, the proposed product affinity segmentation framework is described in detail. In the Section Conclusions, the findings are summarized and discussed.
2. Related Work
Customer segmentation and market basket analysis are two major building blocks in the product affinity segmentation, which have been long studied by researchers. For customer segmentation, the clustering methods measure the similarity/dissimilarity between each pair of customer observations by a func-tion (e.g. Euclidean distance, Manhattan distance, Gower distance, Cosine) based on their attribute values [12]. Consider the K-means clustering proce-dure which uses Euclidean distance defined in Eq. 1, wheremis the number of attributes. The algorithm generates clusters by minimizing the within-cluster sum of squared errors defined in Eq. 2, whereK is the number of clusters and ciare and the centroid of the clusteri[3]. Its time complexity isO(n2) [4], since
it computes the distance between each pair of customer observations. To over-come the limitation of its application on large datasets caused by computational complexity, two strategies have been adopted. One strategy is the TwoStep clus-tering algorithm with a pre-clusclus-tering step to generate a large number of small primary clusters [13] [14]. The other strategy attempts to reduce the number of
attributes used in the clustering, for example, only considering RFM attributes [15] [16]. Some researchers use RFM model outputs in their next steps to im-prove performance. Jonker et al. used a Markov decision process to determine optimal marketing policy [17]. Cheng et al. adopted the rough set theory to further mine classification rules [18]. Besides RFM, customer value attributes were also often used. Hwang et al. proposed a LTV (i.e. lifetime value) model to include three types of customer values (i.e. current value, potential value, and customer loyalty) [19]. Namvar et al. pointed out that most customer seg-mentation models considered the customer data only from a specific dimension like RFM and LTV, and then proposed a two-phase clustering method based on RFM, demographic, and LTV [20]. dist(p, q) =p(p1−q1)2+...+ (pm−qm)2 (1) SSE= K X i=1 X x∈Ci dist(ci, x)2 (2)
For market basket analysis, one commonly used algorithm is the Apriori al-gorithm [21]. Brin et al. further proposed the Dynamic Itemset Counting (i.e. DIC) algorithm which improved the performance in finding large itemsets com-pared with the Apriori algorithm [22]. Brijs et al. integrated the association rules with important microeconomic parameters and demonstrated its effective-ness on product-specific profitability [23]. Most of these algorithms generate association rules fundamentally based on concepts of support, confidence, and lift [24]. The support for the ruleX →Y is defined in Eq. 4, whereX andY are two different itemsets, σ(XSY) is the number of transactions containing both X and Y defined in Eq. 3, and N is the total number of transactions [3]. The confidence and lift for the ruleX →Y are expressed as Eq. 5 and 6 respectively [3].
Support, s(X →Y) =σ(X S Y) N (4) Conf idence, c(X→Y) = σ(X SY) σ(X) (5) Lif t= c(X →Y) s(Y) (6)
No matter what attributes and algorithms are used for customer segmenta-tion and market basket analysis, each procedure requires efforts of tuning and diagnoses for dedicated results. In the product affinity segmentation framework we propose, the Louvain algorithm is utilized to solve these two problems si-multaneously by performing the community detection on a customer-product bipartite graph.
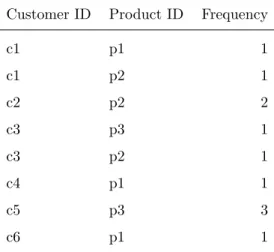
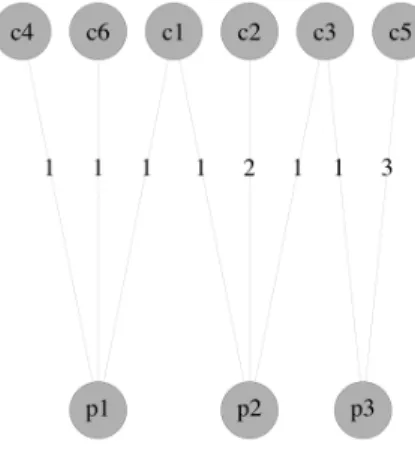
A bipartite graph has two disjoint sets of vertices, denoted as U and V, with edges only existing betweenU and V and no edge existing within either U or V [25]. In the customer-product bipartite graph, customers form one set of vertices, products form the other set of vertices, and edges go between cus-tomers and products. There exists an edge between a customer and a product if the customer purchases the product. The edge weight is the customer’s pur-chase frequency on the product. For example, in Table 1, the customerc1 has purchased the product p1 one time. Given the data in Table 1, the resulted customer-product bipartite graph is generated in Fig.1.
The Louvain algorithm, segmenting customers through parititioning the customer-product bipartite graph, has shown its success on the analysis of huge graphs in both computational time and solution quality [26]. It was initially developed for undirected and unweighted graphs, but extended to directed and weighted graphs. It maximizes the modularity for each community, where the modularityQmeasures the density of links within communities as compared to links between communities [8], as defined in Eq. 7, whereAij is the weight of
the edge between the vertexiand the vertexj,kiis the sum of weights of edges
Table 1: An Example of Bipartite Graph Data
Customer ID Product ID Frequency
c1 p1 1 c1 p2 1 c2 p2 2 c3 p3 1 c3 p2 1 c4 p1 1 c5 p3 3 c6 p1 1
δ(ci, cj) is 1 ifci=cj and 0 otherwise, andmis the sum of edge weights in the
graph. It was correctly adapted to bipartite graphs with modularityQdefined in Eq. 8 [27]. Q= 1 2m X i,j [Aij− kikj 2m]δ(ci, cj) (7) Q=X i,j [Aij− kikj 2m] (8)
The Louvain algorithm is accomplished in two phases.
1. Phase I: First, treat each vertex as a community which only contains itself. Second, for each vertex, remove it from its current community and place it in its neighbor communities sequentially; after moving it to a neighbor community C, compute the modularity gain 4Q, as defined in Eq. 9,
where P
in is the sum of edge weights inside the community C,
P
tot is
the sum of edge weights incident to vertices in the communityC,kiis the
sum of edge weights incident to the vertexi, andki,in is the sum of edge
weights from the vertex i to vertices in the communityC. If the gain is positive, the vertex is moved to the neighbor communityC; otherwise, it
Figure 1: An Example of Customer-Product Bipartite Graph
stays in its current community. Repeat the second step until no positive gain is produced.
2. Phase II: First, treat the communities generated by Phase I as vertices and the sum of weights between communities as edge weights. Second, use those new vertices and edge weights to construct a new graph. Third, reapply Phase I on this new graph.
4Q= [ P in+ki,in 2m −( P tot+ki 2m ) 2]−[ P in 2m −( P tot 2m ) 2−(ki 2m) 2] (9)
Both the K-means and the Louvain algorithm generate groups to achieve the same goal making members in the same group as similar as possible and members in different groups as dissimilar as possible, although they use dif-ferent similarity or dissimilarity measurements. The K-means minimizes the within-cluster sum of squared errors as the dissimilarity measurement, while the Louvain algorithm maximizes the modularity as the similarity measurement.
3. Data
The data used in this study is from a large U.S. retailer, including their de-identified sales transactions, customers, and products. This study focuses
on the most recent information at the time point of the analysis, which is from January 1st, 2018 to August 5th, 2018, including:
• 773,999 sales transactions with 21 attributes (e.g. customer ID, product ID, store name, order date, quantity, and unit price);
• 260,386 customers with 60 attributes (e.g. customer ID, age, income, address, recency, monetary, frequency, and lifetime values);
• 2,112 products with 64 attributes (e.g. product ID, retail price, size bucket, class, style, color, and active flag).
Based on the distributions of the overall marked as blue in Appendix, we have the following insights:
• Retail Price: Most products are in the range of $68-$80. • Size Bucket: Most products are in the bucket 4, 5, and 6.
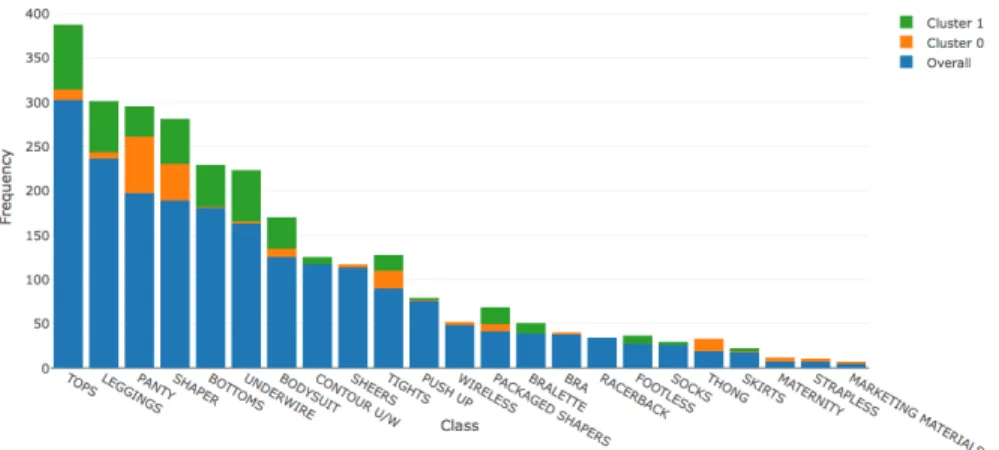
• Class: The most popular classes of products are tops, leggings, panty, sharperwear, bottoms, and underwear.
• Style: The most popular styles of products are full coverage, brief, and mid-thigh short.
• Color: The most popular colors of products are very black, black, soft nude, and naked 2.
• AgeGroup: Except for unknown ones, most customers are in the age groups of 50-59, 40-49, 30-39, and 60-69.
• NetWorth: Most customers have the networth $1000000+ or $0. • Recency: Most customers are in the recency groups of 0-3 and 4-6. • Monetary: Most customers are in the monetary groups of $43-88 and
$89-140.
Figure 2: HeatMap of Customers Overall
• State: Most customers locate in areas of California, Texas, New York, New Jersey and Florida, according to Fig. 2.
4. Modeling Framework
There are four phases in the proposed product affinity segmentation frame-work, namely, 1) Graph Data Preparation, 2) Graph Construction, 3) Commu-nity Detection and 4) Post-Clustering Analysis. Each phase will be described in detail.
4.1. Graph Data Preparation
To construct the customer-product bipartite graph, the unique pairs of customer-product and their corresponding frequency are extracted and calcu-lated from the sales transaction data. An example of the graph data can be found in Table 1.
4.2. Graph Construction
In the customer-product bipartite graph, the vertices represent either cus-tomer ID or product ID. The edges connect cuscus-tomers and the products they purchased. The frequency of the products purchased by customers is stored as edge weights. In the resulted complete graph, there are 260,386 customer ver-tices, 2,112 product vertices and 500,729 edges. An example of the customer-product bipartite graph can be found in Fig. 1, given the data in Table 1.
4.3. Community Detection
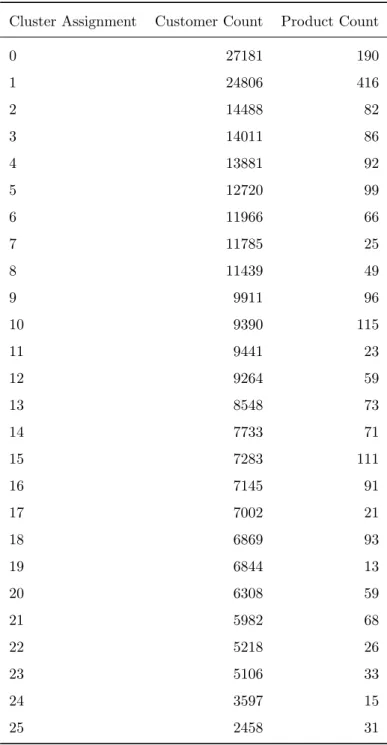
To perform the community detection on the constructed customer-product bipartite graph, the Louvain algorithm is used, implemented in the Python package louvain [27]. The execution is finished in 7.5 seconds on Mac with 1.1G processor and 8G memory, demonstrating its computatition efficiency. The total 262,498 vertices are partitioned into 35 clusters. The number of customers and products in 26 clusters are listed in Table 2. For example, in Cluster 0, there are 190 products and 27,181 customers, while in Cluster 1, there are 416 products and 24,806 customers. The remaining clusters are not presented because they retain less than 5 customers, considering that small clusters are not typically kept in practice unless there is a compelling reason.
4.4. Post-Clustering Analysis
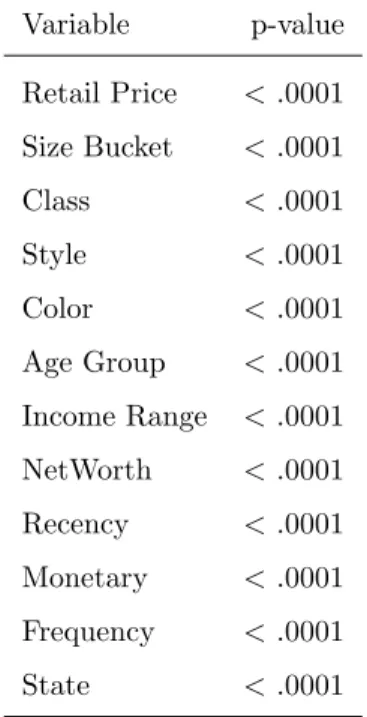
In this phase, the cluster assignment is coded as a categorical variable. The chi-square test is used to measure the independence between a categorical vari-able and the cluster assignment, and one-way ANOVA is used to measure the association between an interval variable and the cluster assignment. Based on the p-values of the corresponding statistical test, we present all the variables that are significantly related to cluster assignment in Table 3. This indicates that customers in each cluster have distinct characteristics and purchase behaviors measured by variables listed in Table 3.
The characteristics of the customers and products in each cluster can be examined and compared more closely by visualizations. Take Cluster 0 and Cluster 1 for example. Fig. 3 and Fig. 4 show the subgraph of Cluster 0 and Cluster 1, respectively, where the black dots denote customer and product vertices, and edges are colored based on the product class. As shown, the most frequently purchased products in Cluster 0 are panties and leggings, while the most frequently purchased products in Cluster 1 include bodysuit, bralette, contour u/w, panties, and leggings.
For other characteristics, based on the distributions of Cluster 0 and Cluster 1 marked as orange and green respectively in Appendix, we have the following
Table 2: Statistics of Clusters
Cluster Assignment Customer Count Product Count
0 27181 190 1 24806 416 2 14488 82 3 14011 86 4 13881 92 5 12720 99 6 11966 66 7 11785 25 8 11439 49 9 9911 96 10 9390 115 11 9441 23 12 9264 59 13 8548 73 14 7733 71 15 7283 111 16 7145 91 17 7002 21 18 6869 93 19 6844 13 20 6308 59 21 5982 68 22 5218 26 23 5106 33 24 3597 15 25 2458 31
Table 3: p-values of Statistical Tests Variable p-value Retail Price <.0001 Size Bucket <.0001 Class <.0001 Style <.0001 Color <.0001 Age Group <.0001 Income Range <.0001 NetWorth <.0001 Recency <.0001 Monetary <.0001 Frequency <.0001 State <.0001
Figure 4: Subgraph of Cluster 1
insights:
• Retail Price: The distribution of the retail price of products purchased by customers in Cluster 1 is more left-skewed, indicating that they are greater than the ones in Cluster 0 in average.
• Size Bucket: The distribution of the size of products purchased by cus-tomers in Cluster 1 is more left-skewed, indicating that they are larger than the ones in Cluster 0 in average.
• Class: The top five classes of products purchased by customers in Cluster 0 are panty, sharperwear, tights, tops and thong, while the ones in Cluster 1 are tops, leggings, underwear, shaper and bottoms.
• Style: The top styles of products purchased by customers in Cluster 0 are brief, thong and mid-thigh short, while the ones in Cluster 1 are full figure, mid-thigh short and leggings.
and Cluster 1. Customers in Cluster 0 also like midnight navy.
• Age Group: The distribution of customers’ age in Cluster 1 is more left-skewed, indicating that customers in Cluster 1 is older than customers in Cluster 0 in average.
• Recency: Most customers in both Cluster 0 and Cluster 1 are in the categories of 0-3, 4-6 and 7-9.
• Monetary: Its distribution is a little bit more left-skewed, indicating that customers in Cluster 1 spend more money than customers in Cluster 0 in average.
• Frequency: Most of customers’ purchase frequency in both Cluster 0 and Cluster 1 are 1. The second highest category in Cluster 0 is 2, while the one in Cluster 1 is 4+. This means customers in Cluster 1 purchase more frequently than customers in Cluster 0 in average.
• State: Compared with Cluster 0, Cluster 1 has more customers in the eastern areas of USA but less customers in California and Texas, according to Fig. 5a and Fig. 5b.
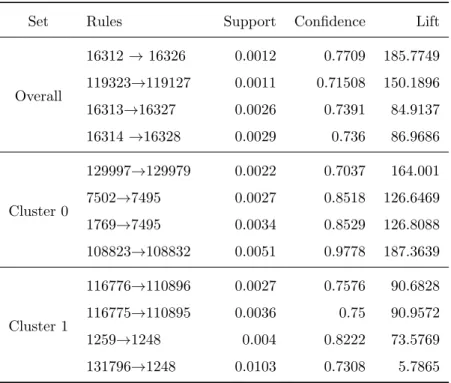
To further show different purchase behaviors in Cluster 0 and Cluster 1, market basket analysis is conducted on sales transactions of Cluster 0, Cluster 1 and overall, respectively. Their top association rules are very different, as shown in Table 4. For example, there is a strong association between Product 16312 and Product 16326 overall, but that is not true for Cluster 0 and Cluster 1. For Cluster 0, there is a higher possibility to achieve more sales by promoting Product 129997 and Product 129979 together, while for Cluster 1, a better opportunity is promoting Product 116776 and Product 110896 together.
5. Conclusions
By performing the community detection in the customer-product bipartite graph using the Louvain algorithm, we can effectively segment customers into
Figure 5: HeatMap of Customers in Cluster 0 and Cluster 1 (a) Cluster 0
(b) Cluster 1
Table 4: Top Product Association Rules
Set Rules Support Confidence Lift
Overall 16312 →16326 0.0012 0.7709 185.7749 119323→119127 0.0011 0.71508 150.1896 16313→16327 0.0026 0.7391 84.9137 16314 →16328 0.0029 0.736 86.9686 Cluster 0 129997→129979 0.0022 0.7037 164.001 7502→7495 0.0027 0.8518 126.6469 1769→7495 0.0034 0.8529 126.8088 108823→108832 0.0051 0.9778 187.3639 Cluster 1 116776→110896 0.0027 0.7576 90.6828 116775→110895 0.0036 0.75 90.9572 1259→1248 0.004 0.8222 73.5769 131796→1248 0.0103 0.7308 5.7865
clusters with distinct characteristics and identify associated products for each segment in the case study with a large U.S. retailer. To analyze the cluster-ing results by statistical tests, visualizations and association rules comparison in the post-clustering analysis, we show that the customers in different clus-ters are statistically different in aspects of their age, networth, income, state, recency, monetary, frequency, as well as the retail price, size, class, style and color of products they purchase. Based on the analysis of customers’ charac-teristics and products associated with each cluster, decision makers can obtain greater insights into customer purchase behaviors, make better strategies for personalization strategic planning (e.g. customized product recommendation), and have higher probabilities to achieve more sales and improve profitability. Moreover, this approach is demonstrated to be highly computationally efficient, by finishing the clustering on the customer-product bipartite graph constructed from almost 0.8 million sales transactions in 7.5 seconds on a standard PC. This caters to the requirement of the big data era. Besides the above promising results, the Louvain algorithm used in the proposed framework is interpretable in this context satisfying the demand for the algorithm transparency, since it produces groups in a way like the traditional K-means clustering method by optimizing the chosen similarity/dissimilarity measurement.
References
[1] D. Baer, G. Chakraborty, Product affinity segmentation using the dough-nut clustering approach, in: Proceedings of the SAS Global Forum 2013 Conference, Cary, NC, 2013.
[2] D. S. Baer, Csi: Customer segmentation intelligence for increasing profits, in: Proceedings of the SAS Global Forum 2012 Conference, Cary, NC: SAS Institute Inc, 2012.
[3] P.-N. Tan, et al., Introduction to data mining, Pearson Education India, 2007.
[4] M. K. Pakhira, A linear time-complexity k-means algorithm using clus-ter shifting, in: Computational Intelligence and Communication Networks (CICN), 2014 International Conference on, IEEE, 2014, pp. 1047–1051. [5] M. M. Mostafa, Knowledge discovery of hidden consumer purchase
be-haviour: a market basket analysis, International Journal of Data Analysis Techniques and Strategies 7 (4) (2015) 384–405.
[6] M. Kaur, S. Kang, Market basket analysis: Identify the changing trends of market data using association rule mining, Procedia computer science 85 (2016) 78–85.
[7] P. Q. Brito, C. Soares, S. Almeida, A. Monte, M. Byvoet, Customer seg-mentation in a large database of an online customized fashion business, Robotics and Computer-Integrated Manufacturing 36 (2015) 93–100. [8] V. D. Blondel, J.-L. Guillaume, R. Lambiotte, E. Lefebvre, Fast unfolding
of communities in large networks, Journal of statistical mechanics: theory and experiment 2008 (10) (2008) P10008.
[9] J. M. Pujol, V. Erramilli, P. Rodriguez, Divide and conquer: Partitioning online social networks, arXiv preprint arXiv:0905.4918.
[10] G. Roma, P. Herrera, Community structure in audio clip sharing, in: In-telligent Networking and Collaborative Systems (INCOS), 2010 2nd Inter-national Conference on, IEEE, 2010, pp. 200–205.
[11] L. Zhang, X. Liu, F. Janssens, L. Liang, W. Gl¨anzel, Subject clustering analysis based on isi category classification, Journal of Informetrics 4 (2) (2010) 185–193.
[12] K. K. Tsiptsis, A. Chorianopoulos, Data mining techniques in CRM: inside customer segmentation, John Wiley & Sons, 2011.
[14] D. S¸chiopu, Applying twostep cluster analysis for identifying bank cus-tomers’ profile, Buletinul 62 (2010) 66–75.
[15] H.-H. Wu, E.-C. Chang, C.-F. Lo, Applying rfm model and k-means method in customer value analysis of an outfitter, in: Global Perspective for Com-petitive Enterprise, Economy and Ecology, Springer, 2009, pp. 665–672. [16] D. Chen, S. L. Sain, K. Guo, Data mining for the online retail industry: A
case study of rfm model-based customer segmentation using data mining, Journal of Database Marketing & Customer Strategy Management 19 (3) (2012) 197–208.
[17] J.-J. Jonker, N. Piersma, D. Van den Poel, Joint optimization of customer segmentation and marketing policy to maximize long-term profitability, Expert Systems with Applications 27 (2) (2004) 159–168.
[18] C.-H. Cheng, Y.-S. Chen, Classifying the segmentation of customer value via rfm model and rs theory, Expert systems with applications 36 (3) (2009) 4176–4184.
[19] H. Hwang, T. Jung, E. Suh, An ltv model and customer segmentation based on customer value: a case study on the wireless telecommunication industry, Expert systems with applications 26 (2) (2004) 181–188.
[20] M. Namvar, M. R. Gholamian, S. KhakAbi, A two phase clustering method for intelligent customer segmentation, in: Intelligent Systems, Modelling and Simulation (ISMS), 2010 International Conference on, IEEE, 2010, pp. 215–219.
[21] R. Agrawal, R. Srikant, et al., Fast algorithms for mining association rules, in: Proc. 20th int. conf. very large data bases, VLDB, Vol. 1215, 1994, pp. 487–499.
[22] S. Brin, R. Motwani, J. D. Ullman, S. Tsur, Dynamic itemset counting and implication rules for market basket data, Acm Sigmod Record 26 (2) (1997) 255–264.
[23] T. Brijs, G. Swinnen, K. Vanhoof, G. Wets, Using association rules for product assortment decisions: A case study, in: Proceedings of the fifth ACM SIGKDD international conference on Knowledge discovery and data mining, ACM, 1999, pp. 254–260.
[24] R. C. Blattberg, B.-D. Kim, S. A. Neslin, Market basket analysis, in: Database Marketing, Springer, 2008, pp. 339–351.
[25] A. S. Asratian, T. M. Denley, R. H¨aggkvist, Bipartite graphs and their applications, Vol. 131, Cambridge University Press, 1998.
[26] V. D. Blondel, The Louvain method for community detection in large networks, accessed: 2018-10-11 (2018).
URL https://perso.uclouvain.be/vincent.blondel/research/
louvain.html
[27] V. Traag, louvain Documentation, accessed: 2018-10-11 (2018).
URLhttps://louvain-igraph.readthedocs.io/en/latest/
Figure 6: Distribution of Retail Price of Products Purchased by Customers
Figure 8: Distribution of Class of Products Purchased by Customers
Figure 10: Distribution of Color of Products Purchased by Customers
Figure 12: Distribution of Customers’ Networth
Figure 14: Distribution of Customers’ Monetory