HAL Id: hal-02274640
https://hal.archives-ouvertes.fr/hal-02274640
Submitted on 30 Aug 2019
HAL
is a multi-disciplinary open access
archive for the deposit and dissemination of
sci-entific research documents, whether they are
pub-lished or not. The documents may come from
teaching and research institutions in France or
abroad, or from public or private research centers.
L’archive ouverte pluridisciplinaire
HAL
, est
destinée au dépôt et à la diffusion de documents
scientifiques de niveau recherche, publiés ou non,
émanant des établissements d’enseignement et de
recherche français ou étrangers, des laboratoires
publics ou privés.
Heart Rate Estimation from Phonocardiogram Signals
Using Non-negative Matrix Factorization
Nafissa Dia, Julie Fontecave-Jallon, Pierre-Yves Guméry, Bertrand Rivet
To cite this version:
Nafissa Dia, Julie Fontecave-Jallon, Pierre-Yves Guméry, Bertrand Rivet. Heart Rate Estimation
from Phonocardiogram Signals Using Non-negative Matrix Factorization. ICASSP 2019 - 2019 IEEE
International Conference on Acoustics, Speech and Signal Processing (ICASSP), May 2019, Brighton,
United Kingdom. �10.1109/ICASSP.2019.8682343�. �hal-02274640�
HEART RATE ESTIMATION FROM PHONOCARDIOGRAM SIGNALS USING
NON-NEGATIVE MATRIX FACTORIZATION
1,2
Nafissa Dia,
1Julie Fontecave-Jallon,
1Pierre-Yves Gumery,
2Bertrand Rivet
1Univ. Grenoble Alpes, CNRS, CHU Grenoble Alpes, Grenoble INP
∗, TIMC-IMAG, Grenoble, France
2Univ. Grenoble Alpes, CNRS, Grenoble INP
∗, GIPSA-lab, Grenoble, France
∗Institute of Engineering Univ. Grenoble Alpes
ABSTRACT
Electrocardiogram (ECG) is classically considered for heart rate (HR) estimation. However in certain conditions, its use may be difficult and alternative techniques, such as phono-cardiograhpy (PCG), are investigated. For PCG signals, in most studies, the challenge is to detect and annotate the heart soundsS1 andS2, which may become quasi-impossible in case of noise. In this paper, we present a novel approach of HR estimation from PCG signals based on non-negative ma-trix factorization (NMF), applied to the spectrogram of PCG, considered as a source-filter model. Compared to state of the art methods, specific considerations based on the signal prop-erties have been included to ensure the reliability of the de-composition. HR estimations obtained from noise-free and noisy real PCG signals are evaluated by comparison to HR estimation from synchronous ECG.
Index Terms— Phonocardiogram, Heart rate estimation, Non-Negative Matrix Factorization
1. INTRODUCTION
Electrocardiogram (ECG) is the reference technique for heart rate (HR) monitoring in adults; the cardiac frequency is usu-ally estimated according to the detection of prominent R
waves on ECG signals [1]. However, besides the classical practical limitations such as movement sensibility, the use of electrodes also appears to be a problem when used on elderly people. Therefore, due to the population aging and the increase of health monitoring needs, there is a current interest in alternative non-invasive techniques to replace ECG for HR monitoring in different situations. Among others, Phonocardiography (PCG) is a diagnostic graphical method of recording echoes that accompany mechanical vibrations originating in the heart and vessels. It is used to register heart sounds and murmurs in the diagnosis of heart diseases. It uses a microphone attached at the surface of the chest wall to the usual auscultatory points of the heart. Among cardiac
This work is supported by the French National Research Agency, as part of the SurFAO project (ANR-17-CE19-0012).
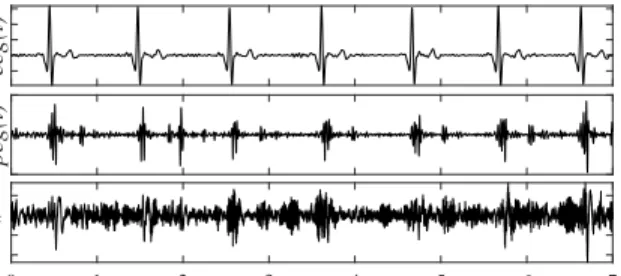
ecg(t) pcg(t) 0 1 2 3 4 5 6 7 Time (sec) pcg n (t)
Fig. 1. Synchronous signals. From top to bottom: ECG, PCG and noisy PCG.
sounds, two, noted respectively S1 andS2, are particularly
audible and correspond to the closure of respectively the atrial-ventricular valves (beginning of the ventricular systole) and the aortic and pulmonary valves (onset of the ventricular diastole). As shown in Fig.1, a PCG signal is therefore a succession of two bumpsS1andS2, following the R peak of a synchronous ECG signal.
S1 andS2occur in all healthy individuals and are more or less easy to detect. Therefore, most studies on PCG anal-ysis deal with the detection of these first two heart sounds and can be divided according to whether they use a differ-ent signal than PCG (ECG, carotid / jugular pulse etc.) or the only PCG. A wide amount of methods uses the signal envelop detection for analyzing heart sounds. Common used meth-ods are based on homomorphic filtration, signal energy com-putation (Square energy, Shannon entropy, Shannon energy) or Hilbert transform [2, 3, 4, 5]. Other proposed methods are based on Short Time Fourier transformation and Wavelet transformation in order to investigate the exact features of the heart sound [6, 7]. More sophisticated methods include prob-abilistic models such as Hidden Markov Models for segmen-tation of heart sounds [8, 9] or neural networks [10, 11].
The amount of proposed methods highlights the difficulty of detection of heart sounds and this difficulty is further in-creased in noisy conditions, as illustrated in Figure 1 with a noisy PCG on which S1 and S2 cannot be identified at
each cardiac cycle. Most of the algorithms will suffer from a lack of robustness for sounds detection in such conditions.
Moreover, for HR monitoring, the classification ofS1andS2
sounds is essential to estimate the cardiac beat-to-beat inter-vals asS1-S1, similarly asR-Rintervals on ECG signals.
Therefore, we propose a new method for HR monitoring from PCG signals which needs the only source PCG, allows to avoid the distinction betweenS1 andS2 and is robust to
noise. The method is based on the Non-negative Matrix Fac-torization (NMF) approach [12, 13, 14] applied on the spec-trogram of the PCG signal.
2. PROPOSED METHODOLOGY
In this section, we will first detail the reasons why PCG signals are modelled as source-filter based on their quasi-harmonic structure. Indeed, this structure carries an impor-tant information namely heart rate which will be estimated in a second step using a NMF-based algorithm presented at the end of the section.
2.1. Signal modelling
To model a PCG signalx(t), which is a succession of heart beats, one can write that
x(t) =X
i
si(t−τi), (1)
whereτiare the cardiac beats instants andsiis the shape ofS1
andS2bumps succession at theith heart beat. This expression
can be rewritten as
x(t) =X
i
si(t)∗δ(t−τi), (2)
which is nothing else but a time-varying filtering of an input signale(t) =P
iδ(t−τi)by a time-varying filter whose
im-pulse responsesi(t)depends on the considered time. Indeed,
due to the non-stationarity of physiological signals, both the duration,∆i =τi+1−τi, and the shape,si(t), of each beat
can be different from one beat to an other one. Consequently, the PCG signal can be modelled as a source-(time-varying) filter model. To study such non-stationary signals, it is com-mon to apply a time-frequency representation like the spec-trogram. It is expected that the spectrogram of the signal (2) exhibits an harmonic structure due to the excitation term (i.e.
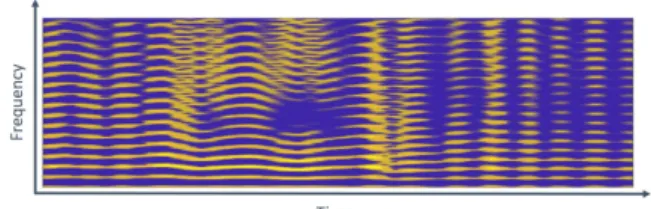
the input signale(t)) whose fundamental frequency is time-varying and whose amplitude is modulated by a time-time-varying envelop due to the shape of each heart beat. As shown in Fig. 2, the quasi-harmonic structure is clearly shown and the fluctuation of the fundamental frequency represents the evo-lution of the heart rate that has to be estimated.
2.2. Estimation of heart rate by NMF
In time-frequency domain, the short-time Fourier transform (STFT)X(f, t)ofx(t)is expressed as
∀(f, t), X(f, t) =X(e)(f, t)X(ϕ)(f, t), (3)
Fig. 2. Spectrogram of a noisy-free PCG (Fs=1kHz, window
=4s, noverlap =64ms, nfft =8s)
whereX(e)(f, t)(resp.X(ϕ)(f, t)) is the STFT of the
excita-tion (resp. the filter). This equaexcita-tion can be recast into matrix form to model the spectrogram as
X=X(e)X(ϕ), (4)
X∈RF×N,X(e)∈RF×N andX(ϕ) ∈RF×N, withF the
number of frequency bins and N the number of time win-dows, whose (f, t)th elements are |X(f, t)|2, |X(e)(f, t)|2
and|X(ϕ)(f, t)|2, respectively. is the Hadamard product
(i.e.the element-wise multiplication).
An efficient way to analyze a spectrogram A is the NMF [12, 13] which allows to factorize it as a product of two non-negative matricesWHof lower rank than the rank ofA. Applied on the source-filter model, this leads to [14]
X' W(e)H(e)
W(ϕ)H(ϕ)
, (5)
whereW(e) andW(ϕ)are the spectral templates of the
ex-citation and filter, respectively andH(e)andH(ϕ) are their
related temporal amplitudes.
However, this NMF decomposition (5) suffers from a problematic ambiguity: without any constraint, the two terms
W(e)H(e)andW(ϕ)H(ϕ)are perfectly interchangeable due
to the element-wise multiplication. One way to overcome this identifiability issue is to add some constraints on both excitation and filter parts. The two proposed constraints are firstly to fix W(e) such that each column is a Dirac comb
with different fundamental frequencies. Consequently, the role ofH(e) is to rightly select one consistent cardiac
fre-quency among all these present inW(e) at each time. And
secondly to ensure thatW(ϕ)is used to model the spectral
envelop of the PCG beats and H(ϕ) is their temporal evo-lution, a smoothness constraint is added on the columns of
W(ϕ)which models the spectral envelop of each PCG beat. Contrary to [14], this smoothness property is not ensured by decomposingW(ϕ) on a dictionary of smooth functions but by adding a constraint term into the criterion as detailed in the next section. This allows us to reduce the number of parameters to be estimated and thus speed up the algorithm.
2.3. Algorithm based on NMF
To estimate the excitation and filter parts by NMF, the follow-ing cost function is minimized1
C H(e),W(ϕ),H(ϕ)
=D2(X|V) +γsS W(ϕ), (6)
where V = W(e)H(e) W(ϕ)H(ϕ), D2(·|·) is the Frobenius norm betweenXandV
D2 X|V =1 2 kX−Vk 2 F (7) andS W(ϕ)
is a smoothness constraint on the columns of
W(ϕ) S(W(ϕ)) = Kϕ X kϕ=1 F X f=2 Wf,k(ϕ) ϕ−W (ϕ) f−1,kϕ 2 , (8)
where Kϕ is the number of filter components. S W(ϕ)
constrains the spectral templates of the filter to have small variations with respect to the frequency. However some scaling factor ambiguities also affect the decomposition (5): indeed substitutingW(e) andH(e) byD(W)W(e)D(e) and
D(e)−1
H(e)D(H), respectively and W(ϕ) and H(ϕ) by
D(W)−1
W(ϕ)D(ϕ)and D(ϕ)−1
H(e) D(H)−1
, respec-tively, where allDmatrices are diagonal with positive entries, leads to the same approximation. To overcome these scaling ambiguities, the smoothness constraint is changed to
S W(ϕ),H(e),W(ϕ) = X ke,kϕ,n Hk(e) e,n 2 Hk(ϕ) ϕ,n 2 F X f=2 Wf,k(ϕ) ϕ−W (ϕ) (f−2),kϕ 2 , (9)
To optimize (6) with the smoothness constraint (9), H(e),
W(ϕ)andH(ϕ)components are updated alternatively using
a majoration minimization (MM) algorithm. Due to the lack of space, the detail of the auxiliary functions are omitted but are based on the F´evotteet al. paper [15]. This leads to the following multiplicative updates ofH(e),W(ϕ),H(ϕ)
H(e)←H(e)[W(e)]T(V(ϕ)X)
[W(e)]T(V(ϕ)V) +γsH(e)(1Kecn)
,
with1Ke a vector of ones of lengthKeandcn a row vector
whosel-th entry iscn(l) =Pf(W (ϕ) f,kϕ−W (ϕ) (f−2),kϕ) 2 h(ϕ) l .2 , whereh(le)is thel-th column ofH(e)and(·).2is the element
wise square power.
H(ϕ)←H(ϕ)[W(ϕ)]T(V(e)X)
[W(ϕ)]T(V(e)V)+γsDiag(δW(e)) 1KϕβH(e)
H(ϕ),
1Recall that as discussed into the previous section,W(e) is kept fixed during the estimation process.
with Diag δW(e)
a diagonal matrix whose kϕ-th entry is
P f(W (ϕ) f,kϕ−W (ϕ) f−1,kϕ) 2andβ
H(e)a row vector whosel-th
entry isP
ke(H
(e)
ke,l)
2.
The equations to updateW(ϕ)depend on the index of the row as follows: ∀f, W(f,ϕ:)←W(f,ϕ:) XV(e)f,: H(ϕ)T+γsΛ (ϕ) f,: VV(e)f,: H(ϕ)T +γsΓ (ϕ) f,: ,
where(.)f,:corresponds to thef-th row of the related matrix,
with iff = 1 Λ(1ϕ,:)= W1(ϕ,:)+W(2ϕ,:) ∆H and Γ (ϕ) 1,: = 2W (ϕ) 1,:∆H, if2≤f ≤F−1 Λ(f,ϕ:)= 2W(f,ϕ:)+W((ϕf−)1),:+W((ϕf+1)) ,:∆H Γ(f,ϕ:)= 4Wf,(ϕ:)∆H, and iff =F ΛF,(ϕ:)= WF,(ϕ:)+W((Fϕ)−1),: ∆H and Γ (ϕ) F,: = 2W (ϕ) F,:∆H with∆H =Pn(βH(e)Pk
ϕβH(ϕ))whereβH(e) a row
vec-tor whosel-th entry isP
ke(H
(e)
ke,l)
2andβ
H(ϕ) = (H(ϕ)).2.
The initialization of this iterative algorithm is crucial. To this end, some physiological considerations are taken into ac-count to both simplify the choice of the initial matricesH(e),
W(ϕ)andH(ϕ)and to speed up the convergence. Each col-umn ofW(e)is a Dirac comb with fundamental frequencies from30bpm (i.e0.5Hz) to180bpm (i.e3Hz), withKe=100,
modulated by an average PCG signal envelop. The choice of a modulated dictionaryW(e)leads to an easier initialization ofW(ϕ). Indeed, theK
ϕ=2 components ofW(ϕ)model thus
the departure from the average PCG envelop instead of itself. Consequently,W(ϕ)is initialized around1 and the number
of iterations in the NMF can be reduced. Finally,H(e)is
ini-tialized around1 as the cardiac frequency to be selected is unknown andH(ϕ)is also initialized around1since the
tem-poral evolution of the PCG is unknown.
3. RESULTS: HR ESTIMATION FROM PCG
In this part, synchronous ECG and PCG signals considered for performances evaluation will be presented. Then, HR es-timation results fromH(e)will be depicted.
3.1. Signals database
A real signals database previously proposed to Signal Separa-tion EvaluaSepara-tion Campaign in 2016 (SiSEC 2016) [16] is con-sidered for evaluation. Acquisitions at 1kHz were performed on three healthy volunteers at TIMC-IMAG laboratory. PCG
10 20 30 40 50 Time (sec) 60 80 100 Freq (bpm) 10 20 30 40 50 Time (sec)
Fig. 3. Estimation of the HR from a clean PCG (sample 9). Left:H(e)from proposed NMF. Right:HR
P CG(red line) is
estimated fromH(e)and compared toHR
ECG(black line).
signals were recorded with a cardiac microphone (MLT201) put on the skin in front of the heart and band-pass filtered be-tween 15 and 300Hz. Noisy PCG signals were then artificially created from the filtered PCG and different real interference signals (pseudoperiodic noises of breath type, cough, radio, etc.), recorded separately. Synchronous D2 lead ECG signals were also recorded. The database finally consists of 16 sam-ples with a duration from 10 to 70 seconds, each composed of a clean filtered PCGpcg(t), an artificially noisy PCGpcgn(t)
and the synchronous ECGecg(t).
The classical algorithm of Pan-Tomkins [1] was applied on each ECG to detect R-waves, computeR-Rintervals and es-timate the heart rate. This HR estimation is notedHRECG.
3.2. HR estimation fromH(e)
The proposed NMF approach is applied on PCG signals. For an easier use of the source-filter modelling and to keep the excitation spectral templateW(e) as simple as described in
Section 2, we consider the rectified PCG signals.
The algorithm allows to estimate the temporal amplitudes of the excitation and filter, as well as the spectral template of the filter. For HR estimation, we focus on the excitation temporal amplitudeH(e). One example can be observed on Fig. 3 for sample 9. A time-varying fundamental frequency is emerging and corresponds to the instantaneous cardiac fre-quency detected on PCG. Thereby, instantaneous heart rate from PCG is estimated fromH(e), as the frequency of
max-imum power at each column ofH(e).This estimation is then
downsampled so as to associate one PCG cardiac frequency to eachR-wave of the ECG signal. The resulting HR esti-mation on clean filtered PCG signalspcg(t)(respectively on artificially noisy PCG signalspcgn(t)) is notedHRP CG
(re-spectivelyHRnP CG). These estimations are compared with
the one obtained from the reference ECGHRECG.
3.3. Performances of the proposed method
The performance of the proposed method is evaluated through-out the quality of HR estimation from PCG signals. First, considering the clean PCG signals, the relative error be-tweenHRECG andHRP CG is computed for each sample,
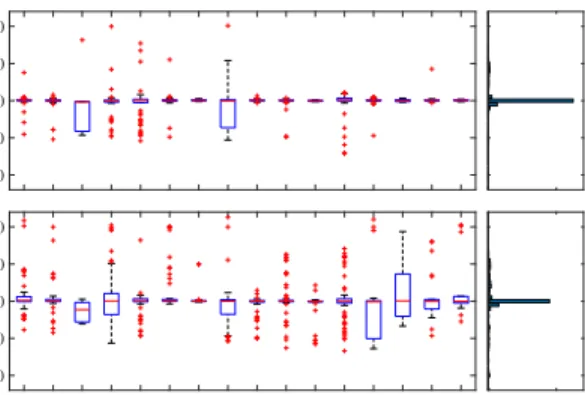
-100 -50 0 50 100 Relative error [%] 1 2 3 4 5 6 7 8 9 10 11 12 13 14 15 16 -100 -50 0 50 100 Relative error [%]
Fig. 4. Performance of HR estimation for noise-free PCG and noisy PCG signals for 16 samples. Relative error between
HRECGandHRECG(top) orHRnP CG(bottom).
as = (HRP CG −HRECG)/HRECG. Results are
pre-sented in Fig.4 as boxplots, which represent the parameters distribution: red lines correspond to the median, the boxlimits represent the first and the third quartiles, whiskers highlight extreme values and red x-marks correspond to outliers.
For most of samples, HR estimation from clean filtered PCG signals is very similar to HR estimation from ECG. In-deed, the median of the relative error for all samples is 0.1% and 770 heart cycles over 812 lead to a relative error lower than 5%. This is confirmed by the global histogram which highlights a peaky distribution around 0. Considering the noisy PCG signals, a similarly good behavior is observed. The median of the error is 0.1% for the overall set of noisy samples. The related histogram shows a slight higher spread of the relative errors. However, more than 84% (686 over 812) of heart cycles are detected with an error lower than 5%.
4. CONCLUSION
In this study, an improvement of a NMF decomposition based on a source-filter model has been proposed to estimate the HR from PCG in real conditions from noisy signals. Based on signal properties, constraints have been added to avoid identifiabilities issues. The proposed approach prevents from the difficult detection ofS1 andS2 cardiac sounds as most often considered in PCG analysis (see Section 1) and allows a very satisfactory HR estimation from noise-free PCG signals. The origins of estimation errors mainly lie on the transition fromH(e) to the HR computation. Some properties of HR
may be introduced for a more robust estimation.
In case of noisy signals, for which the sounds detection and the cardiac frequency estimation are quasi-impossible on tem-poral signals, the HR estimation obtained with our methodol-ogy is promising. We intend to add several improvements to the method, considering on one hand the sparse property of the excitation temporal amplitudeH(e), and on the other hand
5. REFERENCES
[1] J. Pan and W. J. Tompkins, “A retime qrs detection al-gorithm,” IEEE Transactions on Biomedical Engineer-ing, vol. BME-32, no. 3, pp. 230–236, March 1985. [2] H. Liang, S. Lukkarinen, and I. Hartimo, “Heart sound
segmentation algorithm based on heart sound envelo-gram,” inComputers in Cardiology 1997, Sept 1997, pp. 105–108.
[3] Samjin Choi and Zhongwei Jiang, “Comparison of en-velope extraction algorithms for cardiac sound signal segmentation,” Expert Systems with Applications, vol. 34, no. 2, pp. 1056 – 1069, 2008.
[4] Amir A. Sepehri, Arash Gharehbaghi, Thierry Dutoit, Armen Kocharian, and A. Kiani, “A novel method for pediatric heart sound segmentation without using the ecg,”Computer Methods and Programs in Biomedicine, vol. 99, no. 1, pp. 43 – 48, 2010.
[5] D. Gill, N. Gavrieli, and N. Intrator, “Detection and identification of heart sounds using homomorphic en-velogram and self-organizing probabilistic model,” in
Computers in Cardiology, 2005, Sept 2005, pp. 957– 960.
[6] A. Djebbari and F. Bereksi Reguig, “Short-time fourier transform analysis of the phonocardiogram signal,” in
ICECS 2000. 7th IEEE International Conference on Electronics, Circuits and Systems (Cat. No.00EX445), Dec 2000, vol. 2, pp. 844–847 vol.2.
[7] Jung Jun Lee, Sang Min Lee, In Young Kim, Hong Ki Min, and Seung Hong Hong, “Comparison between short time fourier and wavelet transform for feature extraction of heart sound,” in Proceedings of IEEE. IEEE Region 10 Conference. TENCON 99. ’Multimedia Technology for Asia-Pacific Information Infrastructure’ (Cat. No.99CH37030), Sept 1999, vol. 2, pp. 1547– 1550 vol.2.
[8] S E Schmidt, C Holst-Hansen, C Graff, E Toft, and J J Struijk, “Segmentation of heart sound recordings by a duration-dependent hidden markov model,” Physiologi-cal Measurement, vol. 31, no. 4, pp. 513, 2010.
[9] L. G. Gamero and R. Watrous, “Detection of the first and second heart sound using probabilistic models,” in
Proceedings of the 25th Annual International Confer-ence of the IEEE Engineering in Medicine and Biology Society (IEEE Cat. No.03CH37439), Sept 2003, vol. 3, pp. 2877–2880 Vol.3.
[10] Cota Navin Gupta, Ramaswamy Palaniappan, Sun-daram Swaminathan, and Shankar M. Krishnan, “Neu-ral network classification of homomorphic segmented heart sounds,” Applied Soft Computing, vol. 7, no. 1, pp. 286 – 297, 2007.
[11] Chung-Hsien Wu, Ching-Wen Lo, and Jhing-Fa Wang, “Computer-aided analysis and classification of heart sounds based on neural networks and time analysis,” in1995 International Conference on Acoustics, Speech, and Signal Processing, May 1995, vol. 5, pp. 3455– 3458 vol.5.
[12] Pentti Paatero and Unto Tapper, “Positive matrix fac-torization: A non-negative factor model with optimal utilization of error estimates of data values,” Environ-metrics, vol. 5, no. 2, pp. 111–126, 1994.
[13] Daniel D Lee and H Sebastian Seung, “Learning the parts of objects by non-negative matrix factorization,”
Nature, vol. 401, no. 6755, pp. 788, 1999.
[14] J. Durrieu, A. Ozerov, C. F´evotte, G. Richard, and B. David, “Main instrument separation from stereo-phonic audio signals using a source/filter model,” in
EUSIPCO, Aug 2009, pp. 15–19.
[15] C´edric F´evotte and J´erˆome Idier, “Algorithms for non-negative matrix factorization with the β-divergence,”
Neural computation, vol. 23, no. 9, pp. 2421–2456, 2011.
[16] Antoine Liutkus, Fabian-Robert St¨oter, Zafar Rafii, Daichi Kitamura, Bertrand Rivet, Nobutaka Ito, Nobu-taka Ono, and Julie Fontecave, “The 2016 signal sep-aration evaluation campaign,” inInternational Confer-ence on Latent Variable Analysis and Signal Separation. Springer, 2017, pp. 323–332.