Thesis by Ron Gregg
In Partial Fulfillment of the Requirements for the Degree of
Doctor of Philosophy
California Institute of Technology Pasadena, California
1977
ACKNOWLEDGEMENTS
For motivating this experiment in the first place, for his undimin-ished interest in it, and especially for allowing me to pursue the research in my own style, my greatest thanks to Tom Tombrello. I also wish to thank Don Burnett and his crew in Mudd for initiating me into the mysteries (if not the joy~ of the fission track technique. Ziggy Switkowski is also deserving of a special mention for his constant enthusiasm and for good advice on many occasions. Conversations with Bob Weller, Joe Griffith, and others in Kellogg proved quite useful at times. The helpfulness and general friendliness of the many staff mem-bers in Kellogg was greatly appreciated.
This section would not be complete without acknowledging the deni-zens of Page House, Chester's Jesters, and the many other friends here at Caltech (who shall remain nameless for their own protection) who have made the last few years so enjoyable.
The person deserving of the most gratitude of all is Sue, who gave up so much that I might pursue graduate studies at Caltech.
ABSTRACT
Sputtering yields for uranium metal under bombardment by 13 - 120 keV protons and by 20 - 120 keV He+ are presented. Angular distributions of the material sputtered by these ionsarealso given. Sputtering yields for 40 and 80 keV Ar+ were measured as well.
The technique employed to make these measurements was the detection of fission tracks in mica produced by 235u sputtered onto collector foils which were subsequently exposed to a high fluence of thermal neutrons. The technique is extremely sensitive and allowed the measurement of
sputtering yields less than 10-4 atoms per ion. It also made possible a detailed study of the emission of chunks from the uranium targets during sputtering. Mass distributions of chunks emitted during bombard-ment by 40 - 120 keV protons and by 80 keV argon are presented.
TABLE OF CONTENTS I. Introduction
II. Experimental Procedures A. An Overview
B. Sputtering
The Sputtering Assembly The Ultra-High Vacuum System The Ion Beams
Target Preparation The Sputtering Runs C. Track Detection
The Mica
Neutron Irradiation Etching
Scanning
III. Experimental Results A. Target Surfaces
B. Angular Distributions of Sputtered Atoms C. Total Sputtering Yields
D. Chunk Emission E. Error Analysis
IV. Theory and Speculation 41
A. The Collision Cascade Theory 41
B. Comparison to Results 46
C. Chunk Emission 48
V. Summary 51a
VI. Appendices 52
A. Sensitivity of the Fission Track Detection Technique 52
B. Ultra-High Vacuum Technique 55
C. Effect of Adsorption on the Sputtering Yields 61 D. Neutron Fluence Determination Using NBS
Neutron-Irradiated Standards VII. References
VIII. Tables IX. Figures
I. INTRODUCTION
Sputtering, to put it as succinctly as I can, is the ejection by a flux of particles of some of the constituent atoms of an object from one of the surfaces of that object. The principal quantity which characterizes sputtering is the sputtering yield "S" defined as the number of atoms ejected per incident particle. Scientific
investiga-tion of sputtering extends back many decades and ~as grown into a vigorous and multifaceted field, as one may quickly determine by con-sulting one of the many recent books and review articles on the sub-ject.2•30 Design considerations for thermonuclear reactors provide some of the strongest motivation for studying sputtering today.20 This is due to the fact that bombardment of the first wall of the reactor vessel by energetic particles will erode the wall and may sputter enough mate-rial to poison the plasma. Sputtering of the lunar surface by the solar wind31 •47 and sputtering of such diverse astrophysical surfaces as those
found on Io33 and on interstellar grains 51 are also topics stimulating current interest in the field.
My own involvement in this sputtering business developed out of another experiment--an attempt to measure the cross-section at energies near 100 keV for 10B(p,a) 7Be using very thin 10
s
targets. It wastechnique--namely, the use of plastic track detectors and the 10B(n,a) reaction to determine the amount of sputtered 10B collected on a foil. I must digress for a moment to comment that the interest in sensitive techniques is largely motivated by the low sputtering yields typically produced by light ions. The interest in sputtering by light ions
(such as neutrons, protons, and a particles) is largely motivated by the fact that they are the primary constituents of the solar wind and contemplated first-generation CTR plasmas.
In any event, Ziggy took his enthusiasm for this sensitive tech-nique to a typical gathering of the minds in Lauritsen Library in Kellogg, where Tom Tombrello proposed that sputtering of 235
u would be
even more sensitive, and easier. One would still use the nuclear trackdetection method to measure the amount of sputtered material collected on a foil, but in this case exposure of the collector foils to a high neutron fluence would result in 235U-fission fragments which would register in pieces of mica placed against the collector foils. The tracks would be made visible by etching in HF and could be counted with the aid of a microscope. The attractiveness of this proposal was
The feasibility of the experiment depended on the magnitudes of a few physical and empirical quantities which are connected by a couple of simple equations. The fission track density on the micas placed next to the collector foils during neutron irradiation is the quantity which must ultimately be determined by microscopic scrutiny of said pieces of mica. The number of tracks per square centimeter is given by
where Nu = number of 235u atoms/cm2 on the collector foil N = neutron fluence from irradiation in the reactor
n (=thermal neutrons per cm2 )
a = 235
u
fission cross section at 2200 m/sec = 580 bnf
The density of 235
u
atoms collected is given approximately by-~
Nu - 2 2nr
where S = sputtering yield (atoms/ion) NP = total number of incident ions
r = distance from target to collector foil
Equations
(1-1)
and(1-2)
can be combined to yield(1-l}
( 1-2)
mica, in the collector foils, or acquired on the surface of either from the environment. Using information supplied by Don Burnett's group in Caltech's Mudd Laboratory, I estimated that NT= 105cm-2 would be sufficiently above background and would provide a convenient
track density for the microscopic scanning. (Both of these conjectures proved to be correct).
Now for the right-hand side of equation (1-3). Based on the work of Finfgeld et a1.10 on the sputtering of several metals by 0.5-8 keV protons, I guessed that the yield for 100 keV protons on uranium would be on the order of 10-4 (which turned out to be true). It was also known that a fluence of 1014 neutrons/cm2 was readily
obtain-able in the thermal colurm at the UCLA reactor. A practical distance r from target to collector foil is about 3 em, determined from considera-tions of ion-beam size and sputtering chamber geometry. Plugging these numbers into (1-3) then implies that a total incident proton dose of
~
1018 would be required to produce a final track density NT= 105cm-2.This in turn implies bombarding the target with 10 ~A of beam for 5 hours, which is possible with the ion source available in Kellogg. The conclusion was, therefore, that the experiment would be feasible.
of up to 1o16cm-2 . This compensated for the reduced ion-beam current and permitted hydrogen sputtering runs of between 15 minutes and
5 hours (depending on choice of NP and Nn). Due to the much larger
sputtering yield from helium (S ~ 10-2), a typical helium run was 1 ~A
for 60 seconds. For argon the sputtering yield is on the orrler of 2,
which meant runs with argon lasted less than a minute with ~10 nA of
*
beam to avoid too large a track density in the mica detectors.
Jt was realized in the beginning (by Tom and Don at least) that
the experiment held promise in a number of ways. First of all, it
ought to be sensitive enough to measure the sputtering yield for protons
with energies near 100 keV. It was also expected that angular
distribu-tions for the sputtered material could be obtained. Both of these expectations have been fulfilled. Sputtering yields and angular
dis-tributions have been measured for 13-120 keV protons. Additionally,
angular distributions and sputtering yields for 40-120 keV 4He
have been obtained. It was further hoped that the technique
would prove to be sensitive enough to imply the feasibility of
doping various materials with 235
u
to allow low-sputtering-yieldstudies of other materials utilizing the same technique. The technique
has in fact proved to be sensitive enough, and this is discussed in
some detail in Appendix A. Another area in which results were looked
for was the area of chunk emission, since chunks collected on the foils would show up as star-bursts of fission tracks in the micas. This
would pennit one to actually determine the chunk size. In fact many
chunks have been seen on the collector foils, and data on the amount
of chunk emission and distributions of chunk size are presented. One
final bit of information that is presented is some limited data on
molecular sputtering by H2 and H3.
Inasmuch as there are a number of parameters that one may vary in a sputtering experiment, I will summarize here what was and what was not varied.
1. The effect of beam energy on sputtering yield was inves
ti-gated for 10-120 keV 1H and 40-120 keV 4He.
2. The angular distribution of the sputtered uranium was de
-tenni ned.
3. The angle of incidence of the beam was not varied; all sput-tering was done with perpendicular incidence of the beam on target.
4. A comparison between the sputtering yield from slightly oxi-dized target surfaces and sputter-cleaned target surfaces is presented, but there was no investigation of yield as a function of surface finish. All the targets were more or
less uniformly rough at the 1~ level.
5. There was no systematic study of dose effects; new target areas were used for each run to eliminate possible effects
from non-uniform dose.
Before we plunge ahead into the experimental procedures, a few words should be said about why the sputtering is performed in ultrahigh
vacuum. The primary concern is that the target surface be as clean as possible during the sputtering runs. Cleanliness of the surface is im-portant because the sputtered atoms originate from within only a very few monolayers at the surface. If the surface is oxidized or has
various substances adsorbed on it, then the sputtering yield of uranium will decrease as energy is expended to sputter atoms other than uranium.
Provided that the surface is clean at the atomic level at the beginning of a sputtering run, it will remain so if the rate of adsorption of gases is small compared with the rate at which they are sputtered away by the ion beam. Since the intrinsic sputtering rates for keV protons are quite low, and since the beam current density must be kept low to prevent overheating of the targets, the vacuum must be quite good to avoid accumulation of surface contaminants during hydrogen sputtering runs. The vacuum requirements for sputtering by keV helium and argon ions are less stringent because of their much greater sputtering yields. This is all discussed quantitatively in Appendix C. The
con-clusion is that the vacuum employed (on the order of l0-9torr) is good enough to prevent decrease of the sputtering yield from 100 keV protons by more than a few percent, as an upper limit.
Initial cleanliness of the targets is obtained by washing them in HN03 and then sputter-cleaning them in vacuo with an argon ion beam.
II. EXPERIMENTAL PROCEDURES A. An Overview
The basic apparatus in which the uranium sputtering was conducted is pictured in Fig. 1, and the important elements are sketched in Fig. 2. The positions of the bands of sputtered uranium as they are collected on the catcher foils are displayed in Fig. 3.
Approximately 40 sputtering runs were made to gather the data for this thesis. The primary steps required for each run are presented here:
(1) A metallic 235u target roughly 1.5 em x 1.0 em x .0025 em is cleaned by dipping it in 35% HN03 for a few minutes.
(2) The target and others like it are mounted on a movable target plate which in turn is mounted on the sputtering assembly (Fig. 6).
(3) A cylinder designed to collimate the sputtered uranium is attached to the assembly (Fig. 7). Clean collector foils (5.0 em x 3.75 em x .005 em) are installed in a cylinder which is attached to a manipulator (Fig. 8) so that a number of sputtering runs may be made each time the assembly is placed in the ultrahigh vacuum (UHV) chamber
(Fig. 9).
(4)
down to
The assembly is placed in the UHV chamber which is then pumped 10-9torr.
(5) The sputtering runs themselves are now made using beams of
+ + + .. r + .
H1, H2 , H3, He or Ar ; the collector fo1ls are moved between runs so that the sputtered uranium is collected in bands (Fig. 3).
(6) The collector foils are removed from the assembly and inter-leaved with mica foils of the same dimensions in a plastic container.
NBS standards containing known quantities of 235
u
are also placed be-tween mica sheets in the container.(7) The container is exposed to a high fluence of neutrons
(typically 1015 -1o16;cm2) in the R-1 nuclear reactor at UCLA to fission some fraction (typically 10-6 to l0- 5 ) of the collected 235
u.
(8) The mica foils are then etched (typically for 15-60 min) in
48% HF to make the fission tracks visible.
(9) The micas are scanned with the aid of a microscope (at 450X
usually) to obtain the raw data.
(10) The track density in the micas next to the NBS standards is
used to compute the neutron fluence which in turn is used in
conjunc-tion with track densities to compute the amount of 235
u
collected atB. Sputtering
In this section I will discuss the relevant aspects of
the sputtering assembly, the ultrahigh vacuum system, the ion source
and associated beam line, beam integration, target prP.paration, and the
actual sputtering.
The Sputtering Assembly
This appears in various stages of assembly in Figs. 4-8. Figure 4
shows the portion of the assembly which remains in the atmosphere. It
consists of an 8" OD UHV flange on which are mounted two precision
manipulators. The left-hand one is a bellows-sealed 6-inch linear
travel feed-through designed by Jon Melvin and constructed in the Kellogg
shop. It is used to position the cylinder carrying the collector foils.
The right-hand one is a VF-172-2 rotating/translating manipulator with
2" travel manufactured by Huntington Mechanical Laboratories. It is
used to position the target plate. The vacuum side of the 8" OD flange
is pictured in Fig. 5. The end of the 6" travel manipulator protrudes
through the hole on the right. Mounted on the end of the other
manipu-lator is a stainless steel block to which the target plate is mounted.
The block is electrically isolated from the manipulator by the boron
nitride piece seen directly below it.
In Fig. 6 the target plate which was used for most of the
sputter-ing runs is shown attached. It was machined from l/8" OFHC copper to
provide a good heat sink for the targets. The targets were mounted by
clamping with pairs of copper bars, two of which are shown in position.
This target plate supplanted one made from l/8" aluminum, on which tl-)e
targets were clamped behind 8 nm holes by single l/8" bars of aluminum. The sputtering assembly is next shown in Fig. 7 with the collima-tion cylinder in place on its insulating glass ring. This stainless steel cylinder has a 3/8" wide slot extending 180° around to limit the collection area on the collector foils for a given run. It also has two pairs of vertical side bars to ensure that the target plate is kept
perpendicular to the beam.
Figures 1 and 8 display the entire sputtering assembly, which has been completed by the addition of the collector-foil holder. This
cylinder (which is also stainless steel) holds the collector foils with
the edges nearest the beam butted against the inwardly-protruding frame
around the vertical slot, and with the outer edges clamped by vertical
bars (see Fig. 2). The collector-foil holder is moved by the 6-inch
travel feed-through to position the foils for different sputtering runs.
The resulting arrangement of bands of sputtered uranium is shown in
Fig. 3.
The Ultrahigh Vacuum System
A photograph of the UHV system appears in Fig. 9 and a sketch of
the important components comprises Fig. 10. All connections between
components are sealed with OFHC copper gaskets. The only materials used
in the system (i.e., stainless steel, copper, aluminum, glass, mica,
and boron nitride) are low vapor pressure materials which may be baked
at high temperature to drive adsorbed gases from the inner walls. Except
in the ion pump's magnets limit its bake-out temperature to 250°C.
Proper cleaning of the components (see Appendix B for cleaning
proce-dures) and baking enable a vacuum of <10-9torr to be routinely
achieved.
The sputtering charri:>er is a 6" ID stainless steel tee, 11" high,
which was manufactured by Ion Equipment Corp. It has three 8" flanges to which the sputtering assembly, a large viewport, and the UHV pump
attach. The pump is a COV-500 by Ion Equipment which is attached
directly below the sputtering assembly for maximum pumping speed in the
vicinity of the targets. It contains both a titanium sublimation
getter-ion pumping assembly and a 25 £/sec differential sputter-ion
pump. The combination is rated at 500 £/sec for N2 at l0-8torr and
6£/sec for argon at the same pressure. When the system is reasonably
clean the pump is capable of bringing the pressure from 10-3torr to
l0-9torr in 12 hours.
The pressure rises to about 4x 10⁻⁹torr when a 1 vA H+ ion beam
is brought into the chamber and to about 2 x 10 -?torr for a 1 vA argon
beam. A vA of beam implies 1 £/sec of particles entering the system at
2 xl0- 7torr and 50 £/sec at 4x 10⁻⁹torr. It is quite likely that most of both the argon and hydrogen diffuse back out of the targets within
seconds and contribute to the gas load. In addition, an unknown
quan-tity of gas is desorbed from the target surface while being bombarded
by the beams and must also be pumped. In the case of argon bombardment
the amount of desorbed gas is likely to be several times the amount of
argon. It appears, therefore, that the observed pressure rises are
-3
The system is roughed to 10 torr by an Ion Equipment Corp. SP-11
molecular sieve sorption pump. The SP-11 consists basically of a fancy
bucket of zeolite which is immersed in a simple dewar of LN2 to promote
adsorption of gases. It is capable of pumping the vacuum system down
from atmospheric pressure to l0- 3torr in less than 30 minutes. When
the SP-11 is not in use it is isolated from the ultrahigh vacuum portion
of the system by an Ion Equipment Corp BVV-152 copper-sealed right-angle
valve.
The UHV system is connected to the rest of the beam line through
a 40-cm-long cold trap with a 1 em ID central beam tube. A Huntington
MS-075 5/8" ID copper-sealed in-line valve serves to isolate the
sput-tering system from the low vacuum (typically 3 xl0-6torr) of the beam
line when beam is not being run. With the cold trap filled with LN 2 and the UHV system pumped down to l0-9torr there is essentially no
'
change in pressure in the sputtering chamber when the MS-075 valve is
opened. Thus, contamination of the system by oil vapor from the
diffu-sion-pumped beam line is virtually eliminated.
Another component of the vacuum system which should be mentioned
is the Faraday cup at the end of the beam line (see Figs. 9 and 10).
This was made by Ion Equipment Corp. and has a very short section of
glass in the middle to electrically isolate the end flange. Checks of
beam integration accuracy in the sputtering chamber can be made by
bringing the beam through to the Faraday cup. In addition, the end
flange normally has a window mounted on it so that the beam spot may be
was very important in this experiment, since the beam optics are such that a wide variety of beam spot shapes and sizes is available at the target plate, and an appropriate spot must be selected for each run. The Ion Beams
Views of the ion source and beam line appear in Figs. ll and 12. Beams of positive ions of hydrogen, helium, argon, and other gases were extracted from the 135 kV duoplasmatron ion source located in the
Kellogg Radiation Laboratory at Caltech. The beams were energy analyzed by a 31° deflection magnet. The beam energy was calibrated by direct measurement of the ion source voltage using a precision resistive divi-der. Beam focusing was provided by a doublet quadrupole magnet which was located between two sets of x-y steering magnets.
Final collimation of the ion beam was provided by a pair of 3 mm apertures in .020" stainless steel disks mounted in the beam tube be-tween the cold trap and the MS-075 in-line valve. The downstream aper-ture was 12 em from the other and 30 em from the target. The beam op-tics were such that the focus position of the beam could be moved a considerable distance to either side of the apertures, hence the
apertures did not completely determine the beam spot, but only limited it to between 3 and 6 mm in diameter. This actually proved useful in this experiment: for sputter-cleaning of the targets a large (6 mm diameter) argon beam spot was used, while a smaller 3-4 mm spot em-ployed during the data runs ensured that the portion of the target being sputtered was well within the sputter-cleaned area. As mentioned
on a piece of quartz glass attached to the target plate.
Beam integration was performed using an Ortec model 439 digitiz-ing current integrator. The target plate, collimation cylinder, and catcher-foil carrier were all connected together and isolated from ground so that an effective Faraday cup was formed. Secondary electrons knocked out of the target by the ion beams could only escape from the sputtering assembly through the 1 cm2 beam entrance aperture, which amounted to <1% of the 2n solid angle available to them. This meant that the beam integration was very insensitive to application of a bias voltage. There was no change in hydrogen beam current at the most sen-sitive level that could be read on the beam current monitor (2%) when a +300V bias was applied to or removed from the sputtering assembly. There was also no change at the level of repeatability for argon beam
current readings (4%) when a +300V bias was applied or removed. In addition, there was no detectable change (< 2%) in hydrogen beam cur-rents when the target plate was moved so that the beam impinged on a uranium target rather than the imaging quartz. There appeared to be an increase in measured beam current of about 5% when an argon beam was moved from quartz to uranium target.
it from the final collimator to the sputtering assembly even without suppression. For argon beams the current reading changed by only 1%
when a magnet was brought close enough to deflect the beam a bit, and for hydrogen beams there was no detectable variation in beam current.
Target Preparation
Basic cleaning of the uranium targets was accomplished by dipping them in 35% HN03 for approximately 5 minutes. The acid bath was fol-lowed by a rinse in distilled water and an acetone bath. Targets which had been stored in atmospheric conditions were covered with a macro-scopic layer of black oxide which presumably is mostly
uo
2. Nitric acid has a much faster attack rate for the oxide than for the metal. Most of the oxide dissolved within two minutes, leaving a semi-shiny silvery surface. Occasionally a few tiny black streaks aligned with the cold-rolling grain of the foils were visible after cleaning.After cleaning, the targets were typically at atmospheric pres-sure for 30-60 minutes before pump-down began, and another few hours was
in this experiment), and the average interatomic distance in uranium is
2.75~.
24 Thus, roughly140~
(50 monolayers) of the target surface was removed from series 2 and 3 targets, and about 400~ (150 monolayers) was removed for series 4-7. That should have been more than enough to ensure removal of all surface oxidation and other contamination. In all cases the appearance of the beam-spot area of the target foils was very s i 1 very after sputter cleaning.Scanning electron micrographs of typical target surfaces appear in Figs. 15-22; they are discussed in Section IliA. In Appendix C
the possibility of some re-oxidation of the foils after sputter cleaning is discussed.
The Sputtering Runs
Figure 3 displays the positions of the catcher foils and their data bands as seen from the position of a target. The foils were 1}" x2" pieces of .005" thick 5052 aluminum for runs in series 1-3 and 1}" x2" pieces of .002" Indian ruby muscovite mica for runs in series 4-7. Mica was substituted for aluminum to take advantage of its lower 235
u
content after it was discovered that mica could be placed in the sputtering chamber without degrading the vacuum. The data bands re-sulted from collimation of sputtered 235u
by the 3/8" wide slot in the collimation cylinder. During presputtering cleaning runs the foils labeled GL and GR were in front of the slot.the sputter-cleaned area. Moving the target plate with the precision Huntington manipulator allowed the accurate positioning of the beam on target.
During all sputtering runs the beam current was kept low enough
(< 3 vA) so that no overheating of the target foils occurred. A trial run with 20 vA of 100 keV H~ on target had produced thermal crinkling of the foil, and a run at 5 vA had produced some discoloration (but no crinkling), but 3
vA
produced no visible effects. Hydrogen ion beam currents were usually 1-2 vA which meant 3-5 hours to accumulate the fluence of 1017 ions in series 1-3 runs and less than 15 minutes to accumulate 5 x 10¹⁵ ions for series 4-7. Due to the much higher sput-tering yield from argon, a typical argon sputsput-tering run was 10 nA of beam for 15 seconds. Helium sputtering was done with 1 vA of beam on target for ~60 seconds.The pressure in the sputtering chamber was always
~l0-
9torr
before any sputtering began. It rose to as much as 5 x 10- 7 during argon beam sputter-cleaning and dropped to 5 x 10⁻⁹ immediately afterward. The pressure was always a few times 10-9 torr during hydrogen sputtering
runs and dropped back down to l0-9torr shortly after completion of the 1 as t run i n a s e ri es .
C. Track Detection
This section will be concerned with the details of the nuclear
track detection technique employed to ascertain the surface density of
sputtered 235
u
on the collector foils. The basis of the technique isthat mica in contact with the collector foils during neutron irradiation
will record a fission-fragment damage track for each 235
u
atom thatfissions. These tracks are later etched in HF to render them visible
under transmitted-light microscopy and are counted to determine the
amount of 235
u
on the collector foils.The Mica
The muscovite mica employed in this experiment is an ideal track
detector for fission fragments for a number of reasons. In the first
place, it has 100% registration efficiency for fission fragments. 11 In addition, it does not register tracks at all for elements with Z < 10,12
which avoids any possible background of tracks from a-particles, protons,
etc. Further, the counting efficiency for the tracks produced by a
sur-face source of fission fragments is virtually 100%. This is due pri-marily to the distinctive shape of the etched tracks (see Fig. 13):
long (15~ full length), thin tubes with diamond-shaped cross sections.
With a moderate etch (> 15 minutes in 48% HF), even tracks seen end-on are unmistakable under the microscope. This distinctive shape makes
possible accurate track counting even in the presence of a substantial
background of random pits, bubbles, cracks and tiny dirt particles. An
away by the etchant at a rate which is completely negligible compared
with the etching rate for tracks, it can be etched for very long times
(order of hours) to make even short fission tracks unmistakable without
erasing tracks having a very low angle to the surface. (See Fleischer,
Price, and Walker, Ch. 2 for a detailed discussion of the etching
process.)
A significant attribute of the high quality Indian ruby mica used
in this experiment is an effective surface density of 235
u
which wasnegligible compared with the amounts collected on the catcher foils.
Th · 1s ow 1 235
u
concen rat1on, com 1ne w1t great sens1 1v1 y or t · b · d · h · t · · t f 235u
through induced fission makes possible measurement of some extremely low
sputtering yields, which is discussed in Appendix A.
Additional advantages of mica are that it suffers little radiation
damage and, quite significantly, no track fading during neutron
irra-diation. 41
The only disadvantage of mica is its susceptibility to neutron
ac-tivation. At a fluence of 1016n/cm2 the resultant activity decays to a
negligible level in a period of a few days, hence it is not a serious
drawback.
Neutron Irradiation
When a group of collector foils was accumulated they were
inter-leaved with 1-1/2" x 2" pieces of muscovite mica and placed in a small
plastic container for transport to UCLA and subsequent neutron
irradia-tion. All pieces of mica had the surface layer on each sirle stripped
contamination. The mica placed up against each foil recorded the
uranium distribution on the foil by registering one of the fission
fragments from each 235
u
that was fissioned. In the cases wheresputtered 235
u
was collected directly on mica foils, two copies ofeach data band resulted.
Neutron irradiations were performed at the R-1 nuclear reactor
at UCLA's Nuclear Energy Laboratory. This reactor produces a peak
flux of 2 x l07n/(cm2-sec-watt) and is therefore capable of delivering
a fluence of lo16n/cm2 in a period of 90 min at its full operating
power of 100 kW. For runs in series 1-3 a fluence of
~
lo
15n/cm
2 was employed, and for series 4-7 the fluence was~lo
16n/cm
2.
The fluences were determined with the aid of NBS glass standards
containing known quantities of 235
u.
These standards are available infour nominal uranium concentrations (500, 50, 1, and 0.07 ppm), the
higher concentrations being appropriate for use with lower neutron
doses and vice-versa. The primary technique employed to ascertain the
neutron fluence ~1as simply to place a standard between two sheets of
mica in the package of catcher foils being irradiated and count the
number of fission tracks per cm2 that were produced in the mica. The
fluence is then calculated from
where Nt = number of tracks per cm2
Nu = effective number of 235
u
atoms 1 cm2 in the standardNu in turn is given by
=
where nu = number density of 235
u
in standardR = average single fission-fragment range in the standard glass
f
and the factor
of~
accounts for the fact that only half the fissioned235
u
atoms within a distance Rf of the surface of the standard glassproduce a fission fragment which leaves the surface (given that the
thickness of the glass is greater than Rf).
The accuracy of this technique depends on two things: 1) careful
counting of all fission tracks produced in the mica, which is difficult
because the actual track lengths are distributed all the way down to
zero due to the fact that the source of the fission fragments is thicker
than Rf' and 2) knowledge of the value of Rf itself. For each reactor
run I personally counted a minimum of 1000 tracks (under direct
micros-copy at 450X) spread over a large area on the micas which \'/ere in
con-tact with the glass standards. I feel confident that the counting
efficiency was at least 95% and that the counting accuracy (involving
resolution of short tracks and discrimination against tiny features which
are not tracks) was about
~5
%
.
It has been reported,41 however, thatdiscrepancies in neutron flux determination due to differences in track
counting criteria may be expected to be as large as 20%.
A range Rf appropriate to the soda-lime glass composing the NBS
relations of Lindhard. 25 •26 The calculation was normalized to the range of n-induced fission tracks in fluorapatite as measured by Bhandari et a1.4 Their measurement of the mean etchable track length yielded a value of 15.3 ±
1~
(2.37 ± 0.15 mg/cm2). The range derivedby Haines for soda-lime glass is 2.24 mg/cm2. Other calculated values (including 2.22 mg/cm2 for pure Si02 and 2.29 mg/cm2 for phlogopite mica) make it clear that the range is not strongly sensitive to the exact atomic composition of such silicates. In addition, the measured etchable range of fission fragments in muscovite mica is very close to
15~.
11It is apparent, therefore, that calculational errors in deriving Rf are smaller than the error quoted by Bhandari, and a value of
2.24
±
0.15 mg/cm2 is thus employed. Combining this error(±
6.5%) with the stated counting error(±
5%) yields an overall uncertainty in the value of the neutron fluence of less than±
10%.As a check on this neutron fluence determination method, the included glass standard wafer from one of the neutron exposures was com-pared with an identical pair of standards which had received prior irradiations in the NBS reactor and been certified by the NBS as to neutron dose. These are sold by the NBS as "calibrated glass standards for fission track use" in the same four uranium concentrations as the non-irradiated standards. The pair of standards used contain
from the reactor core center, and the neutron flux is better
thermal-ized there than in position RT-3. This is indicated by the cadmium
ratios of 10.2 for gold foils and 65 for copper foils at RT-3 and
ratios of 87 for gold foils and 536 for copper foils at position RT-4. 8
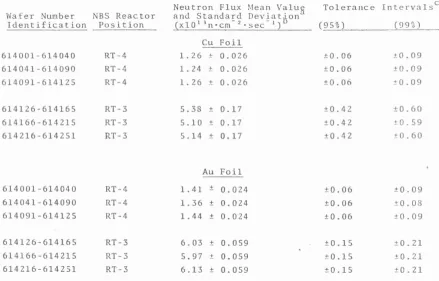
The neutron fluxes measured by the NBS for SRM 963 are shown in Table
1; total neutron fluence is found by multiplying by the exposure times
given in footnote b. The wafer identification numbers for the
stand-ards I used are 614016 for RT-4 and 614141 for RT-3.
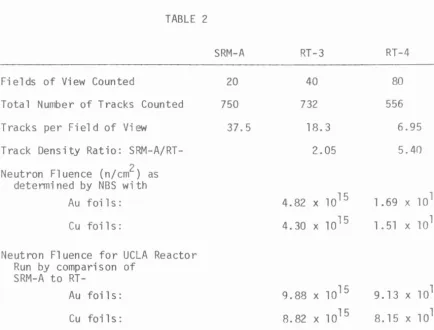
After irradiation of the blank wafer, which I designated SRM-A,
all three wafers were ground, polished, etched, and counted as detailed
in Appendix D. Results are tabulated in Table 2. The neutron fluence
values determined here for the UCLA reactor run are a bit lower than
the value of 1.08 t .10 x lo16n/cm2 found by counting fission tracks in
mica sheets placed against SRM-A during irradiation. However, the
pro-portion of fast neutron flux in the center of the UCLA reactor is
some-what higher than found even in the RT-3 position of the NBS reactor.
This is indicated by a cadmium ratio for 40 mgm/cm2 gold foils (as
measured by Bruce Taylor, private communication) of 3.3 in the UCLA
reactor center as compared with 10.2 for gold foil{ at RT-3 and 87 at
RT-4. The values determined by comparing SRM-A with RT-3 thus actually
underestimate the neutron dose received by SRM-A by a few percent. The
conclusion, therefore, is that agreement between the two methods of
fluence determination is within the error quoted for the primary method
due to counting error and uncertainty in Rf, and no correction is
applied to fluences derived by the primary technique.
Etching
After the neutron irradiation, and after the resultant
radio-activity decayed to a reasonable level, the micas 1~ere etched in 48% HF
at room temperature to render the fission tracks visible. Etching
times of 15 to 60 min were employed; a short etch was used for micas
where it was desired to make star bursts of tracks easy to count, and a
long etch was given to the standards to enhance the visibility of the
many short tracks. The etching action of the HF was stopped after the
desired time by immersing the micas in full strength NH40H for 10-15 min.
This was followed by rinsing for a few hours in running water to remove
all traces of HF.
Results of etching a typical mica detector appear in Fig. 13. The
etching time in this case was 15 min. The magnification is ~lOOOX and
the actual track lengths are close to 15~. This particular photo con-tains a small "star" of about 30 tracks resulting from fissions of 10-6
of the 235
u
atoms in a chunk of approximately 3 x 10⁷ atoms. Figure 14displays a large fission star at the same magnification.
Scanning
Once a mica has been etched, all that remains to extract the raw
data from it is to count the tracks in given areas. Since the tracks are
~15~ in length it is necessary to use a microscope to do this. The
microscopes utilized in this experiment were equipped with precision
x-andy-deflection gauges on the stage to enable given points on the data
bands to be accurately located. They also possessed precision grids in
The areas of the grids were calibrated using a Zeiss objective
microm-eter engraved with a scale 1 mm long markerl off every 10~.
Scanning was often facilitated by viewing the areas to be counted
on a closed-circuit TV attached to one of the microscopes. Track size
and contrast were sufficient that the TV could be employed for routine
work with perfectly adequate results. The resolution was not quite
enough for counting the standards (with many short tracks) or counting
the number of tracks in a given star-burst, and in these cases direct
viewing through the microscope was always used.
A small number of scanners were employed at one time or another
in the tedious counting operation. Their results were checked
fre-quently and found to be consistent and reproducible to within 10%,which
is smaller than the scatter in the data. Generally, a minimum of
400 tracks were counted at each data area, which was typically an area
1 mm high and. 15 mm wide in the long direction of a data band. Each
data area supplied one data point on an angular distribution of
sputter-ing yield curve. Thus the error from counting statistics was ±5%
for the angular distributions. Since the sputtering yield for each
ion-target combination summed over 7 data areas, the statistical error on
III. EXPERIMENTAL RESULTS A. Target Surfaces
Before looking at the results of the sputtering measurement, it would be useful to have an idea of the condition of the surfaces beinq
bombarded. To this end a number of the targets were examined with a small scanning electron microscope (SEM). A series of photographs of a typical target were taken and v-1ill be discussed here.
Figure 15 shows the target at a magnification of 240X. Striations due to cold rolling of the uranium foil are clearly visible. They are also visible at 2400X (Fig. 16). It is seen here that gross surface features on the target are on the order of a few microns in size. The dark pits presumably result from nitric acid dissolution of oxides during the surface-cleaning baths. This same area is seen at 8400X in Fig. 17. Here it becomes evident that the targets are quite rough at the 0. 1~ level, in addition to being lumpy at the 1~ level. This is significant because the projected range of 120 keV protons is on the order of 0. 1~ 40 and the other ions have even shorter ranges. This implies that even though the ion beams always impinged perpendicularly to the target surface, the sputtering yields are actually averaged over a very wide range of incident angles.
also sputter-cleaned in the same fashion is shown in Fig. 20 at the
same magnification. Also at 2400X is another photo of an unsputtered
area of this target {Fig. 21).
A couple of sputtering runs were made on a target which was not
cleaned at all. This target had been stored in a small plastic box
inside a larger plastic box at atmospheric pressure for more than a
year. It was fully oxidized to a depth of about 10~ (as revealed by
thickness measurements before and after washing it in HN03). An SEM
photo of it at 800X appears in Fig. 22.
B. Angular Distributions of Sputtered Atoms
Although the basic Sig~und theory predicts an isotropic
distribu-tion for the sputtered flux, 43 experimentally determined angular
dis-tributions tend to be near cos 8, 2 for perpendicular incidence and 8
measured relative to the beam direction. Results on proton sputtering
of various metals reported by Finfgeld10 include distributions that
are peaked more sharply than cosine. Having seen in the previous
sec-tion that the uranium surfaces bombarded in this experiment are very
rough on the scale of the collision-cascade size, one miqht expect
that the angular distributions would be smeared out considerably from
a cosine form. Such &s the case, as can be seen in Figs. 23-26.
The angular distributions are not quite isotropic, which may well
be due to self-shadowing (i.e., atoms sputtered from a low area of the
target cannot leave the surface at a large angle without impacting
a fit whose accuracy is commensurate with the scatter in the angular
distribution data and with the errors on the individual data points.
Figures 23 and 24 display respectively the best and the worst fits of cos 114
e
to the proton sputtering angular yields. Figure 25 gives atypical fit to the molecular hydrogen results, and Fig. 26 is a typical fit for the helium sputtering case. In all cases cos114
e
was chosen for purposes of calculating total sputtering yields and is not intended to represent any underlying physics. It is possible, of course, that one might be able to show that such a distribution arises naturally,given an intrinsic isotropic distribution and some reasonable model of
a rough surface. In any case it would be interesting to study the angular distribution as a function of surface finish. This would be
difficult for light-ion sputtering of uranium, however, because the
sizes of the collision cascades are so small. 120 keV protons have a projected range in uranium of approximately 1000~ (see Schi~tt 1966),
implying collision cascades of that extent. This implies a surface finish on the order of
100~
would be required for the surface toap-pear planar to the cascade.
C. Total Sputtering Yields
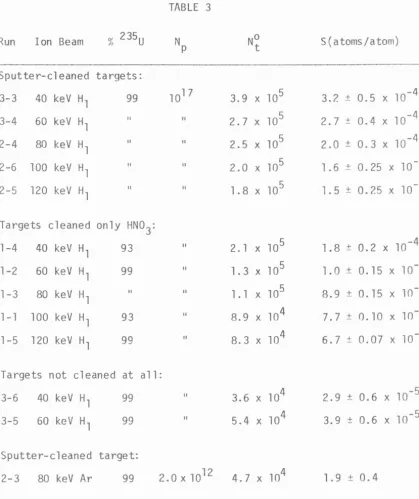
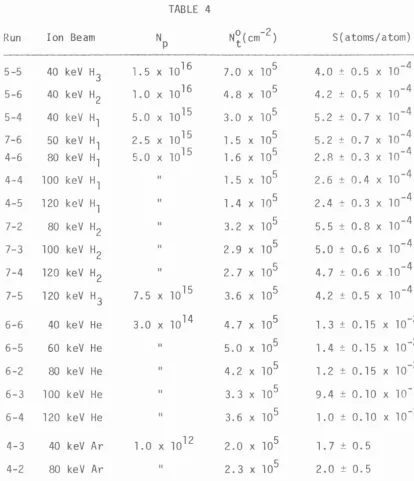
The total sputtering yield results are summarized in Tables 3 and 4 and Figs. 27-29. The yields were calculated with the formula
( 3-1)
N =
p
N =
n
0 =
f
r =
extrapolated to 8 = 0°
number of incident atoms (not ions; e.g., an
H;
ion has3 atoms)
neutron fluence to which the collector foils were exposed
cross section for fission of 235
u
by thermal neutronsdistance from target to catcher foil.
The factor 8n/5 arises from fitting the angular distribution results
by Nt(8)
=
N~cos
11
48,
as discussed in the previous subsection. It may be instructive to observe that this factor would be 2n if an isotropicdistribution was fitted. This would increase the calculated values of
S by 25% if the same values of N~ were employed. If one attempted
in-stead to fit a cos 8curve to the differential yield results, the factor
would ben and the total yields calculated would be reduced by 37.5%
using the same N~ values. To obtain even a rough fit to the angular
distributions with cos 8 it would be necessary to use a substantially
higher N~ value, so the reduction in calculated values of S would be
more like 15%.
Looking now at Fig. 27, three sets of hydrogen sputtering data
can be seen. The upper set of points was obtained by sputtering
tar-gets which had just been sputter-cleaned in vacuo with an 80 keV argon
beam. The total proton fluences in these runs were on the order of
~0 x1o
15. The middle set of points are from bombarding sputter-cleaned targets with 1017 protons. The reduction in yield may be due toaccumu-lation of surface oxides during the runs (3-5 hours here as opposed to
in Appendix C. It may also be that the increased proton dose has
some effect, since strong dose effects have been observed elsewhere.2
The lowest yields were obtained with the same proton dose on targets
which had not been sputter-cleaned. These targets were cleaned in
HN03 immediately prior to placement in the UHV system, but acquired
many monolayers of oxide before being sputtered.
It could be argued that the increased surface roughness of the
sputter-cleaned targets 1-1as responsible for the increased yields.
There are two arguments against that, however. First of all, the
electron micrograph of Fig. 17 demonstrates that all of the targets
are quite rough at the lOOOg level, which is the relevant scale here
because the collision cascades (for the energy and mass-ratio regimes
we are concerned with) are of this extent. Second, the theoretical
prediction is that the sputtering yield will not vary much with
inci-dent angle when M2 >> M1 (see Sigmund 1969, p. 404). It is true,
though, that the theory is not sophisticated enough to handle
large-angle incidence by ions accurately, particularly for light ions on
heavy targets.
To try to get a better idea of the effect of surface oxidation
on the sputtering yield, a pair of runs were made on targets that
were heavily oxidized. An average area of one of them appears in Fig.
22. As discussed in Section IliA, the oxidation extended to a depth
of 10~ or so. Due to the storage conditions it is expected that the
surface consists primarily of
uo
(presented in Table 3) are approximately 10 times lower than those of sputter-cleaned targets also bombarded by 10 17 protons. This sets
an approximate lower limit to the sputtering yield of
uo
2 due topro-tons near 50 keV; if the surface is completely
uo
2 to a depth of ~10~then these numbers are sputtering yields for
uo
2 (assuming thesputter-ing proceeds stoichiometrically). If, however, there are other
materials present, the sputtering yield has been reduced accordingly, since the fission track technique is insensitive to them.
The energy dependence of each of the three sets of hydrogen
sput-tering data follows the trend predicted by the Sigmund theory and
indicated by the curve (see Section IV). Exceptions are the two points at 13 keV and 20 keV which were due to sputtering with 40 keV
H;
and 40 keV H~ respectively. No cause to doubt the validity of these meas-urements was discovered, and the reason for the disagreement with theory is unknown. The other proton yields derived from H~ andH;
bombardment agree well with the H~ yields with equal energies per proton. These results are shown in Fig. 28. They agree with previous results of H~ andH;
sputtering of several metals obtained by Kenkniqht and Wehner (1964), who found that the sputtering yield per proton of a given energy was the s arne for H2 and H3.
Here, too, the magnitudes of the yields are much lower (by a factor of about 10) than predicted by the theory.
A couple of data points for uranium sputtering by argon were
also obtained, as seen in Tables 3 and 4. In this case the theory comes
much closer, being high by only a factor of 3.
D. Chunk Emission
It has been discovered in recent years that sputtered material does
not always emerge as single atoms. There are instances in which some of
the material is ejected as agglomerates of many atoms, commonly referred
to as "chunks".
Chunk emission from niobium during sputtering by 14 MeV neutrons
has been reported by Kaminsky19 and Kaminsky and Das? 1 •22 Biersack,
et al: have studied chunk ejection during neutron irradiation of uo2
utilizing the same mica detection of fission tracks as employed in this
experiment. The technique is particularly appropriate to i nves ti gati on
of chunk emission from materials containing 235u because of the striking
"star-burst" signature left in the mica by a chunk during neutron
irra-diation. Two examples appear in Figs. 13 and 14. The number of fission tracks in more than 1000 such stars was counted to yield the chunk emis-sion data summarized in Tables 5 and 6 and Figs. 30-32. The number of
235u atoms per chunk is obtained by dividing the number of tracks in
the corresponding star by the fraction of 235u atoms fissioned:
8.5xl0- 7 for runs in series 1-3; 8.0xlo-6 for runs in series 4-7.
The mass distribution of chunks emitted during the first five
at 5 x 10⁶ atoms per chunk is due to the fact that smaller chunks
normally produced less than 5 tracks in the mica and could not be
recognized. The distribution displays a long tail, indicated by the
two bars at the right, extending out to 109 atoms per chunk. The
curves represent visual fits to the data of the forms N(n) = a/n2 and
b/n. The former fit represents the histogram fairly well for larger
n but diverges badly from it at small n. The latter fit, on the other
hand, is not as bad for small n but is quite a bit high at larger n.
An exponential actually fits the histogram much better, as seen in
Fig. 31. More data would be required to ascertain whether or not the
exponential adequately represents the tail of the distribution, which
has been omitted from Fig. 31. Fits to the mass distribution will be
discussed further in Section IVC.
The mass distribution of chunks ejected during sputtering by
80 keV argon is shown in Fig. 32. The low number of stars with 5-10
tracks is rather surprising but evidently quite real. No data on
chunks of smaller size is yet available to confirm the existence of
the apparent maximum in the distribution. It is also worth noting
that the distribution is somewhat flatter here than in the H1 case and
the tail is longer--several chunks with a few times 109 atoms were
counted.
This size ( ~109 atoms) is typical of the many chunks of
uo
2 seenby Biersack, et al~ but I do not know what sort of size distribution
their experiment produced. The average chunk of niobium sputtered by
and chunks as small as 107 atoms were seen. The median chunk size seen
here was
~2.5
x 107 atoms, for 80 keV argon sputtering, and~2.0
x 107 atoms for proton sputtering; the mean sizes were 6.6 x 10⁷ atoms and4.3 x 10 7 atoms respectively. These values are of course influenced by the arbitrary cutoff at 5 x 10⁶ atoms/chunk and by the low statistics
for large chunks. Assuming a spherical shape, a chunk containing 5 x 10⁷ 235
u
atoms would be~o.
l~
in diameter.The observed chunk size for protons at reduced dose (5 x 10¹⁵
in-stead of 1017 incident ions per target) was only
~10
6 (see Table 5).The statistics here are very poor, however, since a reduction in dose by a factor of 20 resulted in a reduction in chunk yield by a similar amount. This reduction is probably significant in itself, since it indicates that the chunk emission is not due to release by the first wave of H~ ions of energy stored in the target surface. A great deal more information on dose dependence is necessary before anything definitive can be said.
The observed median size of chunks emitted during helium sputter-ing was ~2 x 10⁶. Here again the He dose was down by an order of + magnitude from what it would have been in conjunction with a neutron
fluence of 1015cm-2 (lo16cm-2 was the neutron fluence for the helium sputtering runs), but the dose effect is unknown.
Looking now at Table 6, it is apparent that the efficacy of chunk
emission correlates roughly with the efficacy of single atom sputter-ing. The He+ sputtering yield is ~so times greater than for H~, and
in chunks comparable to that ejected by He+ (taking into account the
fact that the chunks were smaller in the He+ case). S for argon
sputtering is two orders of magnitude greater than S for helium, and
two orders of magnitude more He+ fluence yielded a number of chunks
comparable to that ejected by argon ions. Since the He+-ejected
chunks were smaller, the amount of uranium ejected as chunks was
con-siderably greater for the argon case. This agrees with the observation
that chunks composed a much greater fraction of the total sputtering
yield forargon ("' 10%) than for hydrogen or helium("' .3% and'V.l%
respectively). This fraction is determined in each case by multiplying
the average chunk size by the observed number of chunks per cm2 and
dividing by the number of 235
u
atoms/cm2 (see Table 6), with theassump-tion that all single tracks represent single atoms. If the size
dis-tribution of chunks does in fact follow an exponential dependence, then
this assumption has very little effect on the calculated fractions (see Section IVC).
Another observation of possible importance is that the amount of
chunk emission under H~ bombardment seems to increase with ion energy,
which is the reverse of the energy dependence of the total sputtering
yield. Here again more data is needed to establish this trend.
Before closing this topic, a few words are in order concerning
possible spurious contributions to the chunk distribution on the micas.
As a test of environmental contamination,a 3 cm2 area on the back of
data band LL2-1 was scanned very carefully at 450X. A total of two
on the front contained >300 stars. This argues strongly against
gen-eral environmental contributions or spurious stars internal to the mica.
Actually, on rare occasions a uranium-rich inclusion near enough to the
mica surface to be etched was encountered. An internal star is readily
told apart from a star due to a surface deposit by focusing the
micro-scope up and down, so none of those were counted.
Scans at low power (25X and lOOX) were made of the relevant micas
to see if any patterns that would suggest contamination could be found.
None were, except for broad bands of stars along the sides of micas in
series 6, (He+ sputtering) where enough uranium had accumulated (during
the sputter-cleaning runs) on the clamping bars to scrape off on the
micas when they were installed. The scanning area for series 6 was
ac-cordingly reduced to avoid the contaminated area by more than l em.
A final argument that spurious stars do not make a large
contribu-tion is that data bands on micas which have been through identical
processes, and even data bands on the same mica, display very different
chunk densities, but which are uniform within each data band.
All things considered, there is undoubtedly some contamination
included in the data, but it is expected to be only a small portion.
E. Error Analysis
The primary sources of error in determination of values for the
yieldS were uncertainty in Nn (the neutron fluence) and error in
deter-mining the track density N~ (see eq. (3-l)).
As discussed in Section IIC the error in Nn was due to counting
and to uncertainty (of ±6.5%) in the established fission-fragment range
Rf. The overall error in Nn is then ±8.5%.
The error inN~ had three sources: l) countinq statistics (±2%)
(see Section IIC); 2) error in fitting the cos 114
e
curve to theangu-lar distribution data due to scatter in the data (varied from ~±5% to
±10%); and 3) background subtraction. The amount of background
sub-traction varied considerably. For most runs in series 4-7 it was zero,
due to collecting the sputtered uranium directly on mica (see Section
IIC). In series l-3 the sputtered uranium was collected on aluminum
which contributed ~30 background tracks per field of view, which had
typically 100-300 tracks total. Uncertainty in the background
deter-mination was ~±10%, which contributed typically ±l% to ±4% to N~.
Another source of background on some data bands was 235
u
atomsbouncing or drifting up onto them during the sputter-cleaning runs.
Although the uranium being sputtered during the cleaning runs was well
collimated, the amount was so great that a small fraction findinq its
way up toLL and LR foils (see Fig. 3) instead of sticking to GLand GR
foils gave rise to a non-negligible background "fog" of tracks on some
of the low-numbered data bands. This background subtraction \'las handled
by scanning vertically across the data bands and plotting the fall-off
of the track density with distance away from the lower edges of LL and
LR micas. In the worst cases the subtraction amounted to 25% and is
responsible for the relatively large error bars on the Ar+ sputtering
The result of the foregoing is that the error in N~ had to be determined individually for each sputtering run. Values were typi-cally ±10%. Once the error on N~ was obtained for a given sputtering run it was added (in quadrature) to the error on Nn to produce the quoted error on the value of S for that run. Quoted errors are typi-cally ±15%.
IV. THEORY AND SPECULATION A. The Collision Cascade Theory
In view of the complexity of the atomic processes involved, it is not surprising that a definitive theory of sputtering has not yet emerged. The collision cascade theory due to Sigmund43 •49 is the most
satisfactory theory to date; it makes definite predictions concerning the important quantities measured in sputtering experiments and has
proved to be quite accurate in many cases. It also serves to bring into focus the primary physical interactions at the atomic level which occur during sputtering. Before examining the quantitative predictions of the Sigmund theory, a brief qualitative look at the sputtering
process is in order.
An impinging ion suffers a series of collisions with target atoms,
creating a number of primary recoil atoms which in turn collide with other target atoms, and so on. This collision cascade continues until none of the recoiling atoms has sufficient energy (on the order of 20 eV) to displace another atom from its position in the lattice. Typically, the cascade proceeds through many steps, and a large number of atoms are set in motion with very low energies. The fact that the cascade
pro-gresses through many generations of recoiling atoms implies that
sputtered. So many atoms are set in motion with very low energies that they account for the bulk of the sputtering yield, even though energetic recoils and backscattered ions account for most of the sputtered energy.42 Experimental energy spectra of sputtered atoms peak strongly at a few eV (see, for example, Thompson 1968). The low energy of most sputtered atoms also implies that they originate within a few
~ngstroms
of the surface.In addition to losing energy via collisions with target atoms ("nuclear stopping") an ion loses energy to the electrons in the target ("electronic stopping"). Due to the enonnous mass difference between atoms and electrons, energy once lost to the system of electrons is never returned to the collision cascade. In calculations of sputtering it is necessary, therefore, to detennine and subtract out this energy loss. For heavy ions on moderate atomic-weight targets, nuclear stop-ping of the ion predominates and electronic stopstop-ping is neglected, but for light ions on heavy targets, electronic stopping is greater and must be taken into account. As a pertinent example, the electronic stopping power for 100 keV protons in uranium is 330 times the nuclear stop pi ng power.