© 2016, IRJET | Impact Factor value: 4.45 | ISO 9001:2008 Certified Journal
| Page 724
SOIL STRUCTURE INTERACTION OF RC FRAME STRUCTURE USING
DYNAMIC ANALYSIS
Suresh G P
1, V S Jagadeesh
2,
1
Post graduate student, Department of civil engineering, SJMIT chitradurga, Karnataka, India
2 Professor, Dept. of civil Engineering, SJMIT College, Karnataka, India---***---Abstract -
During an Earthquake, the response to the seismic structure is really complex because of behavior of soil like non linear. Usually SSI is neglected in the seismic design of structure and assumes that the base is fixed or hinged. For this assumption the dynamic response of the structure is calculated. The SSI effect is neglected in the code based procedure of seismic because of more complexity in the analysis procedure. So in this project suitable4 plan base models are modeled for different types of soil conditions. The corresponding properties are assigned and also loads are assigned. The properties of springs are calculated for different standard penetration test (SPT) values and springs are assigned for footing. The method of static analysis and dynamic analysis are taken out to check the behavior of the structure or building. Then comparing the results with 4 different types of models under various soil conditions in terms of base shear, displacement, storey drift and time period. This analysis gives some very important conclusions about natural period, displacements, base shear and storey drift. In Type I or clayey soil and type III or gravely soil with SSI gives more displacement, time period, storey drift and base shear than a Type I or clayey soil and type III or gravely soil without SSI. Finally this project shows that considering SSI is more important in type I or clayey soil than the type III or gravely soil.Key Words: SSI, Equivalent static analysis, Response
spectrum analysis, Displacement, time period, clayey soil, gravely soil.
1.
INTRODUCTION
Population of India is estimated about 1.30 billion as of may 2016 and India is the second most populous country in the world. Further complexity is lent by the great variation that across this population on social parameters such as income and education. Dynamic program analysis of tall or high rise building with considered all safety factors have a great and big challenge for the civil engineers. Earthquake resistant of structural systems for tall buildings behaving good and better in the all types of soil condition, Especially for soft soil are necessary to be constructed. Wind program analysis is also a plays most important role in the tall buildings. The main aim of the earthquake resistant construction is to build the
structures that expense better during seismic analysis activity than their normal counterparts. For earthquake resistant of structural system design, the effect of local soil conditions & safety calculation is much needed. The linear dynamic program analysis of structure considering a SSI (soil structure interaction) is most essential. Most of design codes have advised that the effect of SSI can reasonably be neglected for the seismic analysis of structures. Maximum civil engineering projects involves some of the structural elements are directly contact with the ground. When the external forces like earthquakes, act on these type of systems, nor this structural displacements or ground displacements, are unconnected or unconstrained each other. The common structural design methods are neglecting the effects of soil structure interaction. So neglecting the soil structure interaction is reasonable only for light weight structures are relatively stiff soil like low rise buildings and rigid retaining walls. The soil structure effects are considered for the tall buildings which are resting on the soft soil. Suppose for example nuclear power plant, tall buildings and elevated high ways on smooth soil.
Breakage or destruction in the recent earthquake such as Kobe earthquake in 1995, have also heighted that seismic analysis behavior of a elements or constituents are greatly influenced not only by the reaction of a super structure but also by the reaction of ground as well as foundation.
Now a day’s seismic analysis design codes such as specifications of standard for concrete structure - make a point that reaction analysis should be considered for over all building which includes super structure foundation as well as ground. When a body is subjected to an earthquake irritation, the structure interacts with foundation as well as soil & thus changes the ground motion.SSI can be broadly into the 2 types i.e. Inertia interaction and kinematic interaction.
1.1
Inertia interaction
© 2016, IRJET | Impact Factor value: 4.45 | ISO 9001:2008 Certified Journal
| Page 725
1.2
Kinematic interaction
Kinematic interaction theory assumes that the super structure and the sub structure (building & foundation) as mass less and the foundation is considered as full rigid. Seismic waves are travel through the soil media and these waves are reaches the rigid foundation surface. After reaching these seismic waves reflect and refract back. Amplitude and frequencies are frequently changes in the seismic wave motion by the rigid foundation motion changes. The vertical horizontal, incoherent ground motions are caused by kinematic interaction.
2.
MODELS AND ANALYSIS
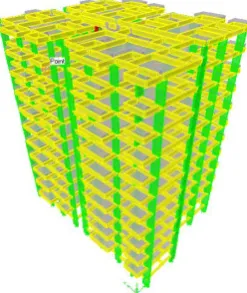
[image:2.595.366.490.362.509.2]The model has been done in ETABS v9.7.4 in scale. ETABS is a sophisticated, very easy to use. Its analysis and design software by computers and system inc. now a day it’s considered as very popular analysis and design software. It can also handle largest and most difficult & complex models. The proposed building is G+ 10 storied an RC frame structure which is located at Bangalore (assuming). The structure is located in earthquake zone II, subjected to equivalent static analysis method and analysis of response spectrum method. The structure is rectangular shape in plan assuming as apartment type structure has G+10 floors.
Table -1: Model Data of RC frame Structure
1 Structure Multi-storey RC frame structure
2 No of Stories 10 (G+10) 3 Storey Height 3 m
Material property
4 Grade of concrete M25, M35 5 Grade of steel Fe 500
Member Properties
6 Thickness of slab 125mm, 150mm 7 Beam Size 230mmx600mm 8 Column Size 230mmx1200mm,
230mmx900mm Load Intensities
9 Live Load 2 KN/ m2 (as per IS 875
part 2) 10 Seismic Zone Zone II
11 Soil Type Type I,III, clayey, gravel 12 Seismic Analysis a) Equivalent Static
b)Response spectrum Method
2.1
Method of Analysis
Equivalent static analysis approach defines a number of forces acting on a structure to indicates the effects of earthquake motion of the ground.equivalent static analysis assumes that ths structure responds in its fundamedal mode. How ever assumption to be true, the structure must be low rise and should not twist significantly when the earth moves. Then this response gives a natural freuency of the structure. The most of the structural code uses the equivalent static method for finding the various displaecements of multistorey structure and yeilding effect is also determined.
Analysis of response spectrum is a linear dynamic statical analysis procedures which measures the contribution from each natural mode of vibration, to indicates the likely dynamic reaction of an essential elastic structure. It is most usefull for decision making design and calculated results are reprentes the max magnitude in all the directions that is X, Y, Z. In this method aslo we can find out the different displaecements, Storey drifts and base shear and also time period of the structure.
Fig -1: 3D view of Building in ETABS
3. RESULTS AND DISCUSIONS
3.1 Equivalent static analysis for clayey soil
[image:2.595.32.541.438.781.2]Displacement
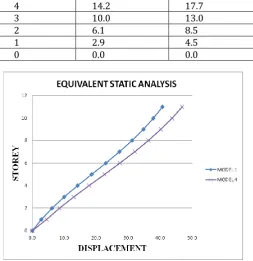
Table -2: displacements values with SSI and without SSI By using equivalent static analysis
© 2016, IRJET | Impact Factor value: 4.45 | ISO 9001:2008 Certified Journal
| Page 726
4 14.2 17.73 10.0 13.0 2 6.1 8.5 1 2.9 4.5 0 0.0 0.0
Chart -1: 1displacement comparison with and without SSI w.r.t type I or clayey soil
Model 1:- without SSI of clayey soil or Type I
Model 4:- with SSI of clayey soil or Type I
Chart -1Tha is displacement of top storey of model 4 is more than the displacement of top storey of model 1. Because relative inter sliding of clay molecules, so SSI has developed 13.03% increases in displacement, when compared to clayey soil without SSI therefore SSI clearly, accurately measures the Displacement.
[image:3.595.266.558.55.239.2]Time period
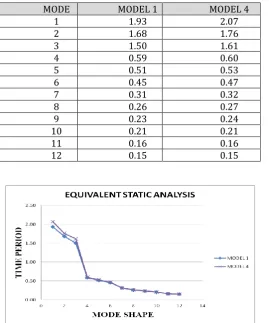
Table -3: time period values with SSI and without SSI By using equivalent static analysis
MODE MODEL 1 MODEL 4
1 1.93 2.07
2 1.68 1.76
3 1.50 1.61
4 0.59 0.60
5 0.51 0.53
6 0.45 0.47
7 0.31 0.32
8 0.26 0.27
9 0.23 0.24
10 0.21 0.21
11 0.16 0.16
12 0.15 0.15
Chart -2: time period comparison with and without SSI w.r.t type I or clayey soil
Model 1:- without SSI of clayey soil or Type I
Model 4:- with SSI of clayey soil or Type I
The time period of model 4 is more than the time period of the model 1.Because the stiffness of the soil increases from soft to hard.
[image:3.595.33.287.100.362.2]3.2 Response spectrum analysis method for
clayey soil
Table -4: displacements values with SSI and without SSI By using response spectrum analysis
STOREY MODEL 1 MODEL 4
11 29.1 34.8
10 27.1 32.5
9 25.0 30.1
8 22.6 27.4
7 20.0 24.4
6 17.2 21.2
5 14.2 17.9
4 11.2 14.3
3 8.1 10.7
2 5.1 7.2
1 2.5 3.9
0 0.0 0.0
Chart -3: 1displacement comparison with and without SSI w.r.t type I or clayey soil
© 2016, IRJET | Impact Factor value: 4.45 | ISO 9001:2008 Certified Journal
| Page 727
Model 4:- with SSI of clayey soil or Type I [image:4.595.293.558.115.496.2]Chart -3: the displacement of top storey of model 4 is more than the displacement of top storey of model 1. Because relative inter sliding of clay molecules, so SSI has developed 16.37% increases in displacement, when compared to clayey soil without SSI therefore SSI clearly, accurately measures the Displacement.
Table -5: time period values with SSI and without SSI By using response spectrum analysis
MODE MODEL 1 MODEL 4
1 1.93 2.07
2 1.68 1.76
3 1.50 1.61
4 0.59 0.60
5 0.51 0.53
6 0.45 0.47
7 0.31 0.32
8 0.26 0.27
9 0.23 0.24
10 0.21 0.21
11 0.16 0.16
12 0.15 0.15
Chart -4: time period comparison with and without SSI w.r.t type I or clayey soil
Model 1:- without SSI of clayey soil or Type I
Model 4:- with SSI of clayey soil or Type I
The time period of model 4 is more than the time period of the model 1.Because the stiffness of the soil increases from soft to hard.
3.3 Equivalent static analysis method for
gravely soil
Displacement
Table -6: displacements values with SSI and without SSI
By using equivalent static analysis
STOREY MODEL 3 MODEL 5
11 68.0 81.7
10 63.2 76.1
9 58.0 70.1
8 52.0 63.4
7 45.4 56.0
6 38.4 48.0
5 31.0 39.7
4 23.6 31.2
3 16.6 23.0
2 10.2 15.2
1 4.8 8.1
0 0.0 0.0
Chart -5: displacement comparison with and without SSI w.r.t type III or gravely soil.
Model 3:- without SSI of gravely soil or Type III Model 5:- with SSI of gravely soil or Type III
Model 3
Model 5
displacement variation in %
68.03
81.7
16.73 %
Chart -5: The displacement of top storey of model 5 is more than the displacement of top storey of model 3. Because there is relative rolling b/w the molecules so SSI has developed 16.73 % increases in Displacement when compared to gravely soil without SST. Therefore SSI clearly, accurately measures the displacement.
[image:4.595.31.301.234.558.2]© 2016, IRJET | Impact Factor value: 4.45 | ISO 9001:2008 Certified Journal
| Page 728
[image:5.595.52.565.46.428.2]Time period
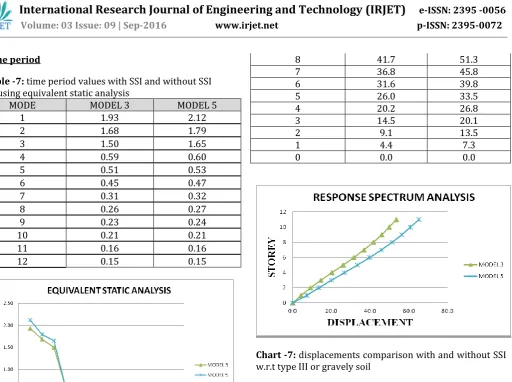
Table -7: time period values with SSI and without SSI By using equivalent static analysis
MODE MODEL 3 MODEL 5
1 1.93 2.12
2 1.68 1.79
3 1.50 1.65
4 0.59 0.60
5 0.51 0.53
6 0.45 0.47
7 0.31 0.32
8 0.26 0.27
9 0.23 0.24
10 0.21 0.21
11 0.16 0.16
12 0.15 0.15
Chart -6: time period comparison with and without SSI w.r.t type III or gravely soil
Model 3:- without SSI of gravely soil or Type III
Model 5:- with SSI of gravely soil or Type III
The time period of model 5 more than the time period of model 3.Because the stiffness of the soil increases from soft to hard.
3.4 Response spectrum analysis method for
gravely soil
[image:5.595.272.548.47.389.2]Displacement
Table -8: displacements values with SSI and without SSI By using equivalent static analysis
STOREY MODEL 3 MODEL 5
11 53.5 65.2
10 49.9 60.8
9 46.0 56.3
8 41.7 51.3
7 36.8 45.8
6 31.6 39.8
5 26.0 33.5
4 20.2 26.8
3 14.5 20.1
2 9.1 13.5
1 4.4 7.3
0 0.0 0.0
Chart -7: displacements comparison with and without SSI w.r.t type III or gravely soil
Model 3:- without SSI of gravely soil or Type III
Model 5:- with SSI of gravely soil or Type III
The displacement of top storey of model 5 is more than the displacement of top storey of model 3. Because there is relative rolling b/w the molecules so SSI has developed 17.94 % increases in Displacement when compared to gravely soil without SST. Therefore SSI clearly, accurately measures the displacement.
[image:5.595.30.296.127.485.2]Time period
Table -9: time period values with SSI and without SSI By using response spectrum analysis
MODE MODEL 3 MODEL 5
1 1.93 2.12
2 1.68 1.79
3 1.50 1.65
4 0.59 0.60
5 0.51 0.53
6 0.45 0.47
7 0.31 0.32
8 0.26 0.27
9 0.23 0.24
© 2016, IRJET | Impact Factor value: 4.45 | ISO 9001:2008 Certified Journal
| Page 729
11 0.16 0.16
12 0.15 0.15
Chart -8: time period comparison with and without SSI w.r.t type III or gravely soil
Model 3:- without SSI of gravely soil or Type III
Model 5:- with SSI of gravely soil or Type III
The time period of model 5 more than the time period of model 3.Because the stiffness of the soil increases from soft to hard.
4. CONCLUSIONS
Dynamic analysis or response spectrum analysis results looks like a practical and this analysis gives lesser values of displacement of the structure and storey drift when compared to the equivalent static analysis method. The results of equivalent static analysis are high, so we can use this analysis for manual calculations
In displacement case, the displacement is more and increases up to 13.03% when considering the effect of SSI under clayey soil condition because of relative inter sliding of the clay molecules so SSI has developed 13.03% when compared to clayey soil without SSI & in gravely soil condition the displacement is more and increases up to 16.73% when considering the effect of SSI because of there is relative rolling b/w the molecules so SSI has developed 16.73%, when compared to gravely soil without SSI. In time period case, in both equivalent static analysis and response spectrum analysis the time period won’t vary much. But the time period is more when considering SSI under clayey and gravely soil condition, because the stiffness of the soil increases from soft to hard.
ACKNOWLEDGEMENT
I wish to express my deep sense of acknowledgement and gratitude to my guide Sri V.S JAGADEESH., M.Tech, Professor, Department of Civil, for the suggestionsFinally, I would like to express my gratitude to
my parents and friends who always stood by me encouraging in all my endeavors.
REFERENCES
[1] AB Boris Jeremi¶c 1 Sashi Kunnath 2 Feng Xiong 3 Influence of SSI on seismic response of the I 1880 via duct February 2004 pn 2-24.
[2] Shiji P.V, Suresh S., Glory Joseph: Effect of Soil Structure Interaction in Seismic Loads of Framed Structures. International Journal of Scientific & Engineering Research Volume 4, Issue 5, May-2013 ISSN 2229-5518. [3] Miss. Anjali B , Dr. Raji. M: “Seismic Analysis and Soil Structure Interaction of Multistoried Building with Different Types of Footing” International Journal of Engineering Research & Technology (IJERT) ISSN: 2278-0181IJERTV4IS090690.
[4] Gaikwad M.V1, Ghogare R.B2, Vageesha S. Mathada3 “finite element analysis of frame with soil structure interaction” IJRET: International Journal of Research in Engineering and Technology.
[5] Shreya Thusoo, Karan Modi, Rajesh Kumar, Hitesh Madahar; “response of buildings with soil-structure interaction with varying soil types” International Journal of Civil, Environmental, Structural, Construction and Architectural Engineering Vol:9, No:4, 2015.
BIOGRAPHIES
Suresh G P
M.tech (structural engineering) SJMIT Chitradurga, Karnataka INDIA.
V S Jagadeesh
M.tech (structural engineering) Professor in SJMIT