Abstract—This paper presents the optimal placement of distributed generation (DG) in a distribution system. The objective functions to be minimize the customer outage cost. The problem is to reliability improvement of distribution system with distributed generations. The technique employed to solve the outage cost by Tabu search algorithm. An application of the Tabu search algorithm to test system for the case study is a radial distribution system with Roy Billinton Test System (RBTS) bus 2. Numerical results from the tests demonstrate that the optimal placement of distributed generators can be used to promote the reliability of the distribution system.
Index Terms—Distributed generation Optimization technique Reliability improvement, Distribution system
I. INTRODUCTION
HE distribution system is an important part that provides the final link between the utility and customers. In practice, most distribution systems have a single-circuit main feeder and are configured radially. The radial distribution system is widely used because of its simple design, generally low cost and supportive protection scheme. This configuration suggests that all components between a load point and the supply point should completely operated and therefore poor reliability can be expected as the failure of any single component causes the load points to be disconnected. An ideal alternative on electric distributions to electric users is the installation of a small sized generator or commonly known as distributed generation (DG) [1].
DG is a small sized generator connected in parallel with the distribution system. DG is expected to play an increasing role in emerging electric power systems. Studies have predicted that DG will be a significant percentage of all new generation going on line. There are several different types of resources and technologies that can be used for DG such as wind, solar, fuel cells, hydrogen, and biomass. DG can result in a network operation and planning practices with economic implications. The benefits of DG are classified into two groups: technical and economics [2]. For example, loss, voltage profile, reliability of supply, maintenance costs, and network connection reinforcement costs can be affected by the connection of DG to the distribution system [3], [4]. Electric utilities, therefore, can benefit from the installation of DG.
Manuscript received January 21, 2016; revised February 27, 2016. N. Rugthaicharoencheep, Member, IAENG, Author is with Department of Electrical Engineering, Faculty of Engineering, Rajamangala University of Technology Phra Nakhon, Bangkok, Thailand (email: [email protected]).
T. Langtharthong. Author is with Department of Electrical Engineering, Faculty of Engineering, Rajamangala University of Technology Phra Nakhon, Bangkok, THAILAND (email: [email protected]).
Distribution system reliability assessment can, in general, be divided into the two basic tasks of assessing past performance and predicting future performance. Predicting reliability performance is usually concerned with the supply adequacy at the customer load points [5]. The conventional approach to teaching distribution system reliability evaluation, in either a university or industry based setting, is to use the basic analytical equations to calculate load point failure rates, average outage durations and average annual outage times.
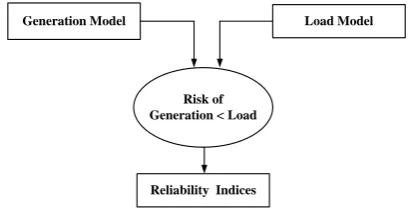
A power system consists of a set of components interconnected in some purposeful way. The object of a reliability study is to derive suitable measures of successful performance on the basis of component failure information and system configuration. For generation reliability studies the components of interest are the generating units and system configuration refers to the specific units scheduled to serve the load. The use of customer damage functions and value of service reliability estimates applies to many investment decisions facing utility planners, regulators, and policy makers. Reliability standards in power systems are traditionally established as a series of technical requirements to be fulfilled during planning and operation. The risk of shortages in generation can be reduced by increasing the investment in generation and the operating cost of keeping installed capacity available. The basic elements used to evaluate generation adequacy are shown in Fig. 1 [6].
Generation Model Load Model
Risk of Generation < Load
[image:1.595.323.528.535.641.2]Reliability Indices
Fig. 1. Elements of generation reliability evaluation
The technique employed to solve the minimization problem is based on a developed Tabu search algorithm and reliability worth analysis. The Tabu algorithm systematically searches solutions expressed in forms of the location and size of DGs. The solution obtained will then be passed to reliability worth analysis to evaluate the quality of the solution. The process is repeated until the best solution has been found. The developed methodology is tested with a distribution system of Roy Billinton Test System (RBTS) bus 2.
Optimal Placement of Distributed Generation to
Minimize the Customer Outage Cost
N. Rugthaicharoencheep,
Member IAENG
and T. Langtharthong
II. TABU SEARCH
Tabu search is a meta-heuristic that guides a local heuristic search strategy to explore the solution space beyond local optimality [7]. The basic idea behind the search is a move from a current solution to its neighborhood by effectively utilizing a memory to provide an efficient search for optimality. The memory is called “Tabu list”, which stores attributes of solutions. In the search process, the solutions are in the Tabu list cannot be a candidate of the next iteration. As a result, it helps inhibit choosing the same solution many times and avoid being trapped into cycling of the solutions [8].
The quality of a move in solution space is assessed by aspiration criteria that provide a mechanism for overriding the Tabu list. Aspiration criteria are analogous to a fitness function of the genetic algorithm and the Bolzman function in the simulated annealing as shown in Fig. 2.
N0 N1 N
2 N
3 N4
N5 N6
N7 N8
N9 Initial Solution
x
0x
1x
2x
3x
4x
5x
6
x
7x
8x
9 [image:2.595.57.303.285.447.2]Local Minima
Fig. 2. Search direction of Tabu search
In the search process, a move to the best solution in the neighborhood, although its quality is worse than the current solution, is allowed. This strategy helps escape from local optimal and explore wider in thesearch space.
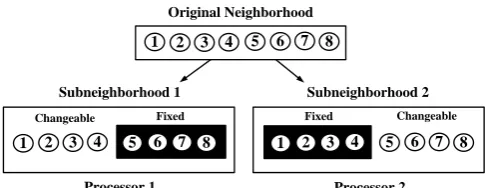
A Tabu list includes recently selected solutions that are forbidden to prevent cycling. If the move is present in the Tabu list, it is accepted only if it has a better aspiration level than the minimal level so far [8]. The main concept of a search direction in Tabu search shows in Fig 3.
Original Neighborhood
Subneighborhood 2 1
Processor 2 Processor 1
Subneighborhood 1
2 3 4 5 6 7 8
5 6 7 8
4 3
1 2
Fixed Changeable
4 3
1 2
Changeable Fixed
[image:2.595.46.289.629.723.2]8 7 6 5
Fig. 3. Search direction of Tabu search
III. DISTRIBUTION SYSTEM RELIABILITY
The basic distribution system reliability indices at a load point are average failure rate λ, average outage duration r, and annual outage duration U. With these three basic load point indices, the following system reliability indices can be calculated [9].
Average interruption frequency index (SAIFI)
= i i
i
N SAIFI
N (1)
System average interruption duration index (SAIDI)
= i i
i
U N SAIDI
N (2)
Customer average interruption duration index (CAIDI)
= i i
i i
U N CAIDI
N (3)
Average service availability index (ASAI)
= 8760
8760
i i i
i
N U N
ASAI
N (4)
Average service unavailability index (ASUI)
=1
8760
i i
i
U N
ASUI ASAI
N (5)
Energy not supplied index (ENS)
= a i( ) i
ENS L U (6)
Average energy not supplied index (AENS)
= a i( ) i
i
L U
AENS
N (7)
Where
i is failure rate of contingency i
i
N is total number of load points i,
i
U is annual outage durationi ( )
a i
L is failure rate of contingencyi
The customer outage cost (ECOST) is calculated from reliability indices of the load point and customer damage function [10], [11].
IV. PROBLEM FORMULATION
The objective is to minimize the customer outage cost that can be written as follows:
1 1 ( )
Minimize h i ( )
n n
h i a i hi h h
ECOST L C r (8)
Where ( )
a i
L is average load connected to load point i
hi
C is outage cost ($/kW) of customer due to contingencyh,
h is failure rate of contingencyh
rh is average outage time of contingency h h
n
is number of contingencies hi
n
is total number of load points i Constraints:
1)Power flow equations:
1
cos( )
B
N
i
k ik i k ik k i
P Y VV (9)
1
sin( )
B
N
i
k ik i k ik k i
Q Y VV (10)
2)Voltage of each bus kmust be within specified limits:
min max
k k k
V V V (11)
3)Current transfer capability of feedersl: max
l l
I I ; l {1,2,...,Nl} (12)
4)Maximum number of DGs (nDG) to be installed:
1
B
N
k jk DG
e n j {1,2,...,NC} (13)
5)Maximum installed capacity of DGs:
1 1
B N
N C
k j j jk
C e G (14)
6)Decision variables for the installation of a DG:
0 if the DG is not installed at bus 1 if the DG is installed at bus
with the capacity at step
jk
k
e k
j
(15)
7)Only one DG can be installed at one position
1
1
NC
j jk
e k {1,2,...,NB} (16)
Where
k
P is power active power is at bus k
k
Q is power reactive power at bus k
B
N is number of buses
ik
Y is element (i,k) in bus admittance matrix
ik is angle of Yik
k is voltage angle at bus k l
N is number of feeders
min
k
V is minimum voltage at busk
max
k
V is maximum voltage at bus k
l
I is current flow in feeder l
max
l
I is maximum current capability of feeder l
B
N is number of buses
C
N is number of capacity steps of a DG
j
C is capacity at stepjof DG
G is maximum total installed capacity
C
N is number of capacity steps of a DG,
j
C is capacity at stepjof DG
jk
e is decision variable for installation of a DG at bus k with the capacity at step j
V. SOLUTION ALGORITHM
The solution algorithm for the problem is described step by step as follows:
Step 1: Randomly select a feasible solution from the search space: S0 Ω. Set the size of a Tabu list, maximum iteration and iteration index m=1.
Step 2: Let the initial solution obtained in step 1 be the current solution and the best solution: Sbest = S0, and Scurrent = S0. Step 3: Perform a power flow analysis to determine whether the
current solution satisfies the constraints defined in (9) and (10). A penalty factor is applied for constraint violation.
Step 4: CalculateECOSTusing (8) with consideration of load point restoration.
Step 5: Calculate the aspiration level of Sbest : fbest = f(Sbest). The aspiration level is the sum of ECOST and a penalty function.
Step 6: Generate a set of solutions in the neighborhood of Scurrent. This set of solutions is designated as Sneighbor.
Step7: Calculate the aspiration level for each member of Sneighbor , and choose the one that has the highest aspiration level, Sneighbor_best.
Step 8: Check whether the attribute of the solution obtained in step 7 is in the Tabu list. If yes, go to step 9, or else Scurrent = Sneighbor_best and go to step 10.
Step 9: Accept Sneighbor_best if has a better aspiration level than fbest and set Scurrent = Sneighbor_best , or else select a next-best solution that is not in the Tabu list to become the current solution.
Step 10: Update the Tabu list and set m = m+1.
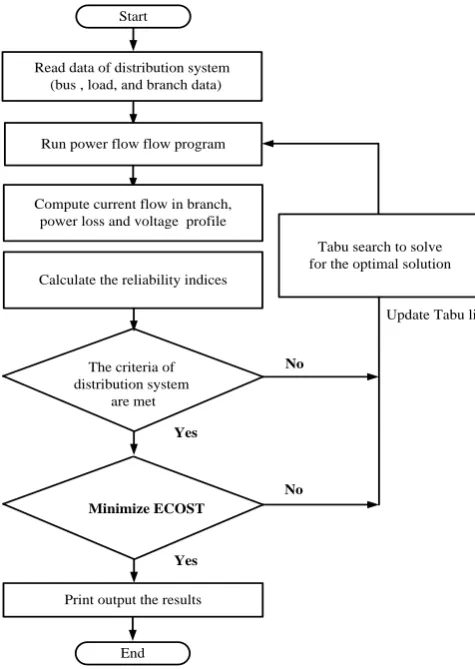
Summing up, the performance of Tabu search depends on a proper choice of the neighbor of a solution, on the number of iterations for which a move is kept as Tabu, on the best combination of short- and long-term memory and on the best balances of intensification and diversification mechanism [12]. The solution algorithm for the problem is described step by step as shown in Fig. 4.
Read data of distribution system (bus , load, and branch data)
Run power flow flow program
Calculate the reliability indices
Print output the results
End Start
The criteria of distribution system
are met
No
Yes
Compute current flow in branch, power loss and voltage profile
Tabu search to solve for the optimal solution
Update Tabu list
Minimize ECOST
Yes
[image:4.595.313.540.48.289.2]No
Fig. 4. Flowchart for solution algorithm
VI. CASE STUDY
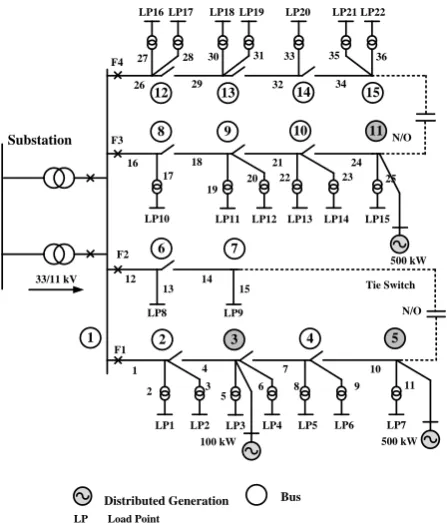
The developed Tabu search algorithm is tested with a distribution system of RBTS bus 2 [12] to minimize the customer outage cost. There are 4 feeders and 22 load points. The peak loading level of bus 2 is 20 MW. The configuration of the system is shown in Fig. 5. The maximum iteration for Tabu search is 100. The minimum and maximum voltages for each bus are 0.95 p.u. and 1.05 p.u., respectively. The sizes of DGs are 100 kW-1,500 kW. The failure of a transformer is recovered by repair. All protective devices and DGs are assumed to be fully reliable. Four cases are investigated in Table I. The results from the case study are shown in Tables II and III.
All the cases have the same SAIFI because this index depends only on the reliability of components (e.g., lines, transformers) and is not affected distributed generations to be installed. We can see that the overall reliability indices of cases 2 to 4 in Table III are improved compared with that of case 1 (base case). In cases 2, 3, and 4 where the number of DGs is limited at 1, 2, 3 and 4 unit respectively, see reductions in the system ECOST.
LP16 LP17
27 28
LP18 LP19
30 31
LP20 LP21
33
32
LP22
36 35
34
N/O 29
21 24
18 26 F4
F3
16
LP10 17
LP11 20
LP12 22
LP13 LP14 23
LP15 25 19
F2
13 12
LP8
F1
N/O 15
14
LP9
7 10
4 1
LP1 3
LP3 6
LP4 8
LP5 LP6 9
LP7 11 5
LP2 2 1
12
2 3 4 5
6 7
8 9 10 11
13 14 15
Distributed Generation Substation
33/11 kV
Bus
LP Load Point
Tie Switch
Fig. 5. RBTS bus 2 radial distribution system
TABLEI
CASE STUDY FOR RELIABILITY ANALYSIS
Case
Maximum number
of DGs, nDG (unit)
Total installed capacity,
G(kW)
1 - -
2 1 ≤ 1000
3 3 ≤ 2000
4 4 ≤ 3500
TABLEII
OPTIMAL PLACEMENT AND SIZING OF DGS
Case Location of DG (bus)
Capacity of DG installed (kW)
Total capacity of DG (kW)
1 - - -
2 5 500 0500
3 3, 5, 11 100, 500, 500 1100
4 5, 10, 12, 15 600, 1200, 200, 1200 3200
TABLEIII
RESULT OF CASE STUDY FOR RELIABILITY INDICES
Reliability indices Cases
1 2 3 4
SAIFI
(interruptions/customer) 0.2482 0.2482 0.2482 0.2482 SAIDI
(hours/customer) 3.7321 3.7290 3.7261 3.7251 CAIDI
(hours/customer interruption) 15.036 15.024 15.012 15.008
ASAI 0.9996 0.9996 0.9996 0.9996
ASUI 0.0004 0.0004 0.0004 0.0004
ENS (kWh/year) 40,775.30 40,509.70 40,256.00 39,443.60 AENS
(kWh/customer/year) 21.37 21.23 21.10 20.67 ECOST ($/year) 49,922.30 47,552.80 45,288.70 43,157.60
ECOST reduction (%) - 4.75 9.28 13.55
[image:4.595.47.285.148.483.2]LP16 LP17
27 28
LP18 LP19
30 31
LP20 LP21
33
32
LP22
36 35
34
N/O 29
21 24
18 26 F4
F3
16
LP10 17
LP11 20
LP12 22
LP13 LP14 23
LP15 25 19
F2
13 12
LP8
F1
N/O 15
14
LP9
7 10
4 1
LP1 3
LP3 6
LP4 8
LP5 LP6 9
LP7 11 5
LP2 2 1
12
2 3 4 5
6 7
8 9 10 11
13 14 15
500 kW 500 kW
Distributed Generation Substation
33/11 kV
Bus
LP Load Point
Tie Switch
[image:5.595.51.275.48.310.2]100 kW
Fig. 6. Distribution system of RBTS bus 2 with distributed generation for case 3
Optimal results of RBTS bus 2 with distributed generation for cases 4 shown in Fig. 7. It is observed that a DG, if its size is large enough, tends to be installed at the end of a feeder.
LP16 LP17
27 28
LP18 LP19
30 31
LP20 LP21
33
32
LP22
36 35
34
N/O 29
21 24
18 26 F4
F3
16
LP10 17
LP11 20
LP12 22
LP13 LP14 23
LP15 25 19
F2
13 12
LP8
F1
N/O 15
14
LP9
7 10
4 1
LP1 3
LP3 6
LP4 8
LP5 LP6 9
LP7 11 5
LP2 2 1
12
2 3 4 5
6 7
8 9 10 11
13 14 15
600 kW 1200 kW
1200 kW 200 kW
Distributed Generation Substation
33/11 kV
Bus
LP Load Point
Tie Switch
Fig. 7. Distribution system of RBTS bus 2 with distributed generation for case 4
VII. CONCLUSION
The search for the best compromise among the objectives is achieved by Tabu searchtechnique for optimal placement and sizing of distributed generation in distribution systems. Employing DG in a distribution system results in several benefits such as increased overall system efficiency. The effectiveness of the proposed method was demonstrated by a case study of a distribution network of RBTS bus 2. Although the distributed generation contributes to loss reduction, some bus voltages violate the minimum voltage constraint. Such a problem can be remedied by network reconfiguration. The results show that the optimal on/off patterns of the switches can be identified which give the minimum power loss whilekeeping bus voltage magnitudes within the acceptable limits.
ACKNOWLEDGMENT
The authors would like to express his gratitude to Rajamangala University of Technology Phra Nakhon, Thailand for support.
REFERENCES
[1] D. T. Wang, L. F. Ochoa, and G. P. Harrison, “DG impact on investment deferral: network planning and security of supply,” IEEE Trans. Power System, vol. 25, no. 2, pp. 1134-1141, May 2010. [2] J. Zhang, H. Cheng, and C. Wang, “Technical and economic impacts
of active management on distribution network,” Electrical Power and Energy Systems, vol. 31, pp. 130-138, 2009.
[3] J. Mutale, “Benefits of active management of distribution networks with distributed generation,” in Proc. Power System Conf. and Exposition. pp. 601 – 606, 2006.
[4] L. F. Ochoa, A. P. Feltrin, and G. P. Harrison, “Evaluating distributed time-varying generation through a multiobjective index,” IEEE Trans. Power Delivery, vol. 23, no. 2, pp. 1132-1138, April 2008.
[5] R. Billinton, and R. N. Allan, “Reliability evaluation of power systems,” pitman advanced publishing program, 1984.
[6] J. F. Prada, “The Value of Reliability in Power Systems - Pricing Operating Reserves,” Massachusetts Institute of Technology, June 1999.
[7] D. Bernaand, and A. Cigdem, “Simulation optimization using tabu search,” in Proc. Winter Simulation Conference, pp. 805-810. 2000. [8] F. Glover, Tabu search-part I. ORSA J. Computing, vol. 1, no. 3.
1989.
[9] M. Hiroyuki, and O. Yoshihiro, “Parallel tabu search for capacitor placement in radial distribution system,” in Proc. Power Engineering Society Winter Meeting, vol. 4, pp. 2334-2339, 2000 .
[10] L. Goel, and R. Billinton, “Procedure for evaluating interrupted energy assessment rates in an overall electric power system,” IEEE Trans. Power Systems, vol. 6, no. 4, pp.1398-1403, 1991.
[image:5.595.49.278.406.648.2]