http://www.scirp.org/journal/ijcns ISSN Online: 1913-3723
ISSN Print: 1913-3715
Spatial Correlation Characteristics Analysis of
Multi-Beam Channels of Mobile Satellite System
Ziming Su, Xiang Fei, Yuxin Cheng, Jianjun Wu*
Institute of Advanced Communications, EECS, Peking University, Beijing, China
Abstract
Due to the influence of scatterers around the receiving antenna, the multipath signal in satellite mobile communication systems is correlated with each other which would influence the system performance. There is no systematic stan-dard on the channel modelling of the wideband satellite channel at present, so the study of the modelling of the wideband satellite channel is of great impor-tance. In this paper, firstly we created a multi-beam model which can figure out the antenna gain of the nth component beam. Secondly, we combined the characteristics of multi-beam satellite channel and the distribution of the scatterers, and set up a three-dimension random channel model. This model is more realistic for satellite communication system since it considers the height of scatterers. According to the channel models, we had the formula of spatial correlation coefficient. We used the formula to calculate the relation-ship between spatial correlation coefficient and the interval of antennas. The result shows that the spatial correlation exists and cannot be ignored while modeling for mobile satellite system.
Keywords
Satellite MIMO, Spatial Correlation, Multi-Beam, Scatterers, Channel Model
1. Introduction
The development of wideband multimedia service has raised demand of speed and spectrum efficiency of a new generation mobile-satellite communication system. In the condition of limitation of power, it is significant to make use of space resource to increase system performance. Under the influence of the dis-tribution of scatterer near the receiver antenna, channel fading has spatial corre-lation in mobile-satellite communication system.
Compatible with LTE standard will be a trend for the new generation of mo-bile-satellite communication system. Because multiple-input multiple-output
How to cite this paper: Su, Z.M., Fei, X., Cheng, Y.X. and Wu J.J. (2017) Spatial Correlation Characteristics Analysis of Mul-ti-Beam Channels of Mobile Satellite Sys-tem. Int. J. Communications, Network and System Sciences, 10, 127-137.
https://doi.org/10.4236/ijcns.2017.105B012 Received: March 20, 2017
(MIMO) is an important part of LTE standard, the research of channel spatial correlation has certain reference value.
Currently, the commonly used classical satellite channel models are Loo mod-el, Lutz modmod-el, Fontan model etc.
In terms of research regarding channel spatial correlation characteristics, a spatial Rayleigh-fading correlation model for MIMO has been proposed in [1]. This model assumes uniform distribution of the scatterers with respect to θ, the angle-of-arrival (AOA) at the subscriber unit. The model also assumes that all received rays are equal in power, which is not a realistic assumption for mul-tipath environments. An extension of this model for Rician-fading channels ap-peared in [2], which assumes von Mises angular distribution for scatterers.
Moreover, Mahmoud developed a geometrical based hyperbolic channel (GBHC) model for macrocells in [3]. A combination of the model in [3] and scalar stochastic fading model for local scatterers was presented in [4]. The GBHC model is a two-dimension model, which assumed that the scatterers are arranged circularly around the mobile station (MS), and the distances between the MS and scatterers are subject statistically to a hyperbolic distribution.
This paper mainly researches spatial correlation of multi-beam channels of mobile satellite system. Different from current spatial correlation research, we create a three-dimension channel model based on stochastic geometric model, which considers the height of scatterers, and deducts spatial correlation coeffi-cient among channels with numeric calculation and analysis.
2. Satellite Channel Model
2.1. Multi-Beam Model
Satellite multiple beam antenna (MBA) began to develop in the 1970s to 1980s. Single Feed per Beam (SFB) technology was adopted in the early stage. Later, multiple feeds per beam (MFB) technology was employed. Compared with phased-array antenna, feed beam of MBA is more narrow, and stronger. So the MBA has been widely used in satellite mobile communication systems in 1990s. According to the structure, MBA can be divided to three categories: phased ar-ray antenna, reflector antenna and lens antenna. In this paper, we use reflector antenna to create multi-beam model.
As is shown in Figure 1, the distance of ground receiver to center of compo-nent beam is different, which makes the signal strength varies.
Figure 2 shows the space relationship among satellite, user u and component beam center n. h is the height of satellite orbit. R is radius of the earth.
According to Figure 2, suppose that θun is the angle of ground receiver u to satellite and component beam center n to satellite, θun can be given by
( ) ( )
(
)
{
}
(
)
(
2 2 2 1)
arccos 2 1 cos n/ 2
un dSn dSu R du R d dSn Su
θ −
= + − − ⋅ (1)
where dSn and dSu are the distance between satellite and component beam center n and user u respectively. n
u
d is the distance between sub-satellite point and
Figure 1. Component beam schematic diagram.
Suppose that Fn( )θ is the normalized far-field radiation pattern of
compo-nent beam, the adoption of different radiation pattern results different antenna gain, when the direction angle is the same. Gn( )θ represents the antenna gain
of the nth component beam. The ( ) n
G θ can be written as
( )
max,n( )
n n
G θ =G F θ (2)
where θ can be calculated by (1), Gmax,n is the maximum gain of the nth com-ponent beam.
2.2. Mobile Satellite Channel Model
In satellite communication, a signal is fading during propagation. Those fading may cause by environment and various attenuation facts, for instance cloud at-tenuation, rain attenuation and ionospheric scintillation. Taking into account this paper research mainly discusses spatial correlation, since attenuation facts like cloud attenuation and ionospheric scintillation are stay the same for a long time, we focus on the influence of ground environment near receiver, namely the multipath which arise from scattering, reflection, refraction or diffraction of the radiated energy off scatterers that lie in the environment.
For satellite communication, typically the height of the ground receiver is lower than nearby scatterers. The received signals in the both horizontal and
Component Beam 1
Component Beam 2
Component Beam 3 Ground
receiver
1 u θ
Figure 2. Three-dimension component beam model.
vertical plane are distributed. While establishing the channel model, we need to consider the height of scatterers, so the traditional two-dimensional geometric channel model no longer applies. Assuming that scatterers are distributed in a right cylinder which has ground receiver as it bottom center, a three-dimension geometry channel model is shown in Figure 3. A large picture of ground receiv-er in the model is shown in Figure 4.
For a downlink of satellite communication system, we assume that p and q are the number of satellite antennas, l and m are the number of ground antennas,
1≤ ≤ ≤p q NT 1≤ ≤ ≤l m NR. Nr and Nr are the maximum number of trans-mitting antenna and receiving antenna. The received signal is given by
( )
( )
( )
( )
y t =x t ∗H t +n t (3)
where, H(t) is channel impulse response, n(t) is noise. ∗ represents
convolu-tion.
The received signal includes direct-path and multipath component in satellite communication system. So the channel impulse response is given by
1
( ) ( ) ( )
1 LoS 1 NLoS
K
H t H t H t
K K
= +
+ + (4)
where HloS(t) is impulse response of direct-path, HNLoS(t) is impulse response of multipath. HloS(t) and HNLoS(t) are both NT × NR matrix. K is Rician Index, which describes ratio of direct-path power and multipath power (unit is dB). The value of K depends on angel of elevation from ground receiver to satellite, carrier fre-quency and environment around receiver. In this paper, since the interval be-tween ground antennas is much small than shadow fading in different states, we
User u
The center of component
beam n
Sub-Satellite
Figure 3. 3-Dimension geometry channel model.
Figure 4. Large picture of ground receiver.
can approximate that received signal shallow fading of two antennas are the same.
In the model shown in Figure 3 and Figure 4, Rm and Rl are the mth and the lth antenna in ground receiver respectively, Tp and Tq are the pth antenna and the qth antenna in satellite respectively. x − y plane is parallel to horizontal surface, and is perpendicular to OOR. OR is the midpoint of two antennas Rm and Rl ground
Sub-Satellite Point
O R
R
p
T
q
T
z
h q p
T θ
, T n α
n
S
m
R αR n, l
R
m
l
R
O RS,max ,max S
H
R θ
x y
n
S
T
O
S
O′
ϕ
R φ ( ) S n
H
S( )n β
S
x
y
z
m
R
l
R
S( )n
β
( ) S n
H
,max S
H
, T n
α
q
p
R
O
R
θ
T
θ
α
R n,n
S
( ) S n
R
,max S
projection line. OS is the point of intersection of x axis and y axis and also the midpoint of x − y plane projection line of two antennas Tp and Tq. OT is the cen-ter of transmitting antenna array. HS,max is the maximum height of scatterers dis-tribution. RS,max is the maximum range of scatterer distribution (the maximum radius). p and q represent projection of Tp and Tq in x − y plane respective-ly. θT is the angle between projection of transmitting antennas array p q and x axis. θR is the angle of receiving antennas array Rm Rl and x axis. φR is the angle of Rm Rl and x − y plane. βT is the angle between segment of receiving antenna arrays and satellite and x-y plane, namely the elevation. dT and dR is the distance of adjacent antenna on satellite and ground respectively. ϕ is the cen-tral angle between sub-satellite point and receiver antenna. To facilitate the analysis, da→b represent distance of a and b. the distance of OS′ and OR is
cos
S R T R
O O O O T
d ′→ =d → β . And the distance of OS′ and OT is sin
S T T R
O O O O T
d ′→ =d → β .
According to the model, the impulse responses of sub channel from Tp to Rl can be written as
( ) LoS( ) NLoS( )
pl pl pl
h t =h t +h t (5)
Since the large number of hypothetical scatterers in the model, let Sn be the nth scatterer. Let RS,max and HS,max represent the radius and height of cylinder in the model, namely, the maximum distance and height of scatterers distribution. RS(n) is the distance between OR and Sn projection in x-y plane, RS(n)∈(0,RS,max].
HS(n) is the height of Sn, HS(n)∈(0,HS,max]. Without considering the height of
ground antennas, the nth scatterer elevation in scattering path can be approx-imately shown as βS n( ) =arctan
(
HS(n)/RS(n))
. αT n, and αR n, respectivelyde-scribe the leaving angle and arriving angle of the nth path, which is influenced by Sn. In the model, αT n, , αR n, , RS(n), HS(n) and βS n( ) are all random variables.
In multi-beam channels of mobile satellite system, the impulse responses of sub channel from Tp to Rl can be written in terms of (5). Considering the influence from component beam on to received signal, the direct-path component of the channel response can be written as
(
)
(
)
2
, ,
( )
1
Tp Rl
j d pl LoS
pl p pl AoD u pl AoA
pl
K
h t e G G
K
π
λ → θ θ
− =
+ (6)
And multipath component of the channel response can be written as
(
) (
)
(
( ) ( ))
, ,n,
2
1
1 ( )
1 (n) Tp S n S n Rl n
p pl AoD u pl AoA
NLoS pl
pl
N j d d
j
n
G G
h t
K N
a e e
π λ
θ θ
→ →
− + Φ
=
= ×
+
∑
(7)
For the large number of scatterers, according to Central Limit Theorem,
( )
LoS pl
h t is a deterministic process. hplNLoS( )t is a complex Gaussian process with a low-pass nonzero mean, and its envelop hNLoSpl ( )t consistent with Rayleigh
distribution.
antenna l deviates from beam center p. Gu
(
θpl AoA,)
is gain of ground antenna l. Generally, ground antenna is omnidirectional antenna, so(
,)
1u pl AoA
G θ = .
In (7), Φn is the nth multipath component random phase. λ is carrier fre-quency. A (n) is the amplitude of multipath component which is influenced by the nth scatterer. Kpl represents sub-channel Rician Index from Tp to Rl,
2 2
| LoS( ) | / E[| NLoS( ) | ]
pl pl pl
K = h t h t .
3. Multi-Beam Spatial Correlation Characteristics
3.1. Definition of Spatial Correlation
In the early stage of channel research, multi-antenna technology will get a huge channel capacity upgrade in the independent and identically distributed (iid) Rayleigh channel [5] [6], under the assumption that the interval between the an-tennas is large enough and the angle of arrival (AOA) angular spread is suffi-ciently large. However, in an actual mobile communication system, the angular spread of the received signal AOA is not large enough under the affection of the interval among antennas and scatterers distribution around. It results that the fading of received signal among different antennas and the signal received among the same antenna from different transmitting antenna are not statistically independent. So the correlation exists. This correlation is called by spatial corre-lation, its definition is written as
*
,
2 * 2
(t) (t)
| (t) | | (t) |
pl qm pl qm
pl qm
E h h
E h E h
ρ =
(8)
where p and q are two transmitting antennas. l and m are two receiving anten-nas. hpl(t) represents channel response of antenna p to l. In the same way, hqm(t) represents channel response of antenna q to m. E[•] is expectation. ρpl,qm is cor-relation coefficient between received signal of antenna l and m.
3.2. Analysis of Multi-Beam Spatial Correlation
Since hNLoSpl ( )t and hqmNLoS( )t are both zero-mean random process
(E h[ plNLoS( )]t =E h[ qmNLoS( )]t =0), hLoSpl ( )t and hqmLoS( )t are deterministic process, (8) can be written as
(
)
(
)
(
)
* ,
*
, ,
, , ( ) ( )
( ) ( )
, , , ,
LoS LoS
pl qm T R pl qm pl qm
NLoS NLoS
pl qm pl qm
LoS NLoS
pl qm T R pl qm T R
d d t h t h t P P
E h t h t P P
d d t d d t
ρ
ρ ρ
= +
= +
(9)
According to the model shown in Figure 3. The spatial correlation coefficient of direct-path component is
(
)
, ,,
2 cos cos cos cos
( ) ( )
, ,
( 1)( 1)
T R
pq T ml R R
T
pl qm p pl AoD q qm AoD LoS
pl qm T R
pl qm pl qm
d d
j
K K G G
d d t
K K P P
e
π θ θ φ
λ β
θ θ ρ
−
−
=
+ +
×
where T T T
(
)
pq pO qO T
d =d −d = q−p d , which is described the distance of
trans-mitting antenna p and q. R R
(
)
R
ml mO lO R
d =d −d = m−l d is the distance of
re-ceiving antenna m and l.
Also, the spatial correlation coefficient of multipath component is
(
)
(
)
(
)
( ) ( ) ( ) ( ) ,, , 2
1 2 1 2 1 2 2 , ,
( ) ( ) 1
| ( ) |
( 1)( 1)
Tp S n S n Rl
Tq S n S n Rm
NLoS pl qm T R
N p pl AoD q qm AoD
n
pl qm pl qm
j d d
j d d
d d t
G G
E a n
K K P P N
e e π λ π λ ρ θ θ ζ ζ ζ ζ → → → → = − + + = × + + = =
∑
(11)Since the large number of scatterers around ground receiver antennas (a larg-er numblarg-er N), RS, HS and αR can replace the discrete variables RS(n), HS(n) and αR,n as an approximation. (11) can change into integral form
(
)
( ) ( ) ( ) ,max ,max , , ,1 2 3 4
0 0
2 cos 2 sin sin
cos cos
1
2 sin cos sin cos arcta
2
( ) ( )
, ,
( 1)( 1)
( ) ( ) ( )
S S
T T T R T S
T T
R R R R
p pl AoD q qm AoD NLoS
pl qm T R
pl qm pl qm
H R
R S S R S S
q p d q p d R
j j
m l d j
G G
d d t
K K P P
f f R f H d dR dH
e e
e π
π
π θ π α θ
λ β λε β
π θ φ α
θ θ ρ
α ζ ζ ζ ζ α
ζ ζ − − − − = + + × = =
∫ ∫ ∫
( ) ( ) ( ) ( ) ( ) n /2 sin sin arctan /
3
2 cos cos cos cos arctan /
4
S S
R R S S
R R R R S S
H R
m l d H R
j
m l d H R
j e e λ π φ λ
π θ φ α
λ ζ ζ − − = = (12)
RS, which is the distance of scatterer and ground receiver, can be described by hyperbolic distribution [4]. The height of scatterer HS, which PDF depends on environment around receiver, is normally described by normal distribution [7], Lon-normal distribution [8] etc. The normal distribution is used for modeling in this paper. In ground wireless communication system, the arrival angle of mul-tipath signal is described by evenly distribution [9] or Laplace distribution. But in mobile satellite communication system, Laplace distribution is more suitable under testing in urban area [10], which is affected by the number and the distri-bution of scatterers around ground receiver.
When the arrival angle of received signal in x-y plane αR is Laplace distribu-tion, the spatial correlation coefficient of multipath component in the received signal is shown as
(
)
,max ,max ,
1 2 3
0 0
, ,
exp( )
S S
NLoS
pl qm T R
H R
R S S
d d t
d dR dH
π
π
ρ
ξ ξ ξ α
−
=
∫ ∫ ∫
(13)[ ]2 ( )
2
2 cos
cos
, ,
1
,max
ln( ) ln( ) 2 sin sin arctan /
2
2 2
3
( ) ( )
( 1)( 1) 2 tanh( )
cosh ( ) sin sin 2 {
cos cos( - ) c
T pq T
T
R
S ml R S S
d j
p pl AoD q qm AoD
pl qm pl qm S
H d H R
j
S S
T
pq R T S
T R
ml R R
G G Qae
K K P P aR
e e
H aR
d R
j
d
π θ
λ β
µ π φ
ς λ
θ θ ξ
σς π
ξ
α θ ξ π
λε β θ α
−
−
=
+ +
=
=
+
0
os cos[arctan( / )] }
2 | |
R S S
R R
H R
φ λ α α
σ − −
(14)
4. Numeric Results and Analysis
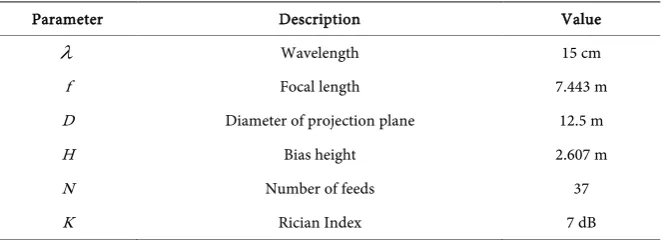
In this part, the channel spatial correlation coefficient of the signal received by ground antennas is obtained by numeric calculation in multi-beam satellite communication system, which adopt parabolic reflector antenna. All the para-meters of simulation are given in Table 1, if not specified otherwise.
The calculation is on the assumption of θp =0.8, θq=1.2, which is the
[image:9.595.251.497.522.700.2]an-gle between component beam p to ground receiver and and carrier frequency is 2 GHz.
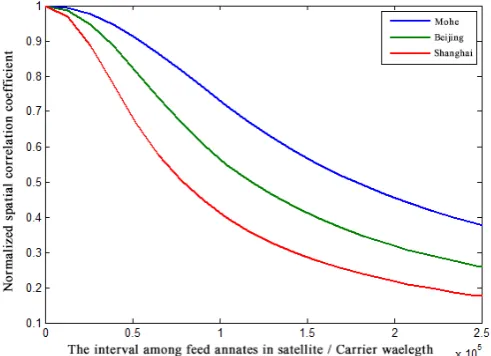
Figure 5 shows that in term of nT = 2, nR = 1, the relationship between ground spatial correlation coefficient among three Chinese cities, namely Mohe, Beijing and Shanghai, and the interval of satellite antennas.
As shown in Figure 5, with the increase of the antenna interval, spatial corre-lation coefficient among satellite channel showed a decreasing trend, and the higher the latitude, the slower decline.
Take Beijing as example, let K = 4 dB, Figure 6 shows the relationship among the interval of satellite antennas, ground antennas, and the spatial correlation
Figure 6. Relationship among the interval of antennas and spatial correlation coefficient. Table 1. Simulation parameter.
Parameter Description Value
λ Wavelength 15 cm
f Focal length 7.443 m
D Diameter of projection plane 12.5 m
H Bias height 2.607 m
N Number of feeds 37
K Rician Index 7 dB
coefficient. With the interval increasing, spatial correlation coefficient showed a decreasing trend, but when the interval is small, the spatial correlation coeffi-cient is still large.
5. Summary/Conclusion
In this paper, considering that the radio transmission feature and the antenna array feature the affection influence the spatial correlation coefficient, we create a 3-demension channel model. According to the model, we derive the spatial correlation coefficient among component beam which received by ground re-ceiver with numeric calculation and analysis. The result shows that spatial cor-relation coefficient is still large even if the interval of antennas is small. Thefore, the spatial correlation coefficient cannot be ignored in satellite channel re-search.
Acknowledgements
This work is supported by the National Natural Science Foundation of China (No.61371073).
References
[image:10.595.208.541.291.411.2]Corre-lation and Its Effect on the Capacity of Multielement Antenna Systems. IEEE Transactions on Communications, 48, 502-513. https://doi.org/10.1109/26.837052
[2] Abdi, A. and Kaveh, M. (2002) A Space-Time Correlation Model for Multielement Antenna Systems in Mobile Fading Channels. IEEE Journal on Selected Areas in Communications, 20, 550-560. https://doi.org/10.1109/49.995514
[3] Seedahmed, S.S., Mahmoud, S., Zahir, Z.M., Hussain, M. and O’Shea, P.P. (2002) Geometrical Model for Mobile Radio Channel with Hyperbolically Distributed Scatterers. Proc. 8th IEEE Int. Conf. Communications Systems, Singapore, Novem-ber 2002.
[4] Mahmoud, S.S., Hussain, Z.M. and O’shea, P. (2002) A Space-Time Model for Mo-bile Radio Channel with Hyperbolically Distributed Scatterers. Antennas and Wire-less Propagation Letters, 1, 211-214.
https://doi.org/10.1109/LAWP.2002.807961
[5] Foschini, G.J. and Gans, M.J. (1998) On Limits of Wireless Communications in a Fading Environment When Using Multiple Antennas. Wireless Personal Commu-nications, 6, 311-335. https://doi.org/10.1023/A:1008889222784
[6] Telatar, E. (1999) Capacity of Multi-Antenna Gaussian Channels. European Trans-actions on Telecommunications, 10, 585-595.
https://doi.org/10.1002/ett.4460100604
[7] Saunders, S. and Evans, B. (1996) Physical Model of Shadowing Probability for Land Mobile Satellite Propagation. Electronics Letters, 32, 1548-1549.
https://doi.org/10.1049/el:19961058
[8] Tzaras, C., Evans, B. and Saunders, S. (1998) Physical-Statistical Analysis of Land Mobile-Satellite Channel. Electronics Letters, 34, 1355-1357.
https:/.doi.org/10.1049/el:19980937
[9] Salz, J. and Winters, J.H. (1994) Effect of Fading Correlation on Adaptive Arrays in Digital Mobile Radio. IEEE Transactions on Vehicular Technology, 43, 1049-1057.
https://doi.org/10.1109/25.330168
[10] Abdi, A., Barger, J.A. and Kaveh, M. (2002)A Parametric Model for the Distribu-tion of the Angle of Arrival and the Associated CorrelaDistribu-tion FuncDistribu-tion and Power Spectrum at the Mobile Station. IEEE Transactions on Vehicular Technology, 51, 425-434. https://doi.org/10.1109/TVT.2002.1002493
Submit or recommend next manuscript to SCIRP and we will provide best service for you:
Accepting pre-submission inquiries through Email, Facebook, LinkedIn, Twitter, etc. A wide selection of journals (inclusive of 9 subjects, more than 200 journals)
Providing 24-hour high-quality service User-friendly online submission system Fair and swift peer-review system
Efficient typesetting and proofreading procedure
Display of the result of downloads and visits, as well as the number of cited articles Maximum dissemination of your research work
Submit your manuscript at: http://papersubmission.scirp.org/