which are the most mature in terms of their evolu-tionary development, although it is widely recognized that column liquid chromatography still lacks a sensi-tive and universal detector for general applications. This void may beRlled by mass spectrometry, which has made great strides in the last few years towards this goal based on particle-beam interfaces and atmo-spheric ionization techniques coupled with the devel-opment of low cost mass separators. By comparison, thin-layer chromatography and supercritical Suid chromatography have become recognized as tech-niques with niche applications and are unlikely to supplant gas and column liquid chromatography as the dominant chromatographic methods used in ana-lytical laboratories. The microcolumn techniques of capillary electrophoresis, micellar electrokinetic chromatography, and capillary electrochromatogra-phy have quickly established themselves as useful laboratory methods and are likely to become of in-creasing importance as they complete their evolution-ary cycle. In particular, the infant capillevolution-ary electro-chromatography has the potential to replace column liquid chromatography from many of its traditional separation roles, but has yet to reach a state of devel-opment to be considered as a routine laboratory tech-nique.
The only thing that is certain about science is un-certainty. Although chromatographic methods are likely to dominate separation science for theRrst part of the twenty-Rrst century, it would be a foolish person who predicts their form, continuing develop-ment, and main applications. Throughout the history of chromatography general approaches have had to adapt to changing needs brought about by dramatic shifts in the focus on different types of applications, and this has a signiRcant impact on the relative im-portance of the various techniques. However, chromatography should be considered as an holistic
approach to separations, and will be better under-stood and correctly employed if we abandon the current trend to compartmentalize the technique based on specialization in individual subject areas.
See Colour Plate 3.
Further Reading
Berger TA (1995) Packed Column Supercritical Fluid
Chromatography. Cambridge: Royal Society of Chem-istry.
Braithwaite A and Smith FJ (1996) Chromatographic
Methods. London: Blackie Academic&Professional. Giddings JC (1991)UniTed Separation Science. New York:
Wiley-Interscience.
Guiochon G and Guilleman CL (1988)Quantitative Gas
Chromatography for Laboratory Analysis and On-Line Process Control. Amsterdam: Elsevier.
Guiochon G, Shirazi SG and Katti AM (1994)
Funda-mentals of Preparative and Nonlinear Chromatography. Boston: Academic Press.
Heftmann E (1992)Chromatography, Parts A and B. Am-sterdam: Elsevier.
Jennings W, Mittlefehldt E and Stremple P (1997)
Analytical Gas Chromatography. San Diego: Academic Press.
Lee ML, Yang FJ and Bartle KD (1984)Open Tubular
Column Gas Chromatography. Theory and Practice. New York: Wiley-Interscience.
Li SFY (1992)Capillary Electrophoresis.Principles, Prac-tice and Applications. Amsterdam: Elsevier.
Poole CF and Poole SK (1991) Chromatography Today.
Amsterdam: Elsevier.
Robards K, Haddad PR and Jackson PE (1994)Principles and Practice of Modern Chromatographic Methods. London: Academic Press.
Sherma J and Fried B (1997) Handbook of Thin-Layer
Chromatography. New York: Marcell Dekker. Snyder LR, Kirkland JJ and Glajch JL (1997) Practical
HPLC Method Development. New York: J Wiley.
CRYSTALLIZATION
H. J. M. Kramer and G. M. van Rosmalen,
Delft University of Technology, Delft, The Netherlands
Copyright^ 2000 Academic Press
Introduction
Crystallization from solution is a separation tech-nique where a solid phase is separated from a mother liquor. In contrast to other separation processes,
separated from the mother liquor, additional de-mands on Rlterability and washability can be for-mulated.
Because of the mostly rigid structure of the solid phase, the formation of solid particles is a rather slow process, and to reach an acceptable production rate large vessels are generally needed. This rigid structure on the other hand impedes the incorporation of foreign substances or solvent molecules, and in only one separation step a pure solid product is obtained. Crystallization is often used as a generic term for evaporative or cooling crystallization, precipitation and melt crystallization. There are, however, con-siderable differences between the three types of crystallization as far as the processing method and the corresponding equipment are concerned. In precipita-tion the drop-out of the solid phase is achieved by mixing two feed streams that are either two reactants or a solvent containing the solute and an antisolvent. The hydrodynamics of the process therefore play a predominant role in precipitation with regard to the properties of the obtained product.
In melt crystallization the potential of crystalliza-tion to produce a pure product is mainly utilized, and the solid phase is remolten to obtain theRnal product. The applications are mainly in the ultrapuriRcation of organic compounds or to produce pure water as a concentration technique.
An upcoming technique in crystallization is super-critical crystallization, mostly with condensed CO2,
because of its benign properties compared to organic solvents. Condensed CO2can be used either as a
sol-vent or as an antisolsol-vent, and speciRcally adapted processes and equipment have been developed for these high pressure crystallization techniques.
Also the crystallization of proteins requires its own dedicated approach, because large, sometimes easily degradable molecules require carefully designed processes.
Because 70% of the products sold by the process industry and the pharmaceutical industry }as bulk products, intermediates,Rne chemicals, biochemicals, food additives and pharmaceutical products } are solids, crystallization in its widest deRnition is the largest separation process after distillation.
Although this chapter will primarily focus on evap-orative and cooling crystallization, the energy, mass and population balances treated here as well as the kinetic rate expressions for the physical processes such as nucleation, growth and agglomeration and the characterization of the particles can equally be applied to the other types of crystallization.
Several books on the diverse aspects of crystalliza-tion have been published over the last 10 years. These books that can be recommended for a wide overview
in thisReld contain an abundance of references. The authors of these books are Mersmann (1995), Mullin (1993), Randolph and Larsen (1987), Myerson (1993), NyHvlt (1992), Tavare (1995) and Hurle (1993). SoKhnel and Garside (1992) have written a book on precipitation and Arkenbout (1995) a book on melt crystallization.
This article reviews industrial evaporation and cooling crystallization processes. A basic modelling approach is presented which enables the analysis and design of industrial crystallization processes, either by analytical calculations or by making use of modern computational tools.
Crystallization Methods and
Supersaturation
Crystallization only occurs when supersaturation is created that acts as the driving force for crystalliza-tion. The crystallization method is mainly chosen on the basis of the thermodynamic and physical proper-ties of the compound and the solvent, as well as on the required purity of the product. There are several ways to represent the phase diagram, depending on the mode of crystallization. For evaporative and cooling crystallization a solubility diagram is mostly used, in which the solubility of the compound is expressed as a function of temperature. In precipita-tion the solubility is always very low, and the solubil-ity product at the operating temperature is needed. In antisolvent precipitation, the solubility diagram mostly has to be determined for the particular three-phase system. In melt cooling crystallizationT-x dia-grams are used, while for melt pressure crystallization pT-xdiagrams are needed.
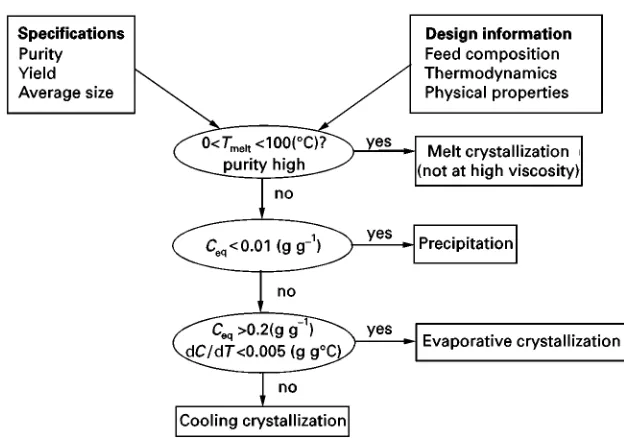
A decision scheme for the selection of the appropri-ate crystallization method is presented in Figure 1. For a high purity product or when the use of a sol-vent poses environmental or safety problems, melt crystallization is chosen. A melt temperature lying between 0 and 1003C is preferred, since at higher temperatures many organic compounds become un-stable, while at temperatures below 03C operating the process becomes more difRcult, although not im-possible. A high viscosity of the melt hampers the operation.
At solubilities below about 1 mass %, the process is designed as a precipitation process to obtain a reason-able production rate. The supersaturation that is gen-erated by the mixing of reactants often reaches high values. Also in antisolvent crystallization, low solu-bility of the solute and high supersaturation are reached by mixing two solvents.
Figure 1 Decision diagram for choosing the method of crystallization.
is made on the basis of the solubility curve, and the prevailing supersaturations are generally low. Espe-cially where water is the solvent, cooling tion is more favourable than evaporative crystalliza-tion, except for highly soluble substances. Therefore, multi-effect Sash evaporation where the vapour is used for heating next crystallizer or the feed stream is frequently applied to reduce the energy costs, if evaporative crystallization is applied.
In cooling crystallization direct cooling,Sash cool-ing or indirect coolcool-ing can be applied. Where indirect cooling is used encrustation on the cooling surfaces must be minimized. In Sash cooling this problem is largely avoided at the expense of a more complicated installation. Also direct cooling uses an inert cooling medium or refrigerant that is bubbled directly into the solution and evaporates does not suffer from abundant incrustation, but needs recompression of the cooling medium.
So, in these various methods of crystallization, supersaturation is created by cooling, by evaporation of solvent or by a combination of the two in the case of Sash evaporation or Sash cooling, or by mixing two reactants or solvents. In all these cases the actual concentration is higher than the equilibrium concen-tration, and a driving force for crystallization is achieved.
From a thermodynamic point of view this driving force is reSected by the difference in chemical potential of the solute in the liquid and in the solid phase at temperatureT:
"L(T)!S(T) [1]
For cooling crystallization from the melt or the solu-tion, eqn [1] can be transformed into:
"Heq
TH ) T [2]
For melt pressure crystallization:
"VmolarP"
meltsolid
) P [3]
For practical reasons the supersaturation in cooling is mostly indicated by:
T"T!TH [4]
and can also be translated via the solubility curve into a concentration difference:
c"c!cH [5]
Other frequently used expressions are the dimension-less saturation ratio:
S"c
cH [6]
or the relative supersaturation:
Hereccan be expressed by kg solute per kg or m3of
the solvent or solution, but an expression in kg solute per m3 solution ("liquid) phase is generally used in
mass balances ("mass fraction,w).
For evaporative crystallization, eqn [1] can be transformed into:
"RTln
aaeq
"RTln
ceqcH
[8]
Given the relatively low supersaturations, , that often lie between 0.001 and 0.01 with more easily soluble substances, eqn [8] simpliRes into:
"RTc
cH"RT [9]
For two or more A and B ions in solution that react to form crystalc, the expression for becomes:
"RTlnia
vi
i Ksp
[10]
and for stoichiometric solutions equals:
"RTvlnS+RT [11]
In practice the supersaturation is often indicated by eqn [5].
ForSash cooling or evaporation two terms contri-bute to the driving force (Tandc).
For precipitation, no simpliRcations are allowed, owing to the high supersaturation values (1), and either eqn [8] or eqn [10] is used. For antisolvent precipitation the value of c depends on the actual concentration of the solute in the original solvent and, like cH, on the degree of dilution by the anti-solvent.
Mass and Heat Balances
Traditional design of an industrial crystallizer is based on only mass and enthalpy balances. The pro-duction rate determines to a large extent the dimen-sions of the crystallizer as well as the energy con-sumption. It also determines the mode of operation, which means batchwise or continuous, single or multistage operation. In the next section the balance equations are given for an evaporative and for a cool-ing crystallizer.
Evaporative Crystallizers
Consider an ideally mixed vessel. The composition of the product stream is kept similar to that of the
content of the crystallizer. The volume, V, of the crystallizer is often assumed to be constant in eqns [12}19], However, by makingV and the feed streams time-dependent, dynamic effects can be taken into account, and thus also batch processes. The mass balance is given by:
dMtotal
dt "v,feed(feedfeed,liquid#(1!feed)crystal)
!v,prod(liquid#(1!)crys)!v,vapourvapour
[12] The component balances are given by:
dMi
dt "v,feed
feedfeed,liquidwfeed,liquid,i
#(1!feed)crystalwfeed,crystal,i
!v,prod(liquidwliquid,i#(1!)crystalwcrystal,i)
(i"1, Ncomp) [13]
with:
Mi"V(liquidwliquid,i#(1!)crystalwcrystal,i) [14]
where componenti"1 is the main compound to be crystallized, and components i"2, 3,2Ncomp are
the impurities present.
The distribution coefRcients relate the impurity uptake by the solid and the concentration of the impurity in the liquid phase:
kdistr,i" wcrystal,i
wliquid,i
(i"2,2Ncomp) [15]
Instead of substituting all component balances into the total mass balance given by eqn [12] to solve the mass balance of the total system, it is more conve-nient to combine the solvent mass balance together with the component balances:
dVliquidwliquid,solvent
dt "v,feed(feedfeed,liquidwfeed,solvent)
!v,prod(liquidwliquid,solvent)
!v,vapourvapour [16]
Finally, the sum of the mass fractions in both the liquid and the solid phase must equal one:
wliquid,solvent# i
wliquid,i"1 [17]
i
The enthalpy balance with the production rate or solids production,P, is given by:
dH
dt"H,feed!H,prod!H,vapour#Qheat#PHcr
[19] The total enthalpy and the enthalpy of the streams are deRned as:
H"V(liquidCp,liquid#(1!)crystalCp,crystal)T
H,feed"v,feed(feedfeed,liquidCp,liquid
#(1!feed)crystalCp,crystal)Tfeed H,prod"v,prod(liquidCp,liquid#(1!)crystalCp,crystal)T
H,vapour"v,vapour(vapourCp,vapourT#vapourHevap)
[20] The crystal free volume fractionshould be as low as possible to reduce the crystallizer volume.
The liquid mass fractionwliquid,1 of the main
com-ponent must be determined or can be approximated by the saturation concentration, especially for soluble compounds with a lowvalue.
With the production rate,P, as a design parameter, the volumetric productSow rate can be deduced for the chosenvalue from:
P"v,prod(1!)crystal"v,prodMT [21]
From the productSow rate so obtained and the mean residence time that is needed to grow sufRciently large crystals, the necessary suspension volume for the crystallizer can be calculated from:
v,prod" V
[22]
" Lmean
4Gmean
[23] Here, for the desired Lmean, a reasonable value must
be chosen, that is related to its solubility and the mean growth rate,Gmean, can be estimated from a
correla-tion (Mersmann, 1988; Kind and Mersmann 1990) or determined by laboratory experiments.
From the crystallizer suspension volume, V, the needed vapour head, the process streams and the heat duty that has to be accommodated, the crystallizer dimensions can now be determined. Constraints for the design are a height/diameter ratio of about 3 : 2, and a cross-sectional area for evaporation that is large enough to avoid entrainment of liquid droplets
into the condensor. For the design of the heat ex-changer see Sinnott (1998).
Cooling Crystallizers
In cooling crystallization the warm feed stream is cooled to the process temperature. In principle the same set of mass and heat balance equations can be used, except that no vapourSow exists. Furthermore, the process temperature cannot freely be chosen, be-cause it is determined for a given production rate, crystal free fraction, , residence time, and liquid mass fraction,wliquid,1. This latter liquid mass fraction
of the main component will depend on the process temperature, so a temperature-dependent equation forwliquid,1must be added. The degrees of freedom for
the crystallizer design are therefore more limited.
The Population Balance
The Crystal Length-based Population Balance Equation
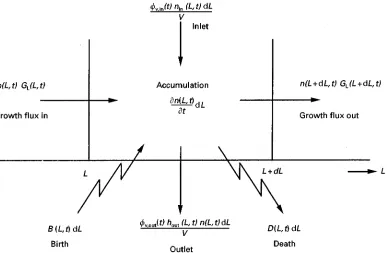
In crystallization as a separation process, the separ-ability of the particles from the mother liquor by, for example,Rltration are of utmost importance, as well as their washability and drying. The efRciency of these processes is directly related to the crystal size distribution (CSD) of the solid, and as soon as the CSD of the solid phase becomes an interesting prod-uct speciRcation, the population balance equation (PBE) must be introduced. The PBE describes how the size distribution develops in time as a result of various kinetic processes. The concept of the PBE was intro-duced to crystallization by Randolph. A general form of the PBE is as follows:
(n(L)V)
t "!V
(GL(L)n(L))
L #B(L)V!D(L)V
#m
j"1
v,in,jnin,j(L)! n k"1
v,out,khout,k(L)n(L)
[24] where the amount and the size of the crystals (or particles) are expressed in terms of number density n(L) (C/(m3m)) and crystal (or particle) lengthL(m)
respectively (Figure 2A).
All the variables in this equation are in principle also time-dependent. For the sake of simplicity, the tdependence is omitted here.
In other representations of the PBE, the amount of particles may also be expressed in terms of volume density v(L) (m3/(m3m1)) or mass density m(L)
Figure 2 (A) Number and (B) mass distribution of a crystal population.
Figure 3 Schematic depiction of the processes affecting the CSD. In an infinitesimally small size range fromL to L#dL, crystals may enter and leave due to growth, aggregation, attrition, breakage and volumetric input and output flow streams.
lengthL(Figure 2B). Figure 2 also shows two often-used values which characterize the crystal size distri-bution, the mean crystal size and the volume-based median size (the size at which the integral over the m(L) curve from zero toL50equals half of the integral
over the entire curve).
For particle sizes given in terms of volume, the corresponding number density becomesn(v) instead ofn(L). The latter representation becomes more con-venient if agglomeration of crystals plays an impor-tant role.
In eqn [24]Vis the suspension volume in the cry-stallizer withmstreams entering andnstreams leav-ing the crystallizer with volumetricSow ratesv.
GL(L) is the linear size-dependent growth rate
(m s\1), andB(L) andD(L) are birth and death terms
respectively (Cm\3m\1). Birth and depth events can
be caused by agglomeration and disruption of earlier agglomerated particles, but also by breakage of crys-tals and by the birth of small cryscrys-tals, called nuclei. Breakage of crystals will not happen under normal operating conditions.
The classiRcation functionh(L) describes the rela-tion between the CSD in the crystallizer and that on an outlet stream.
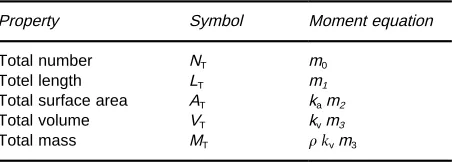
[image:6.568.81.468.432.685.2]Table 1 Physical properties of the moments of the distribution Property Symbol Moment equation Total number NT m0
Totel length LT m1
Total surface area AT kam2
Total volume VT kvm3
Total mass MT kvm3
As the PBE is a partial differential equation with respect to time t and crystal length L, two boundary conditions are needed to solve it analyti-cally:
n(0,t)" B0
GL(0)
[25]
n(L, 0)"initial distribution [26]
As primary and secondary nucleation typically in-volve the birth of small crystals, nucleation is often presented as the birth of nuclei at zero size. Instead of a birth term in the PBE for the nucleation eventB(L) that happens over a size range 0414y, the birth rateB0given by the boundary eqn [25] is used. These
two are related by:
B0"
y
0
B(L) dL [27]
For the second boundary condition, a seed population or a population formed by the outgrowth of primary nuclei can be substituted.
Population Balance Equation for Stationary Operation
For continuous crystallization the PBE can be simpli-Red by assuming that:
1. a steady state is reached
2. there is one crystal-free inlet stream
3. nucleation only occurs at zero size and is given by the boundary condition atL"0 (eqn [25]) 4. growth is size-independent,GL(L)"GL
5. the crystallizer volume is constant int 6. there is no agglomeration or breakage
This results in:
VGL n(L)
L #
n k"1
v,out,khout,k(L)n(L)"0 [28]
If the crystallizer content is also well mixed, and there is only one nonclassiRed outSow, i.e.h(L)"1, this equation becomes:
VGL n(L)
L #v,outn(L)"0 [29] Such a crystallizer is named a mixed suspension mixed product removal (MSMPR) crystallizer.
Integration of eqn [29] leads to:
n(L)"n(0) exp
! LGL
[30] By plotting ln(n(L)) versus L, the kinetic growth rateGLcan be derived from the slope of the straight
line, and the nucleation rate B0 from the intercept
with theyaxis.
The number of process parameters that can be varied for a speciRc crystallizer in order to shift the CSD and in particular the mean crystal size is usually very limited. Typical process actuators are Rnes re-moval and product classiRcation. Their inSuence on the CSD can be analytically solved by introducing more classiRed outSow streams, which cause dif-ferent residence times for the mother liquor and the Rne, medium and large crystals in the crystallizer. A generic numeric solution is achieved more easily, as will be addressed later.
Moment Equations for Stationary and In-Stationary Operation
Analytical solutions of the PBE for in-stationary cry-stallizers hardly exist. By transforming the PBE into a moment form, however, analytical solutions are attained that allow us to describe the dynamical be-haviour of crystallizers in terms of the moments of the distribution. The moments are deRned as:
mj"
0
n(x)xjdx [31] and theRrstRve moments are related to measurable physical properties of the distribution, as shown in Table 1. The shape factorskaandkvrelate the crystal
length to its surface area and volume respectively. For a continuously operated system with a constant V, a size-independent growth rate, no agglomeration, nucleation at zero size, one crystal-free inlet stream, and a nonclassiRed product stream, the PBE present-ed in eqn [24] transforms into:
n(L)
t "!GL
n(L)
L !
n(L)
with similar boundary conditions. This equation can be reduced to a set of ordinary differential equations by means of the moment transformation:
dmj
dt"jGLmj\1!
mj
#B0Lj0 [33]
whereL0, the size of the nuclei, is here zero. Only the Rrst four moment equations (j"0}3) have to be solved to obtain all the information about the lumped properties of the CSD.
Population Balance Equation for Batch Operation
For batch operation, the PBE (eqn [24]) can be sim-pliRed by assuming that:
1. the inlet stream is crystal-free
2. nucleation only occurs at zero size, and is reSected by the boundary condition atL"0 (eqn [25]) 3. growth is size-independent
4. there is no agglomeration or disruption This results in:
n(L)V
t "!VGL
n(L)
L [34]
Since batch operation is inherently ‘in-stationary’, a moment transformation is needed to obtain analyti-cal solutions to the PBE. This leads to
dd(Vmj)
dt "jGLmj\1V#B0L
j
0V [35]
where the size of the nuclei,L0, is zero. Again
ordi-nary differential equations (j"0}3) have to be solved to attain the lumped properties of the CSD.
To improve the CSD, a controlled cooling or evap-oration trajectory can be imposed.
The Crystal Volume-Based Population Balance Equation
When a crystallizing system depends purely on nu-cleation and growth processes, it is favourable to use a PBE with length as the crystal size co-ordinate. For kinetic processes where the volume of particles are combined or split up, like in agglomeration and dis-ruption, a PBE with the particle volume as crystal size coordinate is preferred. This leads to:
(n(v)V)
t "!V
(Gv(v)n(v))
v #B(v)V!D(v)V
#m
j"1
v,in,jnin,j(v)! n k"1
v,out,khout,k(v)n(v)
[36]
A volumetric growth rate is then required. Crystal growth rates are, however, available in length-based rates, soG(v) has to be calculated from:
Gv(v)"
dv
dLGL"3kvL
2G
L [37]
This expression prohibits the introduction of zero-sized nuclei as a boundary condition, and nucleation has to be modelled as birth within a certain size interval. The number of particles in a certain size interval must be the same, regardless of whether the bounds of that interval are expressed in terms of length of volume. This implies that:
n(L) dL"n(v) dv [38]
and, after some rewriting, the following transforma-tion equatransforma-tions:
n(L)"3kvL2n(v)
n(v)" 1
3(kvv2
n(L) [39]
Agglomeration and Disruption
To solve the PBE where there is agglomeration and disruption of earlier agglomerated particles, the birth and death terms for these processes must be derived.
The rate of agglomeration,r, is given by:
r(v1,v2)"(v1, v2,,)n(v1)n(v2) [40]
The rate constant,, commonly called the agglomer-ation kernel, depends on the particle sizesv1 andv2,
the supersaturationand the turbulence level, repre-sented by the power input . The birth and death terms associated with the agglomeration of two par-ticles, resulting in the birth of a new one and the death of the original two, are:
B(v)"1 2
v
0
(u,v!u)n(u)n(v!u) du [41]
D(v)"n(v)
0
(u,v)n(u) du [42]
The factor1
2is needed to avoid double-counting, since
the integral takes each interaction twice. The depend-ency of on and has been omitted here for notation simplicity.
can be described in the PBE by an additional death term for the disrupted particles, and an additional birth term for the newly formed particles:
D(v)"S(v,))n(v) [43]
B(v)"
v
b(v,u)S(u,)n(u) du [44]
where S(v) is a selection function that describes the rate at which particles fall apart, andbis a breakage function that describes how many particles of size vare formed on disruption of a particle of size u.
Often, the disruption terms are loaded into the agglomeration kernel , which then represents the effective agglomeration kernel. In that case terms expressed by the eqns [43] and [44] can be left out and only eqns [41] and [42] are needed for substitu-tion in the PBE. The main disadvantage of this lum-ped description of the whole agglomeration process is that prediction of the agglomeration behaviour for different hydrodynamic conditions (and thus for different scales and geometries) becomes vir-tually impossible because and have a differ-ent dependency on.
The PBE with agglomeration and disruption terms can rarely be solved analytically. A moment transforma-tion is again required with the moments deRned as:
mj"
0
n(v)vjdv [45]
where v represents crystal size volume v. The zero moment is again the total number of particles, but the Rrst moment of the volume-based CSD already equals the third moment of the length-based CSD.
Substitution of the above expressions into the PBE (eqn [36]) for a system with agglomeration and growth and no nucleation, with a constant crystal-lizer volume, only one crystal-free inlet stream and a nonclassiRed product stream, results after a moment transformation in:
dmj
dt"!
mj
#jGvmj\1#Bagg,j!Dagg,j [46]
where the moment forms ofBandDdue to agglom-eration are deRned as:
Baggl,j"
0
vjBdv [47]
Daggl,j"
0
vjDdv [48]
A solution is only obtained for a size-independent kernel0. For a batch-agglomerating system (without
growth), only solutions form0andm1(which is equal
to them3in size coordinates) are obtained:
dm0
dt "!0m
2
0 [49]
dm1
dt "0 [50]
The numerical solution of the population balance for cases where nucleation, growth and agglomeration is present often imposes a problem, because no analyti-cal solution exists and the generation of numerianalyti-cal solutions is not easy. It is essential to divide the size axis into proper size intervals to obtain reliable re-sults and to transform the population balance, a par-tial differenpar-tial equation, into a set of ordinary differential equations. Hounslow et al. presented a numerical scheme based on a geometrical discretiz-ation of the size axis in which for each size interval the ratio between the upper and lower boundaryris exactly equal to (2. Although accurate results are obtained in the absence of crystal growth and nuclea-tion, the method is in general not accurate enough in the presence of these crystallization phenomena and gives rise to an overestimation of the higher moments. An improvedRnite-element technique has been introduced to solve the steady-state solution of the population balance for nucleation, growth and agglomeration.
Kinetic Expressions
In order to solve the population balance equation, kinetic expressions are needed to represent the phys-ical processes that take place in the crystallizer, such as nucleation, growth and agglomeration. Their mechanisms and the corresponding equations will be treated here.
Nucleation
Two different nucleation mechanisms can be dis-tinguished: primary and secondary nucleation.
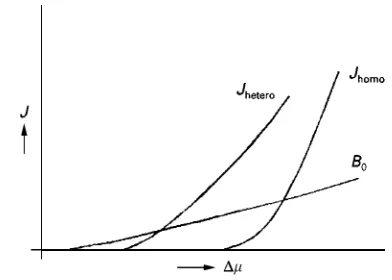
Figure 4 Nucleation rate as a function of the supersaturation ().JhomoandJhetero, homogeneous and heterogeneous
nuclea-tion rate;B0, secondary nucleation rate.
Secondary nucleation is the breeding of nuclei from crystals of the crystallizing material that are already present in the solution. These nuclei are in general attrition fragments, and result from collisions of the larger crystals with the hardware of the crystallizer, in particular with the blades of impellers and pumps. At high solid densities in the crystallizer collisions be-tween the larger crystals can create fragments that act as secondary nuclei.
During the start-up phase of evaporative or cooling crystallization of moderately to very soluble com-pounds, primary nucleation takes place. After their outgrowth to larger crystals, secondary nucleation takes over, and becomes the most important source of nuclei at low supersaturation values. For precipita-tion of slightly soluble compounds the process gener-ally remains dominated by primary nucleation for two reasons. Supersaturation remains high enough, especially at the inlet points of the feed streams, to produce primary nuclei, and the often agglomerated crystals remain too small to be prone to attrition. Homogeneous primary nucleation Local S uctu-ations in concentration induce the formation of nu-merous clusters that can fall apart again. In under- or just saturated solutions, cluster formation and cluster decay are in equilibrium; it is a reversible process. In supersaturated solutions, however, clusters of a criti-cal size are formed that either fall apart or grow out. In the classical nucleation theory of Volmer, Becker and DoKring, these clusters are formed by the attach-ment and detachattach-ment of single solute entities. Al-though clusters can also grow by the collision of clusters, their concentration is always so much lower than that of single solute entities that this process of cluster enlargement can be ignored.
The critical size of a cluster that is represented by its critical radius,rH, is given by:
rH"2Vmolar
[51]
and is thus related to the supersaturation via, and to the interfacial tension.
For the homogeneous nucleation rate, Jhomo
(Cm\3), the following equation can be derived after
some simpliRcations:
Jhomo"ASexp
163V2
molar
3k3T3(lnS)2
[52]In this Arrhenius type of expression, changes in the supersaturation ratioSin the pre-exponential factors A)Sare of minor inSuence compared to changes in S in the exponential term. Various authors use
dif-ferent expressions forAand this can cause consider-able differences in the attained values of J (Mer-smann, 1995; SoKhnel and Garside, 1992; Kashchiev, 2000).
Heterogeneous primary nucleation The occurrence of homogeneous nucleation is rare, in practice since nucleation on a foreign substrate will substantially reduce the nucleation barrier. For this type of nuclea-tion, a similar rate equation can be used:
Jhetero"AheteroSexp
163V2
molar
3k3T3(lnS)2
[53]where the interfacial tensionis replaced by a much lower eff. Although Ahetero is lower than A, the
ef-fect of the exponential term dominates up to very high supersaturation values, that are rarely met in practice (Figure 4).
Secondary nucleation The classic expression for the secondary nucleation rate in a suspension of growing crystals, B0, is the empirical power law, based on
three experimentally accessible parameters that were recognized already early on to be important:
B0"kNGiNhMjT [54]
Since the growth rate is directly related to the super-saturation, and the rotational speed to the power input, the power law can also be written as:
B0"k1NbkMjT [55]
Frequently measured values for b,k and j under steady-state conditions are 1(b(3, 0.6(k(0.7
and j"1 or 2. For nucleation dominated by
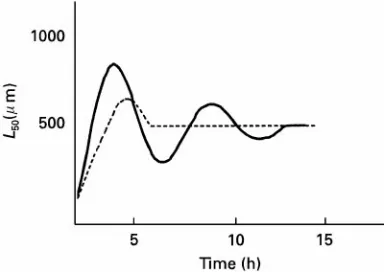
Figure 5 Dynamic behaviour of the CSD. Continuous line, measured; dashed line, modelled with the power law.
Also the crystallizer geometry-like type of stirrers or pumps, and number of blades, as well as the scale of operation inSuence the attrition rate of the crys-tals. These effects were supposed to be included in kN of k1N, that could only be established
experi-mentally. The power law with its four parameters, used together with other kinetic parameters (e.g. those related to the growth of the crystals) seems to be perfectly adequate to describe the steady-state median crystal size in continuous crystallization processes.
The power law, however, fails to describe the dy-namics of a crystallization process. If, for example, the median crystal size is plotted versus time from immediately after the start-up, often an oscillating behaviour is observed that dampens out untilRnally a steady-state value is reached (Figure 5). This oscil-lating behaviour can be explained by the observation that only crystals above a certain size breed secondary nuclei by attrition. The Rrst nuclei are created by primary nucleation and grow out, which causes the supersaturation to decrease. When the mean size has reached itsRrst peak, more of the larger crystals are withdrawn with the product than are grown into the larger crystal sizes by outgrowth of secondary nuclei. This happens because at the early stages no large crystals are available for breeding.
Some groups have tried to account for this phe-nomenon by adding a target efRciency to the power law that is a function of the crystal size. One author, Eek, allowed only crystals above a certain size to breed. This improved the simulations, although none of them was fully successful.
An attrition function for the crystals, was intro-duced by O’Meadhra based on the approach of Mersmann. He distributed the attrited volume over the small crystal sizes. In this way a birth functionB(L) was calculated from the volumetric attrition rate. A disadvantage of this modelling, in common with the power law, is that it has no predictive value, since
the attrition function also must be determined experi-mentally for the particular crystallizer.
Gahn and Mersmann were theRrst to derive a sec-ondary nucleation rate model based on physical attri-tion properties. Their approach comprises three con-secutive steps and calculates the secondary nucleation rate of crystals that collide with the blades of an impeller.
1. A simpliRedSow pattern based on geometric con-siderations as presented by Ploss et al. is used to calculate the impact velocity and the chance of crystals from size classito collide with an impeller segment j.
2. Subsequently a model was developed to calculate the volume of attrition fragments produced during a single collision of a crystal corner represented by a cone, and a hardSat surface of the impeller. The model relates the attrited volume of crystal iand segmentjto the impact energy of the crystal colli-sion via its relevant mechanical properties, such as the Vickers hardness, the fracture resistance of the substance and the shear modulus. The model as-sumes that the circulation time is sufRcient to heal the damaged crystal corner before a sub-sequent collision of the same corner takes place. This assumption is often not valid for crystallizers up to 100 L. A minimum impact energy required to cause fracture can also be derived, and thus the minimum crystal size for a given velocity proRle is prone to attrition. The model also provides a nor-malized number density function of the fragments with a minimum and maximum size of fragments formed at each collision of crystaliwith impeller segmentj. In general, the size distribution of frag-ments lies in the range from 2 to 100m. 3. In the third step the rate of secondary nucleation is
linked to the rate of formation of attrition frag-ments. The amount of stress remaining in the fragments limits the number that grows into the population, because stress increases their chemical potential. Their real saturation concentration cHbecomes:
cHreal"cHexp
K KTLfragment
[56]
The stress content of the fragments is directly related to their length, and the value ofKhas to be
deter-mined experimentally, for example from experiments where the Rnes of a crystallizer are withdrawn, and allowed to grow out in a growth cell.
The formed fragments with sizeLfragmentcan now be
Figure 6 Diffusion of a growth unit towards and integration into the crystal surface layer.
Figure 7 Concentration profile perpendicular to the crystal surface during growth.
rest will grow into the population with a size-depen-dent growth rate.
This model does not deliver a secondary nucleation rate,B0, with nuclei born at zero size or a birth term, B(L), for the distribution of secondary nuclei, but calculates from the number of collisions, and from the surviving fragments per collision, the number of new developing crystals. Since for this calculation an initial CSD is needed, iteration loops are always needed if this nucleation model is used as a predictive tool for secondary nucleation.
Both this model and that of O’Meadhra are able to describe the dynamic behaviour of crystallization processes.
Crystal Growth
DeVnitions of growth rate The growth rates of the crystallographically different faces (h k l) of a crystal can vary considerably. The growth rates of the crystal faces determine the shape of the crystal and, together with the growth mechanisms, also the crystal surface structure.
The growth rate of a particular crystal face (h k l) is mostly deRned by its linear growth rateRlin(m s\1),
which refers to the growth rate of that face along the normal direction. An overall linear growth rate RMlin averaged over all different (h k l) faces can be
deRned in several ways. One deRnition which is often used relatesRMlinto the increase of the crystal mass in
time: 1 A
dm
dt"
kv kaL2
dL3
dt"3
kv ka
GL"6
kv ka
RMlin [57]
For spheres and cubes (or for crystals where L is based on the diameter of a sphere with the same volume),ka/kv"6, and:
1 A
dm
dt"
1
2GL"RMlin [58]
Note that G"dL/dt"2RMlin for substitution of
the linear rate equations in the population balance equation.
Crystal growth mechanisms For growth from solu-tion the crystal growth processes can be roughly divided into two steps (Figure 6):
1. (volume) diffusion of growth units towards the crystal}solution interface
2. subsequent integration of these growth units into the crystal surface
The concentration proRle perpendicular to the crystal surface is given inFigure 7, where the concen-trations in the bulk at the crystal}solution interface and the equilibrium concentration at the growth site are indicated bycb,ciandcHrespectively.
For very soluble compounds, the growth rate is only limited by diffusion through the stagnant layer with thicknessat the interface, withcb!cHas
the driving force for diffusion. For poorly soluble compounds the surface integration step is growth-limiting, and the driving force for the integration equalscb!cH. For most compounds, however, both
[image:12.568.120.429.551.693.2]Figure 8 Growth curves for spiral, birth and spread (B&S) and rough growth.
expressions will be given, as well as the growth rate expressions for a combination of both steps. The expressions for heat transfer-controlled growth and for simultaneous heat and mass transfer will not be discussed here.
Surface integration controlled growth
Rough surfaces The structure of a growing surface at a molecular level is inSuenced by several factors: Rrst, by the binding energies between the atoms, ions or molecules in the crystal surface layer. Also the solvent, temperature and driving force can play an important role. Depending on these factors, surfaces can become roughened. For a given compound and a selected solvent, either thermal or kinetic roughen-ing may occur.
Each crystal face has a critical temperature above which the surface becomes rough. For ionic com-pounds these temperatures are very high, and always above the normal operating conditions. For organic compounds, however, roughening temperatures can even be close to room temperature, as with paraf-Rn crystals growing from hexane. For rough growth the crystal faces tend to become rounded, especially at the edges, and nicely faceted crystals are no longer formed.
Kinetic roughening is caused by growth at too high supersaturation, and also happens for ionic sub-stances. Rough growth always affects the crystal quality in a negative way, in particular the crystal purity, since impurities or solvent molecules are more easily incorporated.
It is not surprising that for rough growth the linear growth rate depends linearly on the supersaturation, because all surface sites can act as growth sites, and the rate constantkris proportional to the solubility of
the compound. The solubility reSects the number of growth units that potentially impinges on the crystal surface, and thus contributes to its growth. The linear growth rate is given by:
Rlin"kr [59]
Smooth surfaces For growth of smooth crystal faces, as normally happens under moderate operating conditions, an orderly deposition of subsequent growth layers is needed. This can be realized by the propagation of growth steps along the crystal surface (Figure 6). Two sources can be identiRed for the generation of steps, and the two mechanisms of layered crystal growth are named after these sources: the ‘birth and spread’ or two-dimensional (2D) nu-cleation and growth model or the spiral growth model.
In the birth and spread model the steps are gener-ated by the formation of 2D nuclei on the crystal surface that grow into islands by spreading laterally along the crystal surface. New nuclei can be formed on the original surface as well as on top of the already growing island. 2D nuclei can only be formed if the supersaturation is high enough to overcome the 2D nucleation barrier. The linear growth rate is given by:
Rlin"kr(S!1)2/3S1/3exp
!B2D
3 lnS
[60] whereS"#1.At low supersaturations, where 2D nuclei are not yet formed, screw dislocations that are present as lattice defects in the crystals and emerge on the crystal surface will act as step sources. The steps will curve around the defect emerging point, and spiral hillocks are formed.
The linear growth rate, also known as the para-bolic growth law, equals:
Rlin"kr2 [61]
In both eqns [60] and [61] kr is directly
propor-tional to the solubility of the compound. This solubil-ity dependence is clearly seen in plots of the growth rates and the mean crystal sizes of many salts versus the supersaturation, as given by Mersmann. So, at the low supersaturations generally prevailing in evapor-ative and cooling crystallization, the surface integra-tion growth step mostly obeys the parabolic low. At higher supersaturations, 2D nucleation and growth take over. If, at very high supersaturations, the size of the 2D nuclei approaches that of one growth unit, rough growth occurs (Figure 8).
growth model is also called the diffusion layer model. Even for rather concentrated solutions the simpliRed Fick’s law can be applied, and the increase in crystal mass is given by:
dm
dt"
D
A(cb!cH)"kdA(cb!cH) [62]
The mass transfer coefRcient kd follows in its
simplest form fromSh"kdL/D, where forShseveral
correlations provided in literature can be used. The values for Sh generally lie between 2 and 10. For concentrated solutions the MaxwelldStefan equation is used
dm
dt"
kd
(1!w)A(cb!cH) [63]
withw"mass fraction of the solute.
So, for most cases the linear growth rate is given by:
RM lin" kakd
6kv
cH [64]
The dependency ofRMlinonisRrst order, andRM linis
directly related to the solubility. It always limits the maximal growth rate by which a crystal can grow at a given supersaturation in Figure 8.
Volume diffusion and surface integration con-trolled growth For combined volume diffusion and rough growth as growth rate-determining steps, the growth process can be described by:
1 A
dm
dt"
kdkr kd#kr
(cb!cH) [65]
while for combined volume diffusion and spiral growth surface integration the growth rate becomes: 1
A dm
dt"kd(cb!cH)#
k2 d
2kr!
k4d
4k2 r#
k3
d(cb!cH)
kr
1/2
[66] With eqn [57] eitherRMlin orGcan be calculated.
The temperature dependence of krandkd is given
by an Arrhenius-type equation, where the corre-sponding Arrhenius activation energies are typically of the order of 40}60 kJ mol L\1for surface
integra-tion and 10}20 kJ mol\1 for the volume
diffu-sion step.
For easily soluble compounds generally linear growth rates of 10\7m s\1are permissible in order to
obtain smoothly grown crystals atvalues of 0.001 to 0.01, while for slightly soluble substances growth rates of 10\9 to 10\8m s\1are commonly
encoun-tered at values of 10}100. Their corresponding mean sizes vary from 600m to 10m respec-tively.
Growth rate dispersion Small crystals, regardless whether they are born by primary or secondary nu-cleation, grow slower than their parent crystals. This is attributed to a certain content of stress in the small crystals. During the growth of the nuclei, the outer layers of the crystals lose some of the stress}a pro-cess called healing. Although the stress content of individual small crystals of the same size can dif-fer, and thus their growth rate } a phenomenon named growth rate dispersion } the overall effect of stress on the growth rate of a large number of small crystals can equally be described by a size-dependent growth function. The equilibrium concentration then becomes a size-dependent function analogous to eqn [56].
G(L)"kg
!Wi(L)kT
g
[67]
whereWi(L)"k/Lfragmentandg"1 for volume
dif-fusion-dominated growth, and 2 for spiral growth. The value of k is, as mentioned before, a Rtting
parameter that has to be determined experimentally. Dissolution of Crystals
Only at very low undersaturations or for extremely insoluble substances such as BaSO4, the dissolution
process proceeds by the disappearance of subsequent layers, and a smooth surface is maintained. Normally surface disintegration occurs at the crystal edges and at etch pits, and the surface becomes easily roughened. So the dissolution rate is either given by an expression where only volume diffusion is rate controlling:
!A1ddmt"kd(cH!cb) [68]
or by a combined volume diffusion and surface disintegration rate, as given by eqn [65] and, more rarely, by eqn [66], but now with a negative value for the change in mass, and a decreasingA.
Agglomeration
cemen-Table 2 Predominant agglomeration models for the possible transport mechanism as a function of particle size L and the Kolmogorov length scale
Transport mechanism Particle sizeL Collision mechanism
Brownian motion ¸(0.5m Perikinetic
Laminar flow L(6 Orthokinetic
Laminar flow L'25 Inertial
Turbulent flow L(6 Orthokinetic
Turbulent flow L'25 Inertial
[image:15.568.51.278.89.179.2]Relative particle settling L(6 Inertial
Figure 9 Forced circulation crystallizer with a tangential inlet (Swenson type). Reproduced with permission from Bennett (1993).
tation of the attached particles. The cemented par-ticles are agglomerates. If the supersaturation is zero, no cementation occurs and all loosely agglomerated particles fall apart again. Since in practice only the combined result of disruption and cementing can be observed, an effective agglomeration rate is gen-erally deRned.
The main transport mechanisms by which particles can collide are Brownian motion, laminar or turbu-lent Sow or relative particle setting. Depending on the particle size and the Kolmogorov length scale of the different Sow regimes, different colli-sion mechanisms can be distinguished (Table 2).
In case of orthokinetic collisions the effective agglomeration rate constant or agglomeration kernel can be described as a product of the collision rate constant and an efRciency factor:
"(,)coll [69]
coll increases linearly with the shear rate , that
equals (/ in a stirred vessel, whereas the efR -ciency factordecreases strongly within this high shear region, and thus also decreases after having reached a maximal value at a rather low shear rate value. Although should be size-dependent, experi-mental agglomeration data can often be Rtted with a size-independent kernel. Hounslow and co-workers recently introduced a dependence ofcollon the mean
particle size. The efRciency factor includes the supersaturation dependence that is needed for the cementation of the particles. The supersaturation-dependent cementation explains why, for large cry-stallizers with a sufRciently large circulation time between two subsequent collisions with the impeller blades, abundant agglomeration may occur, while hardly any agglomeration is noticed for small scale crystallizers.
It must also be kept in mind that agglomeration is a kinetic process that depends on collisions, and thus on the local turbulence or power input. Averaging the power input for the calculation of might
therefore lead to a wrong estimation of the degree of agglomeration.
Industrial Crystallizers
Several types of crystallizers are commercially avail-able. The choice of crystallizer depends on the mater-ial to be crystallized and the solvent, the method of crystallization, the product speciRcations, in particu-lar the crystal size distribution, and theSexibility of the design in cases where products of various coarse-ness (L50) must be crystallized on demand in the same
equipment.
Here only three large scale evaporative and cooling crystallizers will be discussed. These examples mainly serve to illustrate that in practice and in particular for a large scale crystallizer several compartments can be distinguished, where different processes may dominate.
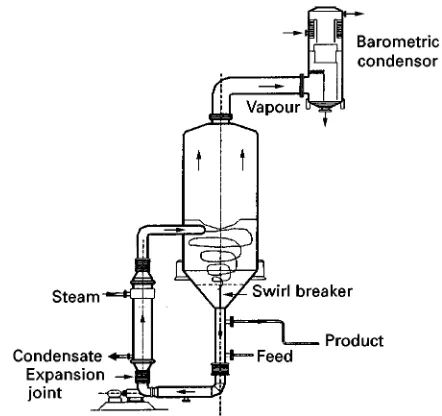
Forced Circulation Crystallizer
The forced circulation (FC) crystallizer is the most widely used crystallizer. It is most common in multi-stage Sash evaporative crystallization of salts with aSat solubility curve. It is the least expensive vacuum crystallizer, especially for evaporation of substantial amounts of water. The crystallizer as depicted in Figure 9comprises two separate bodies that can be designed separately for evaporation and crystalliza-tion and for heat input.
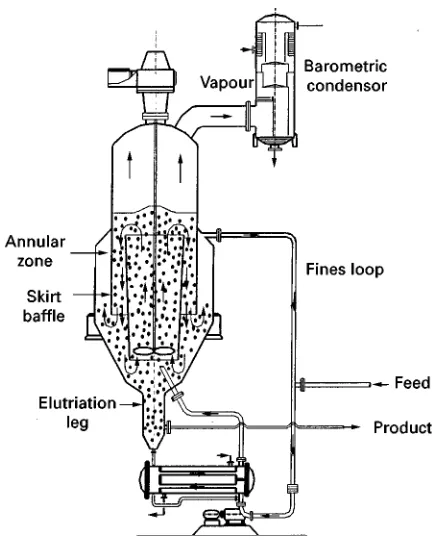
[image:15.568.294.515.466.674.2]Figure 10 Stirred draft tube baffle (DTB) crystallizer with an external heat exchanger and fines destruction (Swenson type). Reproduced with permission from Bennett (1993).
Figure 11 Fluidized bed crystallizer (Swenson type). Repro-duced with permission from Bennett (1993).
release, while the vessel bulk zone should maintain a sufRciently large volume to retain the growing crystals until the supersaturation is consumed. A slurry pump circulates the crystal slurry through the tubes of the heat exchanger, that can act as an internal Rnes dissolver, back into the boiling zone. This pump also creates most of the attrition frag-ments that may grow out as secondary nuclei, al-though usually an (axial-type) centrifugal pump is applied to minimize the attrition in order to get a suf-Rciently large mean crystal size. Because the forced circulation causes good mixing, the FC crystallizer is often modelled as a one compartment or MSMPR crystallizer in spite of its various zones.
The supersaturation and the turbulence may how-ever differ locally.
Draft Tube Baf]ed Crystallizer
In this draft tube bafSed (DTB) crystallizer with an external heat exchanger, as depicted inFigure 10, the heat duty is also separated from the crystallizer body. Fines removal has been realized by installing a skirt bafSe that creates a settling or annular zone. The Sow in the draft tube thus has to be up-wards: this is effected by the impeller that also creates most of the attrition fragments. TheRnesSow can be diluted or heated to partly or totally dissolve
theRnes. An increase inRnesSow increases the num-ber ofRnes that are removed from the crystallizer, but also the cut size of theRnes. TheRnes loop in this way serves as an actuator that can be applied for control of the mean crystal size, although the variation in mean crystal size that can be achieved is limited.
The addition of an elutriation leg at the bottom of the crystallizer or the addition of another type of classiRer allows classiRcation of the productSow, and thus also serves as an actuator to inSuence the CSD of the product.
Obviously the various zones of the DTB crystallizer have different functions, and different super-saturation and turbulence values can be expected, in particular for large scale crystallizers.
The DTB crystallizer can also be applied as cooling crystallizer by using the heat exchangers as a cooling system.
Fluidized Bed Crystallizer
A Suidized bed crystallizer (Figure 11) is especially designed to produce large and uniformly sized crys-tals. The heat duty and the crystallizer body are again separated. At the top of the bed the crystals are settled, and only theRnes leave the crystallizer with the exhausted mother liquor to be circulated through the heat exchanger after mixing with the feed stream. The hot circulated Sow enters the vaporizer head, where the solvent is Sashed off. The super-saturated solution leaves the vaporizer through the downcomer, and enters the densely packedSuidized bed at the bottom of the crystallizer. The supersatura-tion is consumed on its way up, and a coarse product leaves the crystallizer at the bottom.
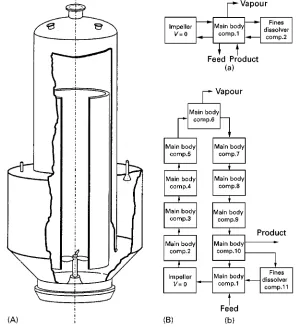
Figure 12 (A) A DTB crystallizer and (B: a,b) two compartment structures.
Since the residence time of the crystals can be con-siderably increased, this type of crystallizer is com-monly used to produce large crystals.
This crystallizer can also be used for cooling crys-tallization. No vapour chamber is then needed. Other well-known cooling crystallizers are:Rrst, a Swenson type where the suspension is circulated through a heat exchanger; second, a direct cooling crystallizer, where a refrigerant is introduced directly into a draft tube crystallizer; and third, a cooling disc crystallizer, that can be regarded as a compact cascade of cooling crystallizers with various cooling elements that are scraped by rotating wipers.
Compartmental Modelling
In an industrial crystallizer various zones with dif-ferent functions can be identiRed, as has been illus-trated in the former section. The supersaturation (Krameret al.1999) and the turbulence (Derksen and van den Akker, 1999) in a crystallizer are therefore not necessarily evenly distributed. Their local values depend on the geometry and scale of the crystallizer,
on the Sow pattern, as well as on the rates of the kinetic processes and the production rate of the speci-Rc crystallizing compound. In particular, the nonlin-ear kinetic processes such as nucleation and agglom-eration are strongly dependent on these local values. It also has to be established whether locally the super-saturation does not exceed a maximum beyond which value rough growth occurs or too many solvent inclu-sions are incorporated in the crystals.
Figure 13 (A) Dynamic trend of the median crystal size and (B) steady-state crystal mass production and supersaturation for simulations (a) and (b).
Here an example will be presented to illustrate the design of a compartment model for a 360 m3 DTB
crystallizer, with the main crystallizer body modelled as a one- or as a multicompartment vessel.
The subdivision of the crystallizer into multiple compartments is performed on the basis of crystal-lizer geometry, hydrodynamic analysis and character-istic times of the crystallization kinetics (Kramer 1999). In compartmental modelling, process condi-tions may differ between compartments but not within compartments, because the individual com-partments are modelled as well-mixed vessels. A three-step approach is used to deRne the size and location of the compartments as well as the exchange Sow rates between them:
1. Set up a rough compartment structure on the basis of the crystallizer geometry, e.g. an inlet compart-ment, a propeller compartcompart-ment, a boiling zone compartment, etc.
2. Compare the characteristic time of supersatura-tion deplesupersatura-tion due to crystal growth with the resi-dence time in each compartment to check the constant supersaturation assumption. If necessary, the compartment structure may be reRned. 3. Use computationalSuid dynamic (CFD) results to
reRne further the compartment structure, speciR -cally with respect to the exchangeSow rates and the constant energy dissipation assumption in each compartment.
The importance of compartmental modelling is il-lustrated for a 360 m3 DTB crystallizer (Figure 12)
with ammonium sulfate and water as the model sys-tem. This crystallization system is dominated by secondary nucleation and growth. The model frame-work of Gahn and Mersmann (see section on second-ary nucleation, above) is the most sophisticated for such systems and is hence used in this example. Fig-ure 12 also contains two compartment structFig-ures for this DTB crystallizer. TheRrst compartment structure (Figure 12B a) describes a MSMPR crystallizer with Rnes removal andRnes dissolution. The second struc-ture (Figure 12B b) was created using the three-step approach presented in the previous paragraph.
Both compartment structures will now be used to describe the behaviour of the 360 m3DTB crystallizer
operating with a residence time of 75 min, an impel-ler frequency of 45 rpm and aRnes withdrawal rate of 157 m3min\1. Additional information regarding the
equipment, operating conditions and simulation de-tails can be found in Berminghamet al. (1999).
Results of simulations with both compartment structures are depicted inFigure 13. Taking the spa-tial distribution of the supersaturation into account clearly has a large inSuence on the predicted crystal size distribution. The lower median size of simulation (b) is most probably related to the higher supersatura-tion of the withdrawnRnesSow, i.e. 1.78 as opposed to 1.38 kg m\3. Furthermore, it is interesting to note
that a large majority of the crystal mass is produced in only half the crystallizer volume.
Figure 14 Liquid inclusions in (NH4)2SO4crystal embedded in
a liquid of similar refractive index.
crystals. Compartmental modelling is therefore an im-portant or even essential tool in the design of industrial crystallizers to predict the inSuence of crystallizer ge-ometry, scale, operating conditions and process ac-tuators on the process behaviour and product quality. Only using this approach can a reasonable predic-tion can be obtained for the composipredic-tion of the bleed and/or product streams, and of the Rlterability and washability of the product, which determine the ef-Rciency of this separation process.
Product Properties Related to the
Process Conditions
In order to apply crystallization as an adequate separ-ation process, the solid phase has to fulRl a number of requirements. The crystal size distribution as well as the shape of the crystals should meet the demands of a goodRlterability and washability of the product, as is needed for a good separation. The surface rough-ness of the crystals may also play a role, because a rough surface leads to attrition, and the attrited fragments may hamper the downstream processes.
The crystals should be formed under process condi-tions that minimize the uptake of impurities or mother liquor inclusions in the crystals. This can happen when the (local) supersaturation is too high. A too high local turbulence should be avoided, this causes attrition of especially the corners or edges of the crystals. Although healing of the crystals will occur particularly in the regions of the highest super-saturations, this healing process is never perfect, and always leads to the uptake of solvent inclusions. That crystals are prone to attrition beyond a certain size that also depends on the degree of turbulence can be seen fromFigure 14.
Agglomeration should in general be prevented, since liquid incorporation between the primary
par-ticles of an agglomerate is unavoidable. Only if, as often happens in precipitation processes, the primary particles are too small for Rltration, agglomeration should just be promoted. In that event the solute concentration in the mother liquor is extremely low and some incorporation of it in the solid phase hardly affects the separation process.
Final Remarks
To summarize, it can be said that the design of a good evaporative or cooling crystallization process is based on heat, mass and population balances, kinetic pro-cesses of nucleation, growth and agglomeration of the particles, as well as on the hydrodynamics that exist in the crystallizer of a given geometry and scale. However, as the prevailing process conditions are not evenly distributed in industrial crystallizers, local de-scriptions of the crystallization phenomena are needed to calculate the local variations in the process conditions, their effect on the process perfor-mance and to predict their dependence of the scale and geometry of the crystallizer. It has been shown that by taking all these balances and processes into account in a compartmental modelling tool, the ef-Rciency of the separation process as well as the qual-ity of the crystalline product and the process perfor-mance can be properly predicted.
Symbols
a activity J mol\1
A primary nucleation factor Cm\3s\1 AT total crystal surface area
per unit crystallizer volume
m2m\3
B(,v) breakage function Cm\1
B0 birth rate Cm\3s\1
B(L) birth rate (size-based) Cm\3m\1s\1 B(v) birth rate (volume-based) Cm\3m\3s\1
c concentration kg m\3
Cp speciRc heat J kg\1K\1 D(L,t) death rate Cm\3m\1s\1 D(v,t) death rate Cm\3m\3s\1 GLorG linear growth rate m s\1
GV volumetric growth rate m3s\1
H enthalpy
H(L) classiRcation function * J primary nucleation rate Cm\3 k Bolzmann constant J K\1 ka,kv surface, volume shape
factor *
knorkHv nucleation rate constant * kdistr distribution constant
impurity uptake