http://wrap.warwick.ac.uk/
Original citation:
Qureshi, H., Wilson, Roland, 1949- and Rajpoot, Nasir M. (Nasir Mahmood) (2008)
Optimal wavelet basis for wavelet packets based meningioma subtype classification. In:
12th Medical Image Understanding and Analysis (MIUA 2008), Dundee, Scotland, 2-3
Jul 2008
Permanent WRAP url:
http://wrap.warwick.ac.uk/61696
Copyright and reuse:
The Warwick Research Archive Portal (WRAP) makes this work by researchers of the
University of Warwick available open access under the following conditions. Copyright ©
and all moral rights to the version of the paper presented here belong to the individual
author(s) and/or other copyright owners. To the extent reasonable and practicable the
material made available in WRAP has been checked for eligibility before being made
available.
Copies of full items can be used for personal research or study, educational, or
not-for-profit purposes without prior permission or charge. Provided that the authors, title and
full bibliographic details are credited, a hyperlink and/or URL is given for the original
metadata page and the content is not changed in any way.
A note on versions:
The version presented in WRAP is the published version or, version of record, and may
be cited as it appears here.For more information, please contact the WRAP Team at:
Optimal Wavelet Basis for Wavelet Packets based Meningioma
Subtype Classification
Hammad Qureshia∗, Roland Wilsonaand Nasir Rajpoota
aDepartment of Computer Science, University of Warwick, Coventry, CV4 7AL.
Abstract. Wavelets based analysis has been used frequently in literature for texture analysis and features extraction.
Due to the availability of many wavelet filters, the issue of the selection of the optimal filter for a certain problem has always been an interesting research problem. In this paper, we present a study and comparative analysis of various wavelet filters for the problem of texture classification. The results are quite interesting as they identify wavelet properties that are desirable for wavelet based textural analysis and classification of meningioma subtypes.
1
Introduction
Meningiomas are tumours of the brain and nervous system. The problem of meningioma subtype classification essen-tially involves discriminating between four different subtypes of meningiomas, each having distinct characteristics and at the same time many dissimilar textural properties. Meningiomas account for 20% of all brain tumours and exist in three different grades of malignancy (WHO Grad I-III), most being benign (over 80%), but some showing an increased propensity to recurrence and rare cases being malignant. Most benign WHO Grade I meningiomas belong to one of the subtypes shown in Figure 1.
a. b.
[image:2.595.199.401.350.435.2]c. d.
Figure 1. Meningioma Images for each subtype a. Meningiothelial (cells form synctium), b. Fibroblastic (spindle shaped cells in collagen-rich matrix), c. Transitional (cells form whorls with psammoma bodies), d. Psammomatoes (high number of psammoma bodies)
Histopathological diagnosis of tumours, especially of the brain and spinal cord, requires decision making by human experts. Visual diagnosis and decision making are hampered by two limitations: First, reviewing histological slides by humans is time consuming and the human experts are not always available. Secondly, although a lot of effort has been made to exactly define diagnostic criteria for all tumour entities within the World Health Organization (WHO) Classification of Tumours [1], the inter-rater variability is still considerable (see e.g. [2]). This consequently influences further therapy regimens greatly and hence a bias is introduced. Due to the progress in digital image retrieval and analysis technologies, machine based decision making may be used to support histopathologists by providing more objective diagnostic parameters and allow for high-throughput analysis. In our work, we are aiming to develop machine based texture analysis techniques for texture classification. The figure 1 shows two samples of each the meningioma subtypes indicating the variability in the textures and also the fact that the colour information is not useful. Hence, the problem is more complex than a general texture classification problem.
Our previous work in the area has shown promising results as per the classification accuracy achieved using a wavelets packet based transform technique called Adaptive Discriminant Wavelet Packets Transform (ADWPT) [3] [4]. Lessman et. al. [5] have shown that simple wavelet transforms are useful in acquiring features for pattern association. Transform techniques have been used frequently in literature for feature extraction for pattern classification. Unser et. al. [6] [7] have shown wavelet transforms to be powerful techniques for pattern classification. Gabor wavelet transforms have been shown to be more effective than other techniques for texture classification [8,9]. In all transform based techniques, the issue of selection of the appropriate subbands is of paramount importance. Saito and Coifman [10] employed wavelet packet transform for optimal local features extraction using relative entropy as the criterion for basis selection. Rajpoot [11] developed discriminant wavelet packets for optimal subband selection for texture classification. On these
lines we have developed the ADWPT, the details of which could be found in our papers [3, 4]. Another important issue is the selection of the appropriate filter for texture classification. In the domain of compression a lot of work in optimal filter selection has been carried out [12] [13]. Similarly some effort has been expended in defining which filters are optimal for features extraction in the domain of texture classification. Some interesting work in the area was carried out by Mojsilovic et. al. in defining which characteristics in a wavelet are useful for texture characterization [14]. In this paper, we try to ascertain which wavelets are optimal in our wavelet packets (ADWPT) based approach for meningioma subtype texture classification.
2
Methods
The methodology employed in this paper consists of the following steps.
1. Computation of a Full Wavelet Packet Transform using a wavelet filter.
2. Computation of the best basis i.e. the optimal set of subbands for discriminating between textures being studied. 3. Calculation of textural features from each subband.
4. Classification of textures based upon these textural features using Support Vector Machines (SVM).
2.1
Full Wavelet Packet Transform (FWPT)
The wavelet transform is computed by applying a highpass and lowpass filter upon the input signal to acquire the high frequency and low frequency subbands. A simple wavelet transform decomposes only the low level frequencies iteratively, whereas wavelet packets decomposes, all subbands. The wavelet packet decompositions are maintained in a quadtree structure, with the parent being the original subband or image and the children being the wavelet decompo-sitions of the parent. A FWPT involves the decomposition of all the subbands up to a certain level whereas a simple wavelet transform only decomposes the approximation subband. The decomposition of the details at each level is done to extract relevant information. An overcomplete set of subbands is obtained with a lot of redundancy. An optimal subset has to be extracted from these.
2.2
Adaptive Discriminant Wavelet Packet Transform Algorithm
The next stage is the selection of the best basis or pruning of the tree. Before pruning can be done, the discrimination power of each subband must be computed. First, a pseudo probability density function (ppdf) is obtained for each subband using the normalized energy for the subband coefficients. A ppdf is computed by dividing the squares of a coefficient by the sum of the squares of the coefficients in a subband and is given by.
sm,n= (xm,n)2/ M
X
i=0
N
X
j=0
x2i,j
whereM ×N is the size of the subband,sm,nis the ppdf of the coefficientxm,nlocated at indices (m, n)of the subband. Next we compute the pseudo average probability density functions (papdf) by iteratively taking the pairwise average of the training images. It is important to note that these are computed for each class separately:
Aai
m,n= (Aam,ni−1+sam,ni )/2
wheresai
m,nis the ppdf of the(m, n)th coefficient in a subband for the training imageaibelonging to classa. The process is repeated for all the subbands of the training images. It is important to note that an average of two subbands is computed per iteration. The objective is to acquire a basic model of probability distribution values for each class so that the difference between the classes may be estimated. This averaging is to be referred as pseudo averaging as it is different from the simple averaging. This is done to account for any sudden rise or falls in the probability distribution estimates. The pairwise discriminating power of the (p,q)th subband located at depthdis calculated using the Hellinger distance as follows:
Dci,cj d,p,q =
MX−1
m NX−1
n
(pAci m,n−
q
Acm,n)j 2
dfor classesciandcjrespectively. This distance is calculated pairwise as indicated. So for a four class problem 6 such distances are computed. Subsequently the calculation of the overall discriminatory powerP is computed as,
Pd,p,q= n−1
X
i=1
n
X
l=i+1 Dci,cl
d,p,q
whereiandlrepresent the different class indices,p, qrepresents the subband number at depthdandnis the total num-ber of classes. The process is repeated for all the subbands at various levels in the full wavelet packet decomposition. The next stage is the best basis selection.
2.2.1 Best Basis Selection
The algorithm for the best basis selection is stated below.
1. Compute theJ-level full wavelet packet tree decomposition.
2. Calculate the discrimination power of each subband based upon the procedure described above. 3. Initialized=J−1.
4. For all0≤p <2j,0≤q <2j, do the following:
a IfPd,p,q < max[Pd+1,p,q,Pd+1,p,q+1,Pd+1,p+1,q,Pd+1,p+1,q+1]keep the four child subbands at depthd+ 1
wherePd,p,qrepresents the discrimination power of a node at positionp, q
b otherwise keep the parent at depthdand remove the child subbands.
5. Decrementdby 1.
6. Ifd <0, then stop, otherwise goto step 3.
2.2.2 Best Basis Stability and Most Probable Decompositions
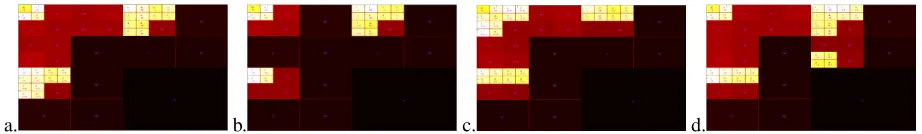
The best basis changes by 20% when the test and training data are changed. This means that when certain patients’ data are excluded from the computation, the best basis obtained is different from the one when it is included. Hence, we did an analysis of all the data computing the best basis for all the different permutations (different test/training data sets) to acquire the most probable subbands i.e. the subbands that are selected most frequently. The results showed that most subbands were decomposed more than 80% of the time and there were very few occasions when the decomposition was different from the most probable subband. Hence, it was concluded for the given application that the most probable decomposition included the most useful subbands for a given filter. Figure 2.2.2 shows the decompositions obtained for some of the filters indicating the variability in the decompositions. The blue number indicates the subbands’ discrimination power when subbands are ordered based upon their discrimination power. So the number1indicates that this is the most discriminant band. The magenta number indicates the percentage of how frequently this subband is obtained in the various test/training trial decompositions.
[image:4.595.70.531.579.646.2]a. b. c. d.
Figure 2. Most probable decompositions using various wavelet filters a.Coiflet-2 b.Biorthogonal4.4 c.Reverse biorthogonal 2.8 d.Daubechies-4
2.2.3 Best Basis and Features Extraction
aided by the fact that high frequency resolution is obtained through ADWPT, which means that only a certain range of frequency coefficients is analysed at each subband level. The GLCM is computed over each subband. The Gray Level Co-occurrence MatrixCover a subbandI, parameterized by an offset(4x,4y)is defined by the formulae:
Cij=
½
1 ifI(p, q) =iandI(p+4x, q+4y) =j 0 otherwise
Next, features for the GLCM,Cij, are computed: Contrast(PNi,j−=01 Cij(i−j)2) Correlation(Pi,jN−=01 Cij(i−µσ)(2j−µ))
Energy(PNi,j−=01(Cij)2) Homogeniety(PN−1
i,j=0
Cij
1+(i−j)2), whereµandσrepresent the mean and standard deviation of
the coefficient in the subbandI. It can be seen from the equation that certain row (4x) and column (4y) offsets must be set. In our work, at present instance the row offset is set to 0 and the column offset is set to 1. Each feature has its own significance. Contrast measures the difference or the gradient in coefficient values over a subband. Correlation determines the relationship in terms of how the coefficients texture varies over a subband. Energy is a measure of non zero coefficients or the presence of texture in a subband. Homogeneity reflects the degree of similarity of the texture over a subband. Each of these features capture a certain spectral property of the texture.
2.2.4 Classification using Support Vector Machines
SVM is a supervised classifier, which approximates the decision surfaces of the theoretical Bayes classifier. SVM has found a broad area of application since its invention in 1995 by Vapnik [15]. SVM uses various kernels to map the input space into a higher dimensional feature space to make the non-linear hyperplane linear. To achieve this without increasing computational complexity a kernel is employed. The kernel functionK(xi, xj)computes an equivalent kernel value in the input space such that no explicit mapping is required. The Matlab version of LibSVM provided by Chang and Lin [16] was used in our analysis.
3
Results
The classification accuracies for various filters are presented in the table 1. The decompositions for each kind of wavelets was computed up to four levels. The GLCM features of contrast, correlation, energy and homogeneity are concocted together and used for training and testing of SVM. Each of the results have been cross-validated using 5 different test trial runs.
4
Conclusion and Discussion
A wavelet filter could be thought of as a microscope to analyse signals at various frequency and spatial resolutions. Hence, each kind of wavelet could be used to analyse a different aspect of a signal as they have different properties. This can be seen from our results in table 1, where certain filters perform better than others. Furthermore, some filters are seen to have better classification accuracy for one meningioma subtype, for instance, Coiflet-2 is better at classifying meningiotheliamatous and psammomatous meningiomas, whereas Daubechies-4 is better at classifying fibroblastic, psammomatous and transitional.
It can be seen here that the classification accuracies are not as high as the ones qouted in our previous work [4]. The reason for this is that rather than only applying contrast feature (optimal overall accuracy of 82%), four GLCM based features are used for classification. They bring robustness to our analysis by improving accuracies over all the different meningioma subtypes but bring down the overall classification accuracy. The objective of this paper is to analyze the effect of various filters on classification accuracy inorder to acquire the best wavelet. The table shows that wavelet filters with certain characteristics are more useful for classification than others. From our results it could be safely concluded that regularity and orthogonal analysis are useful wavelet properties for image analysis and classification. Mojsilovic et. al. [14] in their analysis with the simple wavelet transform found biorthogonality and higher number of vanishing moments useful properties. Symmetry is not an important property as far as classification is concerned. In our analysis, assymetrical filters such as Daubechies 4 provides the best overall classification accuracy of 78%. Symmetrical wavelet coiflet 2 performs equally well with providing high classification accuracies for meningiotheliamatous which is one of the more difficult textures to classify. This paper dealt with mainly the effect of the use of different wavelets on classification accuracies. Comparison of wavelets with other techniques will be the subject of our future work.
Acknowledgements
Table 1. Cross validated classification results for meningiomas (F=Fibroblastic, M=Meningiotheliamatous, P=Psammomatous, T=Transitional) for ADWPT features
Wavelets Filter No. Features F M P T Average
Haar 13X4 68 55 88 35 61
Symlets 5 40X4 70 65 96 78 77
Coiflet 2 49X4 56 90 98 69 78
Daubechies 5 46X4 59 68 93 69 72
Biorthogonal 4.4 42X4 59 64 94 61 69
Reverse biorthogonal 2.8 49X4 63 54 93 74 71
Daubechies 4 52X4 77 63 98 75 78
Daubechies 10 64X4 74 62 91 58 71
Symlets 10 37X4 60 72 92 75 75
Reverse biorthogonal 1.3 34X4 60 58 94 58 67 Reverse biorthogonal 3.9 58X4 69 50 95 71 71
Biorthogonal 2.4 40X4 61 51 94 56 66
Biorthogonal 6.8 46X4 63 73 96 70 75
Reverse biorthogonal 2.4 43X4 58 50 96 71 69 Reverse biorthogonal 4.4 46X4 61 55 96 66 70
Coiflets 1 49X4 61 51 95 62 68
Biorthogonal 1.5 13X4 55 52 88 38 58
Reverse biorthogonal 3.1 40X4 58 78 86 55 69 Reverse biothogonal 1.5 42X4 69 71 94 58 73
Symlets 6 46X4 70 56 94 59 70
Reverse biorthogonal 6.8 43X4 64 70 91 77 74
Symlets 9 46X4 68 59 91 69 72
Biorthogonal 2.8 43X4 65 62 96 59 71
Biorthogonal 3.9 55X4 76 66 91 54 72
References
1. P. Kleihues & W. K. Cavenee. World Health Organization Classification of Tumours. Pathology and Genetics. Tumours of the
Nervous System. IARC Press, 2000.
2. P. Burger. “What is an oligodendroglioma?” Brain Pathol (2002) 12, pp. 257–259, 2002.
3. H. Qureshi, N. Rajpoot, K. Masood et al. “Classification of meningiomas using discriminant wavelet packets and learning vector quantization.” In Proceedings of Medical Image Understanding and Analysis. 2006.
4. H. Qureshi, N. Rajpoot, R. Wilson et al. “Comparative analysis of discriminant wavelet packet features and raw image features for classification of meningioma subtypes.” In Proceedings of Medical Image Understanding and Analysis. 2007.
5. B. Lessmann, V. Hans, A. Degenhard et al. “Feature space exploration of pathology images using content-based database visualization.” In Proceedings SPIE Medical Imaging. 2006.
6. M. Unser & M. Eden. “Multiresolution feature extraction and selection for texture segmentation.” IEEE Transactions on Pattern
Analysis and Machine Intelligence 11(7), pp. 717–728, 1989.
7. M. Unser. “Texture classification and segmentation using wavelet frames.” IEEE Transactions on Image Processing 4, pp. 1549– 15604, 1995.
8. M. M. Leung & A. M. Peterson. “Scale and rotation invariant texture classification.” In Record of The Twenty-Sixth Asilomar
Conference on Signals, Systems and Computers. 1992.
9. R. Porter & N. Canagarajah. “Gabor filters for rotation invariant texture classification.” In Proceedings of 1997 IEEE
Interna-tional Circuits and Systems. 1997.
10. N. Saito & R. R. Coiffman. “On local feature extraction for signal classification.” In Applied Analysis (O. Mahrenholtz and R.
Mennicken, eds.), special issue of Zeitschrift fur Angewandte Mathematik und Mechanik, Akademie-Verlag, Berlin. 1996.
11. N. Rajpoot. “Local discriminant wavelet packet basis for texture classification.” In Proceedings SPIE Wavelets X, San Diego,
California. 2003.
12. J. D. Villasenor, B. Belzer & J. Liao. “Wavelet filter evaluation for image compression.” IEEE Transaction on Image Processing
4 no.8, pp. 1053–1060, Aug. 1995.
13. A. Kaarna & J. Parkinen. “Wavelet filter selection in multispectral image compression.” In 15th International Conference on
Pattern Recognition ICPR 2000, volume 3. 2001.
14. A. Mojsilovic, D. Rackov & M. Popovic. “On the selection of an optimal wavelet basis for texture characterization.” In Proc.
Int. Conf. on Image Proc., pp. 678–682. 1998.
15. V. Vapnik. Statistical Learning Theory. Springer N.Y., 1998.