Journal of Social Research & Policy, Vol. 3, Issue 2, December 2012
Journal of Social Research & Policy, Vol. 3, Issue 2, December 2012 Online First
A validity study of the SSP-School
Inclusion Questionnaire
DIANA DĂMEAN
1Babeș-Bolyai University Cluj-Napoca, Romania
Abstract
The paper is based on the results of aresearch that aimed to identify the factors influencing school inclusion among disadvantaged students. The main outcome of the research was the development of the SSP-School Inclusion Questionnaire, intended to: (1) measure school inclusion levels among students; (2) identify students with significantly lower levels of school inclusion, who need to be included in intervention programs; and (3) measure the impact of intervention programs using subjectiveindicators (beneficiaries’ perception of school and teachers, feelings of safety in school, school performance). The questionnaire was completed by 480 vocational school students aged 15-19 from a large developed urban area (Cluj-Napoca) in Romania. The purpose of the research was to test the validity and reliability of the instrument and to propose it to professionals working in education (school psychologists, school counsellors etc.) for efficient data collection and for measuring the impact of educational intervention.
Keywords: SSP-School Inclusion Questionnaire, School Inclusion, Disadvantaged students, Vocational high-schools, Cluj-Napoca.
Theoretical background
Integration,as a psychological process of assimilation, can be achieved only in conjunction with social integration and is a process of incorporation of the individual into social systems: family, groups, classes, schools, community, society (OECD, 2007). Integrating a disadvantaged group of children refers to the ability of a group, class, school to assimilate new members who need support for adaptation, integration, socialization (OECD, 2007). On the other hand, inclusive education refers to the elimination of all learning barriers and ensures participation of all those vulnerable to exclusion and marginalization (UNESCO, 2000). It is a strategic approach designated to facilitate successful learning for all children. The first requirement of inclusive education is to decrease all forms of educational exclusion, until elimination. It proposes the provision of access, participation and successful learning for all children. The inclusive schools are open and friendly schools with a flexible curriculum and quality teaching practices that promote continuous assessment and educational partnerships (OECD, 2007).
In what concerns the choice of terminology, the term ‘integration’ is usually used to describe the process of the assimilation of students with learning difficulties, while the key aspect of ‘inclusion’ is that students who are at a disadvantage for any reason are not excluded from the mainstream education (Thomas, Walker & Webb, 1998, p.14). Therefore, ‘school inclusion’ is preferred to ‘school integration’ (Thomazet, 2009). Although some inclusive education studies may focus exclusively on disabled children (Miles & Singal, 2010), the present study will target the disadvantaged students. The term ‘disadvantaged’, as it is used in this paper, extends beyond
1 Postal Address: Faculty of Sociology and Social Work, Babes-Bolyai University, No. 126-130, Bd. 21 Decembrie 1989, Cluj-Napoca
134 | JSRP 2 | JSRP
special needs and includes other sources of marginalization, such as ethnicity and poverty (Bădescu, 2010; Topping & Maloney, 2005).
Despite the wide literature on school inclusion and participation, the research methods employed in order to measure and assess inclusive practices within schools are mainly qualitative, such as interviews, focus-groups and observations (Kugelmass, 2001; Dyson & Millward, 2000; Hunt et al, 2000; Kratzer, 1997; Deering, 1996; Pickett, 1994). While qualitative methods can facilitate an in-depth exploration of inclusion practices, a survey instrument would allow a more precise measurement of various school inclusion dimensions, the possibility to make comparisons between (groups of) students, as well as of measuring progress over time.
The purpose of the current research is to develop, test and validate a survey instrument to assess school inclusion. The theoretical framework for instrument development is informed by Skidmore’s (1998) functionalist approach of educational institutions, stating that inclusion difficulties arise from deficiencies in the ways in which schools are organized (in terms of personnel, regulations, activities etc.). After reviewing literature (Bădescu, 2010; Ainscow, & Miles, 2008; Ainscow, 2007; Booth, & Ainscow, 2007; Ainscow, Booth, & Dyson, 2006; Bowen, & Richman, 2005; Ainscow, Booth, & Dyson, 2004; Booth, & Ainscow, 2002; Lindsay, 2003) and examining several instruments, The School Success Profile-RO2 (SSP) was selected. The SSP
is a questionnaire that measures students’ school performance and their perception of their school, family, peer group and neighbourhood (Bowen & Richman, 2005; Hărăguş, Roth & Dămean, 2010; Mezei, Dămean & Dégi, 2010; Hărăguş, Dămean & Roth, 2009). A short version of this instrument was adapted for measuring dimensions of school inclusion such as positive perceptions of school and teachers, feelings of safety and non-discrimination, satisfactory school attendance, behaviour and performance. The instrument collects data directly from students and it reflects their own perceptions.
The new instrument (SSP-School Inclusion Questionnaire) has been piloted on a sample of vocational high-school students (aged 15-19) from a large urban area (Cluj-Napoca) in Romania. The students in vocational high-schools have significantly lower socio-economic status than other high-school students (Dămean & Todea, 2011), thus justifying the sample choice. Dyson, Howes & Roberts (2002) highlighted that the studies on school inclusion tend to be located in schools hich have been identified as inclusive and that direct report of outcome data are rare. The sample was designed to include all vocational high-schools in Cluj-Napoca, regardless of their inclusion policies. The article describes the methodology used for instrument validation.
The SSP-School Inclusion Questionnaire can respond to the following needs: (1) to identify the students who need intervention for school inclusion; (2) to evaluate whether the intervention has been successful; (3) to collect data on intervention efficacy (if completed pre- and post-intervention) and to provide an appropriate measurement for program evaluation.
The SSP-School Inclusion Questionnaire is designed for the professionals in the field of education (school psychologists, school social workers etc.) who want to: evaluate students’ levels of school inclusion; identify the risk of school drop-out among disadvantaged students in order to include them into intervention programs; measure quantitatively the impact of their intervention programs having thus the opportunity to demonstrate the efficacy of the programs; use the instrument in different contexts and environments (Roma communities, isolated rural communities etc.); make recommendations for the local or regional policy makers.
2 The School Success Profile-RO was translated and adapted as part of the research project PN-II 91063/18.10.2007-2010 financed by
CNMP, coordinated by dr. Maria Roth, Babes-Bolyai University (www.successcolar.ro), after The School Success Profile, created by G. L. Bowen and J. M. Richman, Jordan Institute for Families, University of North Carolina at Chapel Hill (www.schoolsuccessprofile.org).
Diana Dămean
JSRP JSRP | 135| 3
Method
The objective of the research was to develop and test an instrument to measure the needs, the results and the impact of the intervention programs that aim to improve educational inclusion and are targeted to students who belong to disadvantaged or marginalized communities. Therefore, the focus of this study is instrument assessment.
For the current study several SSP scales3 were used in order to measure school inclusion by taking
into consideration 4 key dimensions of school inclusion: perception of school as an educational environment institution, perception of teachers, feelings of safety, and performance. A number of Likert scales subscribes to each of these dimensions, as it follows: school –learning climate
and school satisfaction; teachers –teacher support, academic relevancy, and academic rigour; safety –school safety, personal safety in school, and non-victim status; performance – school engagement,
trouble avoidance, and grades.
The instrument was tested on a pilot sample of 44 respondents and was further amended (the items or scales that did not prove very reliable have been replaced with more suitable ones or eliminated). The final instrument used for data collection was a 172-item questionnaire that took about 30 minutes to complete (for vocational high-school students). The quantitative data was collected4 during April – June 2011.
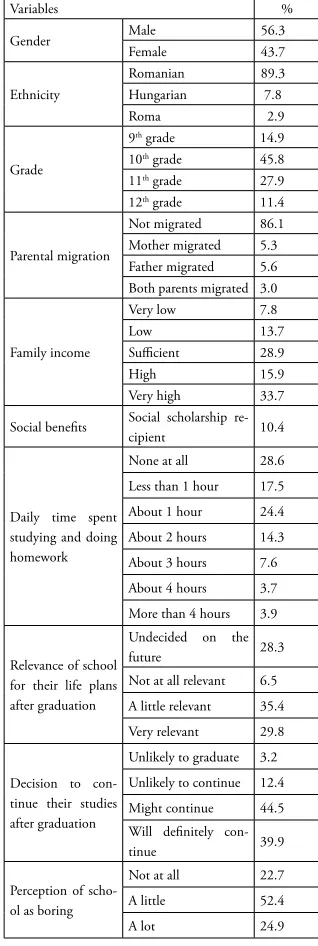
The research sample was composed of 480 students from 7 vocational high-schools in Cluj-Napoca. The sample included all vocational high-schools in Cluj-Napoca (a developed urban area from Transylvania), but the number of respondents in each school varied according to respondents’ presence in the classroom and availability. Table 1 displays the demographic characteristics of the sample. Although data on parents’ educational and occupational status was collected, the results are not presented due to the high non-response rate (around 50%). Respondents’ reports regarding their income were not very conclusive, as over one third rated their income as very high, whilst the poverty rate is highest among vocational schools. However, the answer choices of the 5-step scale measuring the income level were not appropriately formulated (1 - We do not have enough money; 2 - We hardly have enough money; 3 - We have just about enough money to not need to borrow; 4 - We manage to buy some more expensive things; 5 - We manage to have everything we need). Respondents who receive a form of social aid often answered ‘Wemanage to have everything we need’, which may be true, but does not reflect their income level accurately. Therefore, the answer choices will need to be rephrased into more precise ones. Also, data on ethnicity must be treated with caution, as the percentage of observed Roma students was much higher than the percentage of self-reported Roma students, meaning that many of them declared a different ethnicity (Romanian or Hungarian).
3 The permission for using any of the the School Success Profile-RO scales must be requested from the Centre for Evaluating the
Socio-Educational Profiles (CESEP), contact: [email protected].
4 Data was collected in partnership with the Romanian Foundation for Children, Community and Family (FRCCF) by Julia Todea
Várhegyi and Diana Dămean as part of the Strengthening the Evidence Based Practice of educational CSOs’ Initiative funded by the Education Support Program – Open Society Foundation.
A validity study of the SSP-School Inclusion Questionnaire
2 | JSRP
special needs and includes other sources of marginalization, such as ethnicity and poverty (Bădescu, 2010; Topping & Maloney, 2005).
Despite the wide literature on school inclusion and participation, the research methods employed in order to measure and assess inclusive practices within schools are mainly qualitative, such as interviews, focus-groups and observations (Kugelmass, 2001; Dyson & Millward, 2000; Hunt et al, 2000; Kratzer, 1997; Deering, 1996; Pickett, 1994). While qualitative methods can facilitate an in-depth exploration of inclusion practices, a survey instrument would allow a more precise measurement of various school inclusion dimensions, the possibility to make comparisons between (groups of) students, as well as of measuring progress over time.
The purpose of the current research is to develop, test and validate a survey instrument to assess school inclusion. The theoretical framework for instrument development is informed by Skidmore’s (1998) functionalist approach of educational institutions, stating that inclusion difficulties arise from deficiencies in the ways in which schools are organized (in terms of personnel, regulations, activities etc.). After reviewing literature (Bădescu, 2010; Ainscow, & Miles, 2008; Ainscow, 2007; Booth, & Ainscow, 2007; Ainscow, Booth, & Dyson, 2006; Bowen, & Richman, 2005; Ainscow, Booth, & Dyson, 2004; Booth, & Ainscow, 2002; Lindsay, 2003) and examining several instruments, The School Success Profile-RO2 (SSP) was selected. The SSP
is a questionnaire that measures students’ school performance and their perception of their school, family, peer group and neighbourhood (Bowen & Richman, 2005; Hărăguş, Roth & Dămean, 2010; Mezei, Dămean & Dégi, 2010; Hărăguş, Dămean & Roth, 2009). A short version of this instrument was adapted for measuring dimensions of school inclusion such as positive perceptions of school and teachers, feelings of safety and non-discrimination, satisfactory school attendance, behaviour and performance. The instrument collects data directly from students and it reflects their own perceptions.
The new instrument (SSP-School Inclusion Questionnaire) has been piloted on a sample of vocational high-school students (aged 15-19) from a large urban area (Cluj-Napoca) in Romania. The students in vocational high-schools have significantly lower socio-economic status than other high-school students (Dămean & Todea, 2011), thus justifying the sample choice. Dyson, Howes & Roberts (2002) highlighted that the studies on school inclusion tend to be located in schools hich have been identified as inclusive and that direct report of outcome data are rare. The sample was designed to include all vocational high-schools in Cluj-Napoca, regardless of their inclusion policies. The article describes the methodology used for instrument validation.
The SSP-School Inclusion Questionnaire can respond to the following needs: (1) to identify the students who need intervention for school inclusion; (2) to evaluate whether the intervention has been successful; (3) to collect data on intervention efficacy (if completed pre- and post-intervention) and to provide an appropriate measurement for program evaluation.
The SSP-School Inclusion Questionnaire is designed for the professionals in the field of education (school psychologists, school social workers etc.) who want to: evaluate students’ levels of school inclusion; identify the risk of school drop-out among disadvantaged students in order to include them into intervention programs; measure quantitatively the impact of their intervention programs having thus the opportunity to demonstrate the efficacy of the programs; use the instrument in different contexts and environments (Roma communities, isolated rural communities etc.); make recommendations for the local or regional policy makers.
2 The School Success Profile-RO was translated and adapted as part of the research project PN-II 91063/18.10.2007-2010 financed by
CNMP, coordinated by dr. Maria Roth, Babes-Bolyai University (www.successcolar.ro), after The School Success Profile, created by G. L. Bowen and J. M. Richman, Jordan Institute for Families, University of North Carolina at Chapel Hill (www.schoolsuccessprofile.org).
136 | JSRP 4 | JSRP
Table 1: Descriptive analysis of the sample
Variables %
Gender Male 56.3
Female 43.7
Ethnicity
Romanian 89.3
Hungarian 7.8
Roma 2.9
Grade
9th grade 14.9
10th grade 45.8
11th grade 27.9
12th grade 11.4
Parental migration
Not migrated 86.1
Mother migrated 5.3
Father migrated 5.6
Both parents migrated 3.0
Family income
Very low 7.8
Low 13.7
Sufficient 28.9
High 15.9
Very high 33.7
Social benefits Social scholarship
re-cipient 10.4
Daily time spent studying and doing homework
None at all 28.6
Less than 1 hour 17.5
About 1 hour 24.4
About 2 hours 14.3
About 3 hours 7.6
About 4 hours 3.7
More than 4 hours 3.9
Relevance of school for their life plans after graduation
Undecided on the
future 28.3
Not at all relevant 6.5
A little relevant 35.4
Very relevant 29.8
Decision to con-tinue their studies after graduation
Unlikely to graduate 3.2
Unlikely to continue 12.4
Might continue 44.5
Will definitely
con-tinue 39.9
Perception of scho-ol as boring
Not at all 22.7
A little 52.4
A lot 24.9
For instrument reliability and validityassessment 3 different methods were used: (1) Cronbach’s alpha; (2) bivariate Pearson correlations; and (3) Principal Component Analysis.
Diana Dămean
JSRP JSRP | 137| 5
Results
Descriptive analyses for each school inclusion scale are presented in Table 2. All scales report good internal consistency (with Cronbach’s alpha values between 0.7 and 0.9).
The scales were positively coded, so that minimum values indicate a negative attitude or perception, and maximum values indicate a positive attitude or perception. The mean scores indicate an overall positive tendency. However, all scales, except for Academic relevancy and
Grades, are negatively skewed (left-skewed), meaning that most values (including the median) concentrate on the right of the mean, with extreme values to the left. Therefore, even though most respondents report rather positive attitudes toward the school environment, the sample contains respondents who scored very low on most school inclusion scales, suggesting a risk situation and a need for intervention5.
Table 2:Descriptive statistics for the scales of the instrument
Scale Mean SEM Median Skewness No. of items Min. Max. Cronbach’s alpha
Learning climate 4.35 0.093 5 -0.507 7 0 7 0.81
School satisfaction 3.70 0.104 4 -0.045 7 0 7 0.84
Teacher support 4.42 0.121 5 -0.155 8 0 8 0.90
Academic relevancy 20.23 0.234 20 0.049 8 8 32 0.89
Academic rigour 23.31 0.202 24 -0.547 10 10 30 0.87
School safety 33.01 0.290 34 -0.472 12 12 48 0.88
Personal safety in school 10.68 0.168 11 -0.203 4 4 16 0.89
Non-victim status 31.60 0.189 33 -1.018 12 12 36 0.87
School engagement 6.66 0.072 7 -0.404 3 3 9 0.70
Trouble avoidance 25.59 0.217 26 -0.810 11 11 33 0.85
Grades 9.45 0.102 9 0.032 15 3 15 0.70
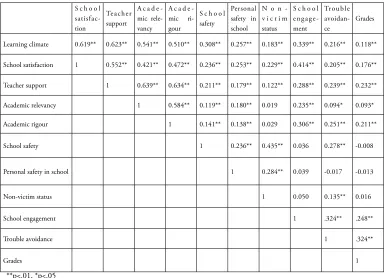
Next, bivariate Pearson correlations were run between all scales (Table 3) as well as between all items of each scale. Since the 4 dimensions of the instrument are inter-related by default, significant positive correlations were expected between scales. It is worth noting here how respondents’ school performance relates to their perception of their school, of their teachers, and of school safety.
5 Permission for instrument use and details regarding score interpretation can be requested from the Centre for Evaluating
Socio-Educational Profiles (CESEP), [email protected].
A validity study of the SSP-School Inclusion Questionnaire
4 | JSRP
Table 1: Descriptive analysis of the sample
Variables %
Gender Male 56.3
Female 43.7
Ethnicity
Romanian 89.3
Hungarian 7.8
Roma 2.9
Grade
9th grade 14.9
10th grade 45.8
11th grade 27.9
12th grade 11.4
Parental migration
Not migrated 86.1
Mother migrated 5.3
Father migrated 5.6
Both parents migrated 3.0
Family income
Very low 7.8
Low 13.7
Sufficient 28.9
High 15.9
Very high 33.7
Social benefits Social scholarship
re-cipient 10.4
Daily time spent studying and doing homework
None at all 28.6
Less than 1 hour 17.5
About 1 hour 24.4
About 2 hours 14.3
About 3 hours 7.6
About 4 hours 3.7
More than 4 hours 3.9
Relevance of school for their life plans after graduation
Undecided on the
future 28.3
Not at all relevant 6.5
A little relevant 35.4
Very relevant 29.8
Decision to con-tinue their studies after graduation
Unlikely to graduate 3.2
Unlikely to continue 12.4
Might continue 44.5
Will definitely
con-tinue 39.9
Perception of scho-ol as boring
Not at all 22.7
A little 52.4
A lot 24.9
For instrument reliability and validityassessment 3 different methods were used: (1) Cronbach’s alpha; (2) bivariate Pearson correlations; and (3) Principal Component Analysis.
138 | JSRP
6 | JSRP
Table 3: Correlations between school inclusion scales
S c h o o l satisfac-tion
Teacher support
A c a d e -mic rele-vancy
A c a d e -mic ri-gour
S c h o o l safety
Personal safety in school
N o n -v i c t i m status
S c h o o l engage-ment Trouble avoidan-ce Grades
Learning climate 0.619** 0.623** 0.541** 0.510** 0.308** 0.257** 0.183** 0.339** 0.216** 0.118**
School satisfaction 1 0.552** 0.421** 0.472** 0.236** 0.253** 0.229** 0.414** 0.205** 0.176**
Teacher support 1 0.639** 0.634** 0.211** 0.179** 0.122** 0.288** 0.239** 0.232**
Academic relevancy 1 0.584** 0.119** 0.180** 0.019 0.235** 0.094* 0.093*
Academic rigour 1 0.141** 0.138** 0.029 0.306** 0.251** 0.211**
School safety 1 0.236** 0.435** 0.036 0.278** -0.008
Personal safety in school 1 0.284** 0.039 -0.017 -0.013
Non-victim status 1 0.050 0.135** 0.016
School engagement 1 .324** .248**
Trouble avoidance 1 .324**
Grades 1
**p<.01, *p<.05
Respondents who have a higher school satisfaction and perceive a more positive learning climate are also more engaged in school. The same applies for students who have a positive perception of their teachers. No significant relation was found between school safety and school engagement. School safety is strongly related to respondents’ behaviour in school (trouble avoidance), and so are teachers’ academic rigour and teacher support. Higher grades do not correlate with feeling safe in school, but with higher teacher support and higher academic rigour. Also, the items of each scale were positively inter-correlated, indicating that they all measure the same factor.
In order to validate the instrument, principal component analysis was used. All items in each scale were expected to load satisfactory on one underlying factor. The extraction method used was Principal Component Analysis and the rotation method used was Varimax with Kaiser Normalization. For easier reading of the matrices, values under .40 have been suppressed (see Appendix).
For each indicator, the Kaiser-Meyer-Olkin (KMO) measure of sampling adequacy is displayed. The KMO must have values above 0.50 for satisfactory factor analysis to proceed. The KMO values on all scales show that the sample size is adequate.
First, the components were extracted based on the Eigenvalue (criteria: Eigenvalue > 1). Following this procedure, in 5 scales more than 1 component has been extracted (Eigenvalue > 1):
School satisfaction (2 components), Academic rigour (2 components), School safety (2 components),
Non-victim status (3 components), and Trouble avoidance (2 components).
The Eigenvalue for components 2 and 3 was very close to 1, suggesting that these components were rather weak. Therefore, a fixed number of components (1) was extracted on all scales, forcing the items to load on the component with the highest Eigenvalue. The items of each indicator loaded satisfactory on one component, indicating the scales are valid and measure what they were designed to measure.
Diana Dămean 138 | JSRP
4 | JSRP
Table 1: Descriptive analysis of the sample
Variables %
Gender Male 56.3
Female 43.7 Ethnicity Romanian 89.3 Hungarian 7.8 Roma 2.9 Grade
9th grade 14.9
10th grade 45.8
11th grade 27.9
12th grade 11.4
Parental migration
Not migrated 86.1
Mother migrated 5.3
Father migrated 5.6
Both parents migrated 3.0
Family income
Very low 7.8
Low 13.7
Sufficient 28.9
High 15.9
Very high 33.7
Social benefits Social scholarship
re-cipient 10.4
Daily time spent studying and doing homework
None at all 28.6
Less than 1 hour 17.5
About 1 hour 24.4
About 2 hours 14.3
About 3 hours 7.6
About 4 hours 3.7
More than 4 hours 3.9
Relevance of school for their life plans after graduation
Undecided on the
future 28.3
Not at all relevant 6.5
A little relevant 35.4
Very relevant 29.8
Decision to con-tinue their studies after graduation
Unlikely to graduate 3.2
Unlikely to continue 12.4
Might continue 44.5
Will definitely
con-tinue 39.9
Perception of scho-ol as boring
Not at all 22.7
A little 52.4
A lot 24.9
For instrument reliability and validityassessment 3 different methods were used: (1) Cronbach’s alpha; (2) bivariate Pearson correlations; and (3) Principal Component Analysis.
JSRP JSRP | 139| 7
Conclusions
The outcome of the present study was the development of an efficient and reliable instrument to measure the school inclusion of disadvantaged students with the purpose of identifying the ones who need to benefit from intervention programs. This instrument is offered to school professionals and to anyone working in the field of education. The instrument is useful not only in terms of identifying the school inclusion problems or identifying the respondents who may need to be included in intervention programs, but also for drafting evidence based recommendations for school policies. Although validity tests indicated a good internal consistency of the scales, the use of additional objective measurements of school inclusion is encouraged.
A limit of the study is that the survey conducted in schools provided data only for the students who were present and willing to complete the questionnaire. It is possible that the mean scores would have been lower if the students who are very often absent had completed the questionnaire. In addition, the measurement used for poverty (self-reported income size) was not reliable. For future studies, the use of consumption is recommended as the basis for calculating financial indicators (Bădescu, 2010, p.9).
In the course of this study, various areas where further research was needed were identified: the development of a methodology for evaluating how inclusive schools and teachers are; the use of other theoretical perspectives in the study of school inclusion; the development of recommendations for school policies.
Acknowledgement
This work was possible with the financial support of the Sectoral Operational Programme for Human Resources Development 2007-2013, co-financed by the European Social Fund, under the project number POSDRU 89/1.5/S/60189 with the title ‘Postdoctoral Programs for Sustainable Development in a Knowledge Based Society’
References
1. Ainscow, M. (2007). Taking an inclusive turn. Journal of Research in Special Educational Needs, 7(1), pp.3-7.http://dx.doi.org/10.1111/j.1471-3802.2007.00075.x
2. Ainscow, M., Booth, T., & Dyson, A. (2006). Improving schools, developing inclusion. London: Routledge.
3. Ainscow, M., Booth, T., & Dyson, A. (2004). Understanding and developing inclusive practices in schools: a collaborative action research network. International Journal of Inclusive Education, 8(2), pp.125-140. http://dx.doi.org/10.1080/1360311032000158015
4. Ainscow, M., & Miles, S. (2008). Making Education for All Inclusive: Where Next? Prospects, 38(1), pp.15-34. http://dx.doi.org/10.1007/s11125-008-9055-0
5. Bădescu, G. (2010). Social inclusion through education: a literature review. ESP Working Paper Series, No.8.
A validity study of the SSP-School Inclusion Questionnaire 6 | JSRP
Table 3: Correlations between school inclusion scales
S c h o o l satisfac-tion
Teacher support
A c a d e -mic rele-vancy
A c a d e -mic ri-gour
S c h o o l safety
Personal safety in school
N o n -v i c t i m status
S c h o o l engage-ment
Trouble avoidan-ce
Grades
Learning climate 0.619** 0.623** 0.541** 0.510** 0.308** 0.257** 0.183** 0.339** 0.216** 0.118**
School satisfaction 1 0.552** 0.421** 0.472** 0.236** 0.253** 0.229** 0.414** 0.205** 0.176**
Teacher support 1 0.639** 0.634** 0.211** 0.179** 0.122** 0.288** 0.239** 0.232**
Academic relevancy 1 0.584** 0.119** 0.180** 0.019 0.235** 0.094* 0.093*
Academic rigour 1 0.141** 0.138** 0.029 0.306** 0.251** 0.211**
School safety 1 0.236** 0.435** 0.036 0.278** -0.008
Personal safety in school 1 0.284** 0.039 -0.017 -0.013
Non-victim status 1 0.050 0.135** 0.016
School engagement 1 .324** .248**
Trouble avoidance 1 .324**
Grades 1
**p<.01, *p<.05
Respondents who have a higher school satisfaction and perceive a more positive learning climate are also more engaged in school. The same applies for students who have a positive perception of their teachers. No significant relation was found between school safety and school engagement. School safety is strongly related to respondents’ behaviour in school (trouble avoidance), and so are teachers’ academic rigour and teacher support. Higher grades do not correlate with feeling safe in school, but with higher teacher support and higher academic rigour. Also, the items of each scale were positively inter-correlated, indicating that they all measure the same factor.
In order to validate the instrument, principal component analysis was used. All items in each scale were expected to load satisfactory on one underlying factor. The extraction method used was Principal Component Analysis and the rotation method used was Varimax with Kaiser Normalization. For easier reading of the matrices, values under .40 have been suppressed (see Appendix).
For each indicator, the Kaiser-Meyer-Olkin (KMO) measure of sampling adequacy is displayed. The KMO must have values above 0.50 for satisfactory factor analysis to proceed. The KMO values on all scales show that the sample size is adequate.
First, the components were extracted based on the Eigenvalue (criteria: Eigenvalue > 1). Following this procedure, in 5 scales more than 1 component has been extracted (Eigenvalue > 1):
School satisfaction (2 components), Academic rigour (2 components), School safety (2 components),
Non-victim status (3 components), and Trouble avoidance (2 components).
The Eigenvalue for components 2 and 3 was very close to 1, suggesting that these components were rather weak. Therefore, a fixed number of components (1) was extracted on all scales, forcing the items to load on the component with the highest Eigenvalue. The items of each indicator loaded satisfactory on one component, indicating the scales are valid and measure what they were designed to measure.
140 | JSRP 8 | JSRP
6. Booth, T., & Ainscow, M. (2007). Breaking down the barriers: the index for inclusion. Bristol: Centre for Studies on Inclusive Education.
7. Booth, T., & Ainscow, M. (2002). Index for inclusion: Developing learning and participation in schools. Bristol: Centre for Studies on Inclusive Education.
8. Bowen, G. L., & Richman, J. M. (2005). The School Success Profile. University of North Carolina at Chapel Hill: Jordan Institute for Families.
9. Dămean, D., & Todea, J. (2011). Ghid metodologic pentru implementarea proiectelor de integrare școlară a elevilor dezavantajați. Cluj-Napoca: FRCCF.
10. Deering, P. (1996). An ethnographic study of norms of inclusion and cooperation in a multi-ethnic middle school. Urban Review 28(1), pp.21-40.
http://dx.doi.org/10.1007/BF02354376
11. Dyson, A., Millward, A. (2000). Schools and special needs: issues of innovation and inclusion. London: Paul Chapman.
12. Dyson, A., Howes, A., & Roberts, B. (2002). A Systematic Review of the Effectiveness of school-level actions for promoting participation by all students. Retrieved March 23, 2011, from http:// eppi.ioe.ac.uk/cms/LinkClick.aspx?fileticket=juIcqkP5Q8U%3d&tabid=276&mid=1096
13. Hărăguş, T.P., Dămean, D., & Roth, M. (2009). Proprietăţi psihometrice ale unui nou instrument de evaluare a performanţelor şcolare: Profilul Succesului Şcolar. In M. Roth, D. Dămean & M. Iovu (Eds.), Succesul şcolar la intersecţia factorilor sociali (pp.23-40). Cluj-Napoca: Presa Universitară Clujeană.
14. Hărăguş, T.P., Roth, M., & Dămean, D. (2010). The Measurement of the Social Dimensions of School Success – A Validity Study of the Romanian Version of the School Success Profile.
Studia Universitatis Babes-Bolyai Sociologia, 1/2010, pp.31-56.
15. Hărăguş, T.P., Roth, M., & Mezei, E. (2010). Validitatea și fidelitatea Profilului Succesului Şcolar în România. Cluj-Napoca: Presa Universitară Clujeana.
16. Hunt, P., Hirose-Hatae, A., Doering, K., Karasoff, P., Goetz, L. (2000). ‘Community’ is what I think everyone is talking about. Remedial & Special Education,21(5), pp.305-317. http://dx.doi.org/10.1177/074193250002100507
17. Kratzer, C. (1997). Community and diversity in an urban school: co-existence or conflict? Report by the Graduate School of Education & Information Studies, University of California, Los Angeles.
18. Kugelmass, J. (2001). Collaboration and compromise in creating and sustaining an inclusive school. International Journal of Inclusive Education,5(1), pp.47-65.
http://dx.doi.org/10.1080/13603110121498
19. Lindsay, G. (2003). Inclusive education: a critical perspective. British Journal of Special Education, 30(1), pp.3-12.http://dx.doi.org/10.1111/1467-8527.00275
Diana Dămean
JSRP JSRP | 141| 9
20. Mezei, E., Dămean, D., & Dégi, C. (2010). The School Success Profile: confirmatory factor analysis on a representative Romanian sample. In D. Dămean, M. Roth, C. Dégi & L. Văetişi (Eds.), The Social Ecology of School Success: Implications for Policy and Practice (pp.21-66). Cluj-Napoca: Cluj University Press.
21. Miles, S., & Singal, N. (2010). The education for all and inclusive education debate: conflict, contradiction or opportunity? International Journal of Inclusive Education, 14(1), pp.1-15. http://dx.doi.org/10.1080/13603110802265125
22. OECD (2007). Education Policies for Students at Risk and those with Disabilities in South Eastern Europe: Bosnia-Herzegovina, Bulgaria, Croatia, Kosovo, FYR of Macedonia, Moldova, Montenegro, Romania and Serbia. Paris: OECD.
23. Pickett, R. (1994). The relationship between school structure and culture and student views of diversity and inclusive education: a comparative case study of two middle schools. Unpublished PhD thesis, University of Wisconsin.
24. Skidmore, D. (1998). Continuities and developments in research into the education of pupils with learning difficulties. British Journal of Educational Studies, 47(1), pp.3-16. http://dx.doi.org/10.1111/1467-8527.00099
25. Thomas, G., Walker, D., & Webb, J. (1998). The making of the inclusive school. London: Routledge.
26. Thomazet, S. (2009). From integration to inclusive education: does changing the terms improve practice? International Journal of Inclusive Education, 13(6), pp.553-563.
http://dx.doi.org/10.1080/13603110801923476
27. Topping, K., & Maloney, S. (Eds.). (2005). The Routledge Falmer Reader in Inclusive Education, Abingdon: Routledge Falmer.
28. UNESCO (2000). Education for All 2000 Assessment. France: UNESCO.
A validity study of the SSP-School Inclusion Questionnaire
8 | JSRP
6. Booth, T., & Ainscow, M. (2007). Breaking down the barriers: the index for inclusion. Bristol: Centre for Studies on Inclusive Education.
7. Booth, T., & Ainscow, M. (2002). Index for inclusion: Developing learning and participation in schools. Bristol: Centre for Studies on Inclusive Education.
8. Bowen, G. L., & Richman, J. M. (2005). The School Success Profile. University of North Carolina at Chapel Hill: Jordan Institute for Families.
9. Dămean, D., & Todea, J. (2011). Ghid metodologic pentru implementarea proiectelor de integrare școlară a elevilor dezavantajați. Cluj-Napoca: FRCCF.
10. Deering, P. (1996). An ethnographic study of norms of inclusion and cooperation in a multi-ethnic middle school. Urban Review 28(1), pp.21-40.
http://dx.doi.org/10.1007/BF02354376
11. Dyson, A., Millward, A. (2000). Schools and special needs: issues of innovation and inclusion. London: Paul Chapman.
12. Dyson, A., Howes, A., & Roberts, B. (2002). A Systematic Review of the Effectiveness of school-level actions for promoting participation by all students. Retrieved March 23, 2011, from http:// eppi.ioe.ac.uk/cms/LinkClick.aspx?fileticket=juIcqkP5Q8U%3d&tabid=276&mid=1096
13. Hărăguş, T.P., Dămean, D., & Roth, M. (2009). Proprietăţi psihometrice ale unui nou instrument de evaluare a performanţelor şcolare: Profilul Succesului Şcolar. In M. Roth, D. Dămean & M. Iovu (Eds.), Succesul şcolar la intersecţia factorilor sociali (pp.23-40). Cluj-Napoca: Presa Universitară Clujeană.
14. Hărăguş, T.P., Roth, M., & Dămean, D. (2010). The Measurement of the Social Dimensions of School Success – A Validity Study of the Romanian Version of the School Success Profile.
Studia Universitatis Babes-Bolyai Sociologia, 1/2010, pp.31-56.
15. Hărăguş, T.P., Roth, M., & Mezei, E. (2010). Validitatea și fidelitatea Profilului Succesului Şcolar în România. Cluj-Napoca: Presa Universitară Clujeana.
16. Hunt, P., Hirose-Hatae, A., Doering, K., Karasoff, P., Goetz, L. (2000). ‘Community’ is what I think everyone is talking about. Remedial & Special Education,21(5), pp.305-317. http://dx.doi.org/10.1177/074193250002100507
17. Kratzer, C. (1997). Community and diversity in an urban school: co-existence or conflict? Report by the Graduate School of Education & Information Studies, University of California, Los Angeles.
18. Kugelmass, J. (2001). Collaboration and compromise in creating and sustaining an inclusive school. International Journal of Inclusive Education,5(1), pp.47-65.
http://dx.doi.org/10.1080/13603110121498
19. Lindsay, G. (2003). Inclusive education: a critical perspective. British Journal of Special Education, 30(1), pp.3-12.http://dx.doi.org/10.1111/1467-8527.00275
142 | JSRP 10 | JSRP
Appendix
Principal Component Analysis
1. Learning climate (KMO=.840)
Items Component
1
Every student is important at this school. 0.470
This is a very good school to attend. 0.744
Adults at this school welcome ideas and opinions from students. 0.747
Students get a good education at this school. 0.845
Teachers at this school care about students. 0.804
The principal of this school cares whether or not students come to
school. 0.646
This school suits me. 0.588
Eigenvalue 3.45
2. School satisfaction (KMO = .824)
Component Extracted Component
1 2 1
I enjoy going to this school. 0.747 0.740
I get along well with other students at this school. 0.883 0.561
I feel close to my classmates. 0.857 0.629
I get along well with my teachers at this school. 0.755 0.702
I am getting a good education at this school. 0.831 0.775
I feel I belong in this school. 0.787 0.844
I am happy I am studying in this school. 0.700 0.731
Eigenvalue 3.59 1.13 3.59
3. Teacher support (KMO=.931)
Items Component
1
My teachers care about me. 0.824
My teachers listen to what I have to say. 0.818
My teachers care whether or not I come to school. 0.731
I receive a lot of encouragement from my teachers. 0.836
I am respected and appreciated by my teachers. 0.832
My teachers know my qualities. 0.725
My teachers praise my efforts when I work hard. 0.729
My teachers evaluate me correctly. 0.644
Eigenvalue 4.74
Diana Dămean
JSRP JSRP | 143| 11
4. Academic relevancy (KMO=.897)
Items Component
1
My teachers tell me many things about different jobs or careers. 0.689
My teachers ask me about my interest in future jobs or careers. 0.761
My teachers help me connect what I learn in class to the outer world. 0.811
My teachers help me understand the importance of the things I learn
in school. 0.749
My teachers help me connect what I learn in class to my own
inte-rests and experiences. 0.787
In class, my teachers are using examples related to jobs or careers. 0.762
My teachers help me connect what I learn in class to possible jobs
or careers. 0.834
My teachers discuss with me my future as an adult. 0.735
Eigenvalue 4.70
5. Academic rigour (KMO=.894)
Items Component Extracted Component
1 2 1
They expect me to succeed in what I do. 0.746 0.665
They demand a lot from me. 0.505 0.562
They stimulate me to succeed in school. 0.694 0.682
They give me homework that makes me think. 0.876 0.684
They tell me when I do less than I am capable of. 0.583 0.408 0.710
They encourage me when they think I can do better. 0.732 0.733
They ask questions that make me think. 0.602 0.712
They give me homework I have to work hard for. 0.845 0.705
They tell me how to improve my school performance. 0.554 0.748
They acknowledge my efforts when I do a good job. 0.730 0.679
Eigenvalue 4.75 1.02 4.75
6. School safety (KMO = .899)
Items Component Extracted Component
1 2 1
Students making fun of other students. 0.773 0.636
Students picking on other students. 0.771 0.697
Disagreements between students from different ethnic groups. 0.618 0.657
Fights among students. 0.578 0.688
Destruction of school property. 0.572 0.455 0.728
Student use of alcohol. 0.649 0.715
Students who smoke cigarettes. 0.676 0.512
Student use of illegal drugs. 0.695 0.720
Students carrying weapons (knives, clubs). 0.815 0.664
Gangs. 0.649 0.652
Students verbally abusing teachers. 0.639 0.700
Students physically abusing teachers. 0.772 0.530
Eigenvalue 5.25 1.40 5.25
A validity study of the SSP-School Inclusion Questionnaire
10 | JSRP
Appendix
Principal Component Analysis
1. Learning climate (KMO=.840)
Items Component
1
Every student is important at this school. 0.470
This is a very good school to attend. 0.744
Adults at this school welcome ideas and opinions from students. 0.747
Students get a good education at this school. 0.845
Teachers at this school care about students. 0.804
The principal of this school cares whether or not students come to
school. 0.646
This school suits me. 0.588
Eigenvalue 3.45
2. School satisfaction (KMO = .824)
Component Extracted Component
1 2 1
I enjoy going to this school. 0.747 0.740
I get along well with other students at this school. 0.883 0.561
I feel close to my classmates. 0.857 0.629
I get along well with my teachers at this school. 0.755 0.702
I am getting a good education at this school. 0.831 0.775
I feel I belong in this school. 0.787 0.844
I am happy I am studying in this school. 0.700 0.731
Eigenvalue 3.59 1.13 3.59
3. Teacher support (KMO=.931)
Items Component
1
My teachers care about me. 0.824
My teachers listen to what I have to say. 0.818
My teachers care whether or not I come to school. 0.731
I receive a lot of encouragement from my teachers. 0.836
I am respected and appreciated by my teachers. 0.832
My teachers know my qualities. 0.725
My teachers praise my efforts when I work hard. 0.729
My teachers evaluate me correctly. 0.644
Eigenvalue 4.74
144 | JSRP
12 | JSRP
7. Personal safety in school (KMO=.841)
Items Component
1
At school I feel protected from violence 0.880
At school I feel protected from theft 0.904
At school I feel protected from insults 0.816
At school I feel protected from blackmail 0.901
Eigenvalue 3.07
8. Non-victim status (KMO=.893)
Items Component Extracted Component
1 2 3 1
Someone from school insulted you. 0.799 0.682
Someone from school treated you bad. 0.782 0.737
Someone from school ignored you when you asked a question. 0.623 0.623
Someone from school excluded you from an activity you
wan-ted to take part in. 0.663 0.559
Someone from school wrongly suspected that you did
so-mething bad. 0.704 0.600
Someone from school treated you unfair. 0.690 0.666
Someone from school discouraged you from doing something
important for you. 0.565 0.594
Someone from school insulted you because you are Hungarian
or Roma. 0.719 0.502
Someone from school insulted you because you do not have
much money. 0.773 0.618
Someone from school picked on you. 0.694 0.473 0.784
Someone from school threatened to beat you. 0.557 0.0567 0.695
Someone from school pushed or hit you. 0.474 0.633 0.688
Eigenvalue 5.07 1.22 1.06 5.07
9. School engagement (KMO=.662)
Items Component
1 0.751
I look forward to learning new things at school. 0.800
0.826
Eigenvalue 1.88
Diana Dămean 144 | JSRP
4 | JSRP
Table 1: Descriptive analysis of the sample
Variables %
Gender Male 56.3
Female 43.7
Ethnicity
Romanian 89.3
Hungarian 7.8
Roma 2.9
Grade
9th grade 14.9
10th grade 45.8
11th grade 27.9
12th grade 11.4
Parental migration
Not migrated 86.1
Mother migrated 5.3
Father migrated 5.6
Both parents migrated 3.0
Family income
Very low 7.8
Low 13.7
Sufficient 28.9
High 15.9
Very high 33.7
Social benefits Social scholarship
re-cipient 10.4
Daily time spent studying and doing homework
None at all 28.6
Less than 1 hour 17.5
About 1 hour 24.4
About 2 hours 14.3
About 3 hours 7.6
About 4 hours 3.7
More than 4 hours 3.9
Relevance of school for their life plans after graduation
Undecided on the
future 28.3
Not at all relevant 6.5
A little relevant 35.4
Very relevant 29.8
Decision to con-tinue their studies after graduation
Unlikely to graduate 3.2
Unlikely to continue 12.4
Might continue 44.5
Will definitely
con-tinue 39.9
Perception of scho-ol as boring
Not at all 22.7
A little 52.4
A lot 24.9
For instrument reliability and validityassessment 3 different methods were used: (1) Cronbach’s alpha; (2) bivariate Pearson correlations; and (3) Principal Component Analysis.
JSRP JSRP | 145| 13
10. Trouble avoidance (KMO=.883)
Items Component
Extracted Component
1 2 1
I turned in a homework assignment late or not at all. 0.493 0.288
I showed up for school late (unexcused). 0.711 0.634
I cut at least one class. 0.813 0.639
I did not go to school (unexcused). 0.775 0.702
I misbehaved in class. 0.637 0.438 0.772
A teacher gave me a warning because of my attendance or behaviour. 0.615 0.491 0.787
I had to see the principal because of problems with my attendance
or behaviour. 0.734 0.589
My parent(s)/guardian(s) received a warning about my attendance or
behaviour. 0.708 0.675
My parent(s)/guardian(s) received a warning about my grades or
ho-mework. 0.697 0.659
I got into an argument with one of my teachers. 0.693 0.733
I got in a physical fight with another student. 0.711 0.601
Eigenvalue 4.73 1.34 4.73
Note: the highlighted value is too low, indicating the item may be dropped from the scale.
11. Grades (KMO = .650)
Items Component
1
What was your general average grade last semester? 0.840
How many average grades below 5 did you make last semester? 0.741
Compared to the other students in your class, how would you describe your average
grades from last semester? 0.791
Eigenvalue 1.88
A validity study of the SSP-School Inclusion Questionnaire 12 | JSRP
7. Personal safety in school (KMO=.841)
Items Component
1
At school I feel protected from violence 0.880
At school I feel protected from theft 0.904
At school I feel protected from insults 0.816
At school I feel protected from blackmail 0.901
Eigenvalue 3.07
8. Non-victim status (KMO=.893)
Items Component Extracted Component
1 2 3 1
Someone from school insulted you. 0.799 0.682
Someone from school treated you bad. 0.782 0.737
Someone from school ignored you when you asked a question. 0.623 0.623
Someone from school excluded you from an activity you
wan-ted to take part in. 0.663 0.559
Someone from school wrongly suspected that you did
so-mething bad. 0.704 0.600
Someone from school treated you unfair. 0.690 0.666
Someone from school discouraged you from doing something
important for you. 0.565 0.594
Someone from school insulted you because you are Hungarian
or Roma. 0.719 0.502
Someone from school insulted you because you do not have
much money. 0.773 0.618
Someone from school picked on you. 0.694 0.473 0.784
Someone from school threatened to beat you. 0.557 0.0567 0.695
Someone from school pushed or hit you. 0.474 0.633 0.688
Eigenvalue 5.07 1.22 1.06 5.07
9. School engagement (KMO=.662)
Items Component
1 0.751
I look forward to learning new things at school. 0.800
0.826
Eigenvalue 1.88