Effect Of Different Levels Of Nitrogen On Growth
And Yield Attributes Of Different Varieties Of
Basmati Rice (
Oryza Sativa L.)
Tanweer Hussain Malik, S. B. Lal, Nasir Rashid Wani, Deelak Amin, Rayees Ahmad Wani
ABSTRACT : A field trail was conducted during rainy season at crop research farm Allahabad agriculture institute (Deemed university) to evaluate the effect of different levels of nitrogen on growth and yield attributes of different varieties of Basmati Rice (Oryza Sativa L.). The varieties which was evaluated were Haryana Basmati-1 , Basmati -370 and Pusa basmati -1 under three different fertility levels viz; 100 , 120 and 140 the combinations was replicated three times in factorial 3² (RBD). The varietal trial indicates that Pusa Basmati- 1 at nitrogen -120 level was significantly different from all the parameters measured which include plant height number of tillers/hill , dry weight , length of panicle , number of filled grains / panicle , straw yield , biological yield , harvest index, benefit cost ratio and grain yield of 4.66 tonnes / hectare at level nitrogen level-120 , 3.10 tons / hectare at nitrogen level -120 were maximum and minimum in Pusa basmati -1 and Basmati -370 respectively .
Index Terms: Basmati rice, nitrogen levels, varieties, Economic analysis and benefit cost ratio.
————————————————————
1 Introduction
The rice is the most widely grown cereal crop and is stable food for more than half of the world’s population .The unique varietal group that has distinguished itself as a result of natural and human selection which found wider acceptance all over the world as a specialty rice is called “Basmati rice”. The unique feature of “basmati Rice” such as extra long slender grain , length wise excessive elongation on cooking , soft and fluffy texture of cooked rice , and pleasant aroma which together determine uniqueness of “Basmati Rice” .Aside their cooking quality , “Basmati Rice’s” are also reported to have low glecemic index and are micro nutrient rich epically for iron and zinc [3]. Unlike other aromatic rice’s the unique quality traits of Basmati Rice” found there expression only when they are grown in the north western foot hills of Himalayas in the Indian sub Continent . Basmati has attained “Heritage rice” status as it is considered as “Farmers Cultivar” being maintained and grown by farmers of Punjab regions of India and Pakistan . In India its different varieties are mostly cultivated in the districts of karnal , Panipat , Kurukshetra, Kaithal , Amritsar, Fatahgarh, Gurdaspur , Hoshairpor , Jalandhar , Patiala and Sangruoor in Punjab ,Kangra , Solen,una , Mandi in Himachal Pardesh Bundi in Rajasthan and in several districts of Uttarpardesh . Basmati is grown in limited areas of extent in Jammu and Kashmir also [1].
There is substantial increase of Basmati in traditional Basmati growing areas .The largest areas under Basmati Rice is in Haryana 60% . Followed by UP 17.1% and Punjab 16.1% . During 1998-99 the state contributed nearly 55% of the total Basmati rice production in the country followed by UP at 23.5% and Punjab at 12.4%. The productivity ranges from 15-18 qunatial / hectare . The less production of Basmati rice is known for its tall and week stature of the plant causing lodging besides susceptibility of pests and diseases and less number of spikelets /panicle [2].
2 MATERIALS AND METHODS
The experiment was carried out at the crop research farm Allahabad agriculture institute (Deemed University). The experiment site lies between 25- 27° N latitude, 8.5°E Longitude and 98 meters altitude. The climate is characterized by the alternate hot rainy season from late June to early September with mean temperature of 38°C. The soil was sandy loam in texture with PH of 8.0 containing 160.12 available nitrogen 2.21 available phosphorus and 263.27 available potassium kg / hectare. Three varieties Haryana Basmati -1 , Basmati -370 and Pusa Basmati -1 , Nitrogen levels 100, 120 and 140 was replicated three times factorial 3² randomized block design. Nursery was prepared twenty five days before transplanting. Thirteen varieties were sown in nursery and three varieties were selected for the varietal trail . Field preparation was done by giving one ploughing followed by harrowing after puddling the field . The twenty five days seedling was transplanted at the spacing of 20 cm( R X R) and 15 cm( P x P ). To seedlings at the depth of 2-3 cm depth was transplanted . Entire dose of phosphorus and potassium as diammonium phosphate and murates of potash was applied as a basal dose and half of nitrogen was incorporated thoroughly into the soil at the time of final puddling , remaining the half quantity of nitrogen one fourth at 25 days at maximum tillering and one fourth at 55 days a panicle initiation . 5cm water was maintained in the field epically from tillering to hard dough stage. Two normal hand weeding was done with the help of “Khurpi” after 30 days after transplanting and 50 days after transplanting one quadrate (1 m)² was harvested in every plot for the ________________________
Tanweer Hussain Malik is currently working in department of agriculture, Government of Jammu and Kashmir, India
S. B. Lal is currently HOD (Forestry and Environmental Sciences) AAIDU, Allahabad, India Nasir Rashid Wani, Ph.D Forestry, Faculty of
Forestry, SKUAST-K, Shalimar (J&K) India
Deelak Amin, Research scholar, Division of Entomology, SKUAST-K, Shalimar (J&K) India Rayees Ahmad Wani is currently working in
determination of results . The data collected were plant height , number of tillers /hill , Dry matter, length of panicle , number of filled grains / panicle , grain yield , straw yield , biological yield , harvest index , test weight economic analysis and BCR .The data was subjected to statistical analysis of variance using SAS software .
3 RESULTS AND DISCUSSION
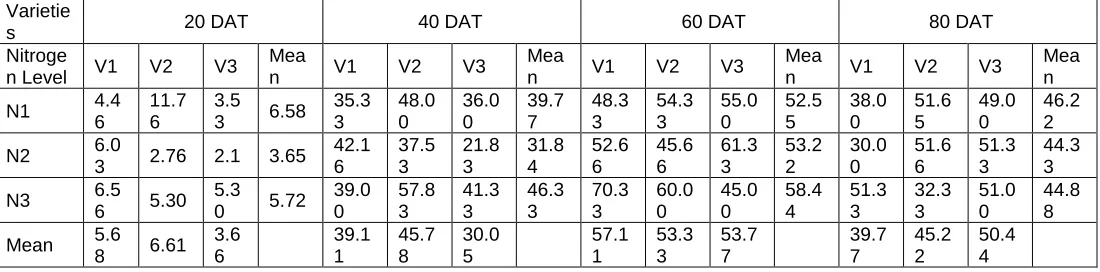
Plant height is not a yield component especially in grain crops but it indicates the influence of various nutrients on plant metabolism .It was found the application of nitrogen level (140) increases plant height . The maximum plant height was attained by Basmati-370 (130.46 cms ) followed by Haryana Basmati -1(118.90) ( Table 1). Number of Tillers / hill at 20 (DAT) affected non significantly but at 40 , 60 and 80 days after transplanting the numbers of tillers / hill increased slowly from 40-60 days after transplanting there after a gradual decline was observe up to 80 days after transplanting (Table 2) . It is apparent from the data that tiller production / hill was significantly affected by the influence of levels of nitrogen at all stages . Number of tillers differ in the treatments .Maximum number of tillers was found in the variety Pusa Basmati -1 (19.29) at level (140) followed by Haryana Basmati-1 (18.60) at level (140) tillering is an important trait for grain production and is therefore an important aspect in rice yield . [5] reported that increase in number of effective tillers in rice crop is due to influence of different fertilizer combinations according to them more number of tillers / hill might be due to more availability of nitrogen which plays a vital role in cell division . Inorganic source offers more balanced nutrition to the plants which positively affect number of tillers [4] in dry matter Production , results revealed that almost a consistent increase in dry matter occurred with the advancement of crop growth stages and reaching maximum at flowering stage 75 (DAT) ( Table 3) depending upon the varieties it changes and the maximum dry matter was accumulated by Haryana Basmati -1 57.11 (g) followed by Pusa Basmati -1 53.77(g) . In case of combination the dry matter accumulated was in the treatment (N3V1 ) 60.00 at level -140 . Length of Panicle also differs in different varieties . The maximum panicle length of 31.73 cm’s ( Table 4) in case of Pusa Basmati -1 at an optimal dose of Nitrogen - 120 . Number of filled grains were also influenced in different varieties . The maximum number of filled grains were found in Pusa Basmati -1 106.10 ( Table 5) at the nitrogen dose of -120 . Number of filled grains were also influenced in different varieties . The maximum number of filled grains were found in Pusa Basmati -1 at the nitrogen dose of -120 . The rice yield revealed that the crop responded significantly with the varieties and Nitrogen application . In case of Variety V3 Pusa Basmati -1 shows the highest yield of 4.66 tons / hectare ( Table 6) followed by Haryana Basmati -1 , 3.94 tones / hectare . Among the nitrogen levels -120 application gave the highest yield (Table 7) followed by nitrogen level application .It was apparent from the data that increasing levels of nitrogen from 100-120 exerted marked increase in straw yield among the varieties the highest straw yield was recorded in V1 Haryana Basmati -1 of 13.30 tons / hectare amongst nitrogen levels the straw yield was recorded at level nitrogen -120 and the best treatment combination was
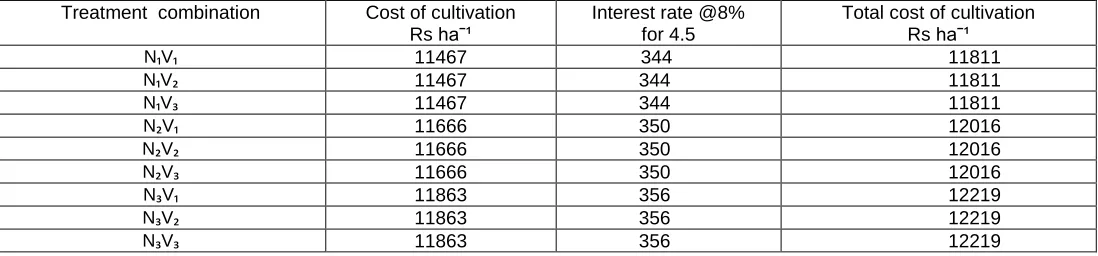
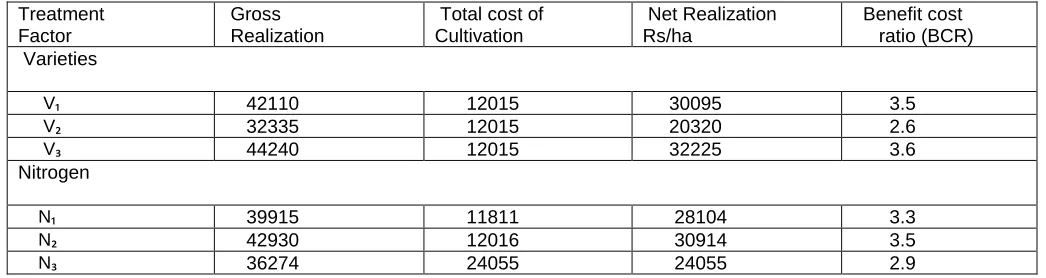
N2V1 14.58 /tons / hectare (Table 8) . The maximum test weight (Table 9) was recorded in variety Pusa Basmati 1 (18.22) and both the variety Haryana Basmatii-1 and Pusa Basmati-370 have the same test weight of 18.05 nitrogen level -120 shows the highest test weight of 20.50. The harvest index shows non significant effect (Table 10) due to varieties in case of variety the maximum harvest index was obtained in V1 Haryana Basmati -1 (.244) followed by Pusa Basmati -1 . Amongst nitrogen levels the highest harvest index (Table 11) was recorded in nitrogen level 100 followed by nitrogen level -120 (Table 12). it is apparent from the data that economic analysis that variety V3 pusa basmati -1 gave maximum profit of Rs. 32225 with a benift cost ratio of 3.6 and it was described from the data that nitrogen level 120 gave the maximum profit of Rs 30914 with the benefit cost ratio of 3.5(Table 13).
4 CONCLUSION
Considering the results obtained from the study it can be concluded that Pusa Basmati- 1 was found superior from rest of the varieties and among nitrogen levels the best level was 120.
REFERENCES
[1]. Bulbule, A.V., Bangal, D.B. and Sawant, N.K. 1995. An efficient N, P fertilizer management technique for rainfed transplanted rice in ghat zone, Maharashtra. Fertilizer News. 40: 47-51.
[2]. Chandra, D., Mittra, B.N. and Mukherjee, R.K. 1990. Effect of nitrogen levels under various plant population on wet season rice. Journal of the Andaman Science Association. 6: 115-121.
[3]. Dwivedi, D.K. 1997. Response of scented rice genotypes to nitrogen under mid up land situation. Indian Journal of Agronomy. 42(1): 74-76.
[4]. Sharma, R.K. and Singh, P.D. 2000. Response of rice varities to different spacings and fertility levels on yield attributes. Indian Journal of Agronomy. 25(2): 263-272.
Table 1 Effect of Different Treatment Combinations on Plant Height (cm) Varieti
es 20 DAT 40 DAT 60 DAT 80 DAT Nitroge
n Level V1 V2 V3
Mea
n V1 V2 V3
Mea
n V1 V2 V3
Mea
n V1 V2 V3 Mean
N1 38.2
0 49.0 0 36.2 6 41.1 5 58.3 3 82.5 0 62.6 6 67.7 3 84.6 3 103.0 3 86.3 3 91.3 3 111.1 0 118.1 6 116.0 6 114.7 7
N2 41.9
0 40.3 3 38.9 6 40.4 0 67.9 6 68.5 6 69.2 6 68.6 0 96.6
6 92.80 93.0 6 94.1 7 120.6 3 124.9 6 117.5 3 121.0 4
N3 40.8
3 45.2 0 38.9 6 41.6 5 68.3 0 83.9 6 67.2 6 73.1 7 94.8 3 114.5 3 87.7 0 99.0 2 118.9 0 130.4 6 115.3 6 121.5 7
Mean 40.3 1 44.8 4 38.0 5 64.8 6 78.3 4 66.3 0 93.0 4 103.4 5 89.0 3 118.8 7 124.5 3 115.7 6
Table 2 Effect of Different Treatments on Average No. of Tillers / Hill Variete
s 20 DAT 40 DAT 60 DAT 80 DAT Nitroge
n Level V1 V2 V3 Mea
n V1 V2 V3
Mea
n V1 V2 V3
Mea
n V1 V2 V3
Mea n
N1 7.1
3 8.4 0
6.5
3 7.85 14.5 3 19.7 3 18.0 6 17.4 4 16.7 4 16.9 3 19.9 0 17.5 7 13.8 6 16.3 3 14.2 6 14.9 2
N2 7.6 7.0
6 6.2
6 6.97 21.3 3 20.4 3 17.8 0 19.8 5 20.4 0 18.8 0 19.5 1 19.9 3 18.2 6 16.4 3 18.2 1
N3 7.6
0 7.8 0
7.6
6 7.68 18.5 3 16.7 3 19.6 0 18.2 8 18.6 6 17.9 3 19.6 6 18.4 2 14.9 3 14.0 0 16.1 0 15.0 1
Mean 7.4 4 7.7 5 6.8 2 18.1 3 18.9 6 18.4 8 18.6 0 17.8 8 19.2 9 16.2 4 16.2 0 15.6 0
Table 3 Effect of Different Treatment Combination on Plant Dry Weight (g) Varietie
s 20 DAT 40 DAT 60 DAT 80 DAT Nitroge
n Level V1 V2 V3 Mea
n V1 V2 V3
Mea
n V1 V2 V3
Mea
n V1 V2 V3
Mea n
N1 4.4
6
11.7 6
3.5
3 6.58 35.3 3 48.0 0 36.0 0 39.7 7 48.3 3 54.3 3 55.0 0 52.5 5 38.0 0 51.6 5 49.0 0 46.2 2
N2 6.0
3 2.76 2.1 3.65 42.1 6 37.5 3 21.8 3 31.8 4 52.6 6 45.6 6 61.3 3 53.2 2 30.0 0 51.6 6 51.3 3 44.3 3
N3 6.5
6 5.30 5.3
0 5.72 39.0 0 57.8 3 41.3 3 46.3 3 70.3 3 60.0 0 45.0 0 58.4 4 51.3 3 32.3 3 51.0 0 44.8 8
Mean 5.6
8 6.61 3.6 6 39.1 1 45.7 8 30.0 5 57.1 1 53.3 3 53.7 7 39.7 7 45.2 2 50.4 4
Table 4 Effect of Different Treatment Combination on Length of Panicle (cm)
Variety / Nitrogen V1 V2 V3 Mean
N1 28.16 26.16 32.00 28.77
N2 30.00 30.00 33.10 28.52
N3 33.00 27.23 30.10 28.17
Mean 30.38 26.32 31.73
Table 5 Effect of Different Treatment Combination on Average Number of Filled Grains / Panicles
Variety / Nitrogen V1 V2 V3 Mean
N1 60.00 77.00 90.00 75.66
N2 88.00 95.66 106.10 96.55
N3 123.33 126.00 106.00 118.44
Table 6 Effect of Different Treatment Combination on Grain Yield (tonnes/ hectare)
Table 7 Effect of Different Treatment Combinations on Average Straw Yield (tonnes/hectare)
Table 8 Effect of Different Treatment Combination on Biological Yield (tonnes/hectare)
Table 9: Effect of Different Treatment Combinations on Test Weight (g)
Table 10 Effect of Different Treatment Combinations on Harvest Index
Table 11 Total Cost of Cultivation for Each Treatment Combination
Variety / Nitrogen V1 V2 V3 Mean
N1 4.08 3.00 4.25 3.77
N2 4.25 3.10 4.66 4.00
N3 3.50 2.68 3.76 3.316
Mean 3.94 2.92 4.22
Variety / Nitrogen V1 V2 V3 Mean
N1 12.0 12.33 11.58 11.97
N2 14.58 12.75 12.0 13.86
N3 13.33 11.25 14.00 12.86
Mean 13.30 12.11 12.52
Variety / Nitrogen V1 V2 V3 Mean
N1 16.11 15.29 15.86 15.75
N2 17.53 15.88 16.69 16.70
N3 16.86 13.79 17.80 16.15
Mean 16.83 14.99 16.78
V1 V2 V3 Mean
N1 18.33 15.50 18.66 17.50
N2 17.66 20.50 17.66 18.61
N3 18.16 18.16 18.33 18.22
Mean 18.05 18.05 18.22
Variety / Nitrogen V1 V2 V3 Mean
N1 .266 .2008 .273 .246
N2 .253 .200 .283 . 245
N3 . 213 .206 .213 .211
Mean .2441 .2023 .213
Treatment combination Cost of cultivation Rs haˉ¹
Interest rate @8% for 4.5
Total cost of cultivation Rs haˉ¹
N₁V₁ 11467 344 11811
N₁V₂ 11467 344 11811
N₁V₃ 11467 344 11811
N₂V₁ 11666 350 12016
N₂V₂ 11666 350 12016
N₂V₃ 11666 350 12016
N₃V₁ 11863 356 12219
N₃V₂ 11863 356 12219
Table 12 Mean Grain And Stover Yield (Q/ha) And Net Realization (Rs haˉ¹) Cost of Cultivation (Rs haˉ¹) And Benefit Cost Ratio(BCR) of Rice as Influenced by Various Treatment Combination
Table 13 Mean Effects of Different Treatment Factors on Gross And Net Realization (Rs/ha ) And Benefit Cost Ratio (BCR) in Rice
Treatment Factor
Gross Realization
Total cost of Cultivation
Net Realization Rs/ha
Benefit cost ratio (BCR) Varieties
V₁ 42110 12015 30095 3.5
V₂ 32335 12015 20320 2.6
V₃ 44240 12015 32225 3.6
Nitrogen
N₁ 39915 11811 28104 3.3
N₂ 42930 12016 30914 3.5
N₃ 36274 24055 24055 2.9
Treatment combination
Yield q/ha Gross
Realization Rs haˉ¹
Total cost of cultivation
Net Realization Rs haˉ¹
Benefit cost ratio (BCR) Grain Stover
N₁V₁ 40.8 120.0 42720 11811 30909 3.6
N₁V₂ 30.0 123.3 33150 11811 21339 2.8
N₁V₃ 42.5 115.8 44040 11811 32229 3.7
N₂V₁ 42.5 145.8 45540 12016 33534 3.7
N₂V₂ 31.0 127.5 34275 12016 22259 2.8
N₂V₃ 46.6 120.0 47940 12016 35924 3.9
N₃V₁ 35.0 133.3 38165 12219 25946 3.1
N₃V₂ 26.8 112.5 29745 12219 17526 2.4