R E S E A R C H A R T I C L E
Open Access
Differences in estimation of creatinine generation
between renal function estimating equations in
an Indian population: cross-sectional data from
the Hyderabad arm of the Indian migration study
Phillippa K Bailey
1*, Charles RV Tomson
1, Sanjay Kinra
2, Shah Ebrahim
2, KV Radhakrishna
3, Hannah Kuper
2,
Dorothea Nitsch
2and Yoav Ben-Shlomo
4Abstract
Background:Creatinine based formulae for estimating renal function developed in white populations may be less valid in other ethnic groups. We assessed the performance of various estimating formulae in an Indian population.
Methods:917 subjects were recruited from the Hyderabad arm of the Indian Migration Study. Data were collected on comorbidity, serum creatinine and body composition from DXA scans. Renal function was compared using the modified Cockcroft-Gault, MDRD and CKD-EPI formulae. 24-hour creatinine production was derived from each estimate and the agreement with measured muscle mass examined. 24-hour creatinine production estimates were compared to that derived from a formula by Rule incorporating DXA measured muscle mass. Potential systematic biases were examined by age and eGFR. We assessed the association of renal function by each formula with hypertension and self-reported measures of vascular disease.
Results:Mean modified Cockcroft-Gault eCCl was 98.8 ml/min/1.73 m2, MDRD eGFR 91.2 ml/min/1.73 m2and CKD-EPI eGFR 96.3 ml/min/1.73 m2. MDRD derived 24-hour creatinine production showed the least age-related underestimation compared to the Rule formula. CKD-EPI showed a marked bias at higher eGFRs. All formulae showed similar strength associations with vascular disease and hypertension.
Conclusions:Our analyses support the use of MDRD for estimating renal function in Indian populations. Further work is required to assess the predictive value of formulae for incident disease and complications of CKD.
Keywords:Creatinine, Ethnicity, Muscle mass, Renal function
Background
Chronic kidney disease (CKD) is increasingly recognised as a public health problem, associated with an increased risk of cardiovascular disease, End-Stage Renal Failure (ESRF) requiring renal replacement therapy (RRT) and a reduced life expectancy [1]. In people with CKD, cardiovascular di-sease is the leading cause of death, and CKD is an inde-pendent risk factor for coronary heart disease (CHD) [2]. In the UK, crude relative acceptance rates for RRT in South Asians (from India, Pakistan and Bangladesh) is 3.5
times that seen in Whites [3]. The burden of CKD in India is not quantified but given the burden of diabetes, hyper-tension and cardiovascular disease, it is predicted to be high [4]. Information on CKD is needed to enable inter-vention at early stages of disease to prevent complications and progression to ESRF.
All creatinine-based formulae used to estimate renal function imply an estimation of creatinine generation rate based on demographic variables. It is recognised that methods of estimating Creatinine Clearance (CCl) and Glomerular Filtration Rate (GFR) developed in White populations may require adjustment for use in other ethnic groups [5,6]. African-American individuals have a higher generation of creatinine from muscle than * Correspondence:[email protected]
1
The Richard Bright Renal Unit, Southmead Hospital, Westbury-on-Trym, Bristol BS10 5NB, UK
Full list of author information is available at the end of the article
White subjects, due mostly to greater skeletal muscle mass [7,8]. Thus co-efficients for African-Americans within MDRD and CKD-EPI result in higher values for estimated GFR (eGFR) than Whites for the same plasma creatinine concentration, age and gender [9]. Similar dif-ferences in skeletal muscle mass and creatinine gene-ration exist between Indian and White populations [10]. To date, none of the renal function estimating formulae has been well validated in an Indian population. The CKD-EPI research group carried out work on developing an ‘Asian’coefficient but this aimed to incorporate pri-marily Chinese and Japanese populations [5].
Rule and colleagues recently investigated the use of Dual-energy X-ray absorptiometry (DXA) measurements of muscle mass to estimate Urinary Creatinine Clearance (UCCl) and compared this to the use of demographic variables [11]. A model based on muscle mass and age had the best fit.
In this mixed urban-rural Indian population from Hyderabad we investigated different methods of estima-ting renal function, including Rule’s formula using mea-sured muscle mass. The objective of this study was to validate the estimation of creatinine generation between different equations used to estimate GFR or CCl against DXA measured muscle mass in an Indian population. We derived 24-hour (24 h) creatinine production from each renal function estimate and compared this to mea-sured muscle mass. This comparison provides a unique insight into the ability of demographic variables within each formula to estimate creatinine generation in an Indian population. Demographic variables in creatinine-based estimating formulae primarily account for differences in muscle mass, from which creatinine is largely derived.
We compared estimates of excretory renal function, and consequent classification of CKD, by different formulae. Further, we assessed the association of self-reported mea-sures of vascular disease and hypertension with each estimate.
Methods
Study methodology
Using the framework of a cardiovascular risk factor screen study conducted in factories in north, central and south India [12] a sib-pair comparison study was designed. Details of this are reported elsewhere [13]. The original study was in four factories: Lucknow, Hindustan Aeronautics Ltd; Nagpur, Indorama Synthetics Ltd; Hyderabad, Bharat Heavy Electricals Ltd; and Bangalore, Hindustan Machine Tools Ltd. Factory workers and their co-resident spouses were recruited if they were rural-urban migrants using employer records as the sampling frame. Each migrant worker and spouse was asked to invite one non-migrant same-sex full-sibling, closest to them in age, residing in their rural place of origin. A 25% random sample of non-migrants was
invited to participate in the study. Non-migrants were also asked to invite a sibling who resided in the same city but didn’t work in the factory. Information sheets were translated into local languages and signed (thumb print acceptable) and informed consent obtained. Ethics approval was from the All India Institute of Medical Sciences Ethics Committee, reference no. A-60/4/8/ 2004. Field work ran from March 2005 to December 2007. The Hyderabad arm of the Indian Migration Study is a follow-up study of the Hyderabad recruited subjects. The participants were invited to attend a screening clinic at the National Institute of Nutrition between January 2009 and December 2010.
Clinic measures
Participants were interviewed and data collected on demo-graphic factors, including socioeconomic status using a subset of 12 questions from the Standard of Living Index (SLI), a household level asset-based scale devised for Indian surveys [14]. These comprised house type, house owner-ship, toilet facility, lighting source, drinking water source, car/tractor, scooter, telephone, refrigerator, television, bi-cycle, radio, clock/watch, and weighted to give a maximum score of 33. Weighting was developed by the International Institute of Population Sciences. Individuals were classed as having‘low’(0-7),‘middle’(8-12) or‘high’(13-33) standards of living. Smoking was assessed as positive if individuals ac-tively smoked or chewed tobacco. Few individuals reported past but not active smoking. A diagnosis of CHD and Stroke was made by self-report of a doctor diagnosis. Weight was measured twice without shoes using digital Seca scales (www.seca.com). Standing height was measured twice without shoes using a portable stadiometer (Leicester height measure; Chasmors Ltd, Camden, London, UK). Body Mass Index was calculated as weight(kg)/height(m)2. We used a validated oscillometric device (OMRON M5-I; Omron, Matsusaka Co, Japan) to measure blood pressure (BP) in the sitting position with appropriate cuff sizes. We took three measures 2-3 minutes apart, and averaged the last two measures for analyses. A diagnosis of hypertension was made if average systolic BP was≥140 mmHg, average diastolic BP≥90 mmHg or if there was report of a doctor diagnosis of hypertension [15].
Participants were asked to attend fasting and the time of their last meal was recorded. Creatinine analysis was per-formed using the rate-blanked compensated Jaffe method on a Roche COBAS-C311 autoanalyzer. The calibraton for this assay is traceable to isotope dilution mass spec-trometry (IDMS). The Cardiac Biochemistry Lab, AIIMS, is part of the UK National External Quality Assessment Scheme (www.ukneqas.org.uk) to quality assure assays.
scans). Scans were individually checked for major artefacts and if present were removed from the analyses. As quality assurance, a spine phantom was scanned daily to check for acceptable ranges. Total skeletal muscle mass was determined from the lean body mass of all four extremities multiplied by 1.33 [16]. Body Surface Area was calculated by the Mosteller equation [17]. Renal function was esti-mated using four measures, including Rule’s formula in-corporating measured muscle mass [11]:
Renal function estimating equations:
1. Creatinine Clearance by Cockcroft-Gault modified for Body Surface Area (BSA) by the Mosteller equation.
eCCl¼ð140–AgeÞ Mass kgð Þ
½0:85 if female=serum creatinineðmg=dlÞ
¼ml=min
Serum creatinine (mg/dl)
Modified for BSA¼eCCl1:73=BSA
¼ml=min=1:73m2
BSA
2. The IDMS standardized Modification of Diet in Renal Disease (MDRD) formula
eGFR¼175Serum creatinine mgð =dlÞ1:154Age0:203
½0:742 if female ¼ml=min=1:73m2
3. The CKD-EPI formulae For‘non-black females’: If Serum creatinine≤0.7 mg/dl
eGFR¼144ðSerum creatinine=0:7Þ0:3290:993Age
¼ml=min=1:73m2
If Serum creatinine > 0.7 mg/dl
eGFR¼144ðSerum creatinine=0:7Þ1:2090:993Age
¼ml=min=1:73m2
For‘non-black males’:
If Serum creatinine≤0.9 mg/dl
eGFR¼141ðSerum creatinine=0:9Þ0:4110:993Age
¼ml=min=1:73m2
If Serum creatinine >0.9 mg/dl
eGFR¼141ðSerum creatinine=0:9Þ1:2090:993Age
¼ml=min=1:73m2
4. Estimated creatinine clearance based on Rule formula DXA measured skeletal muscle mass and age
If age > 55 years:
eCrClagemuscle¼exp 6½ :37þ0:029ðmuscle in kg=1:73m2Þ
½0:0071age55 ¼ml=min=1:73m2
Serum creatinine mgð =dlÞ 14:4
ð Þ
If age≤55 years:
eCrClagemuscle¼exp½6:37þ0:029
ðmuscle in kg=1:73m2Þ¼ml=min=1:73m2
Serum creatinine mgð =dlÞ 14:4
ð Þ
CKD was classified according to the KDOQI guide-lines [18]. As information on proteinuria was unavai-lable, CKD 1 and 2 were not identified. We defined an eGFR <60 ml/min/1.73 m2 (CKD stages 3-5) as ‘CKD’ and an eGFR ≥60 ml/min/1.73 m2 as ‘No CKD’. In cli-nical practice, the diagnosis of CKD requires evidence of reduced function for ≥3 months; in epidemiological studies a single estimate of GFR is accepted [19].
All creatinine-based GFR formulae use the serum cre-atinine concentration and demographic variables to em-pirically derive an estimate of GFR. Serum creatinine concentration is determined by the arithmetical relation-ship between creatinine generation rate and glomerular filtration rate, whilst noting that CCl is not precisely the same as GFR, particularly when GFR is low, because of tubular secretion. Therefore the formulae are, in effect, different ways of estimating creatinine generation rate from demographic characteristics, estimating GFR from this together with the serum creatinine concentration. Creatinine generation rate should then be:
Creatinine generation rate (mmol/24 h) = CCl or GFR (ml/min) × serum creatinine (mmol/ml) × 1440 (min)
Given that creatinine generation rate is proportional to muscle mass, one would expect to find a linear corre-lation between the two. The tightness of this correcorre-lation would be a measure of the accuracy of each formula.
Statistical analyses
differences in the regression coefficients using a hetero-geneity test.
All creatinine-based renal function formulae underper-form systematically at high GFRs. Renal function esti-mates therefore underwent log2-transformation to allow this error to be more normally distributed. Therefore, one unit increase change is equivalent to doubling renal function. We used logistic regression to assess the asso-ciation between the transformed renal function estimates and our disease end-points, vascular disease and hy-pertension, both unadjusted and adjusted for age. We undertook sex-stratified and combined analyses after formally testing for any sex interaction.
The study included related individuals who are not truly independent, so we used robust standard errors in our regression models to allow for any family clustering effect. This provides wider 95% confidence intervals than
conventional methods. Statistical analyses were performed using Stata 11.
Results
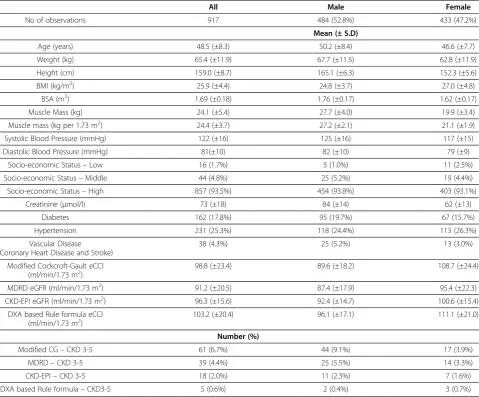
The study sample comprised 917 adult subjects (mean age 48.5 ± SD 8.3 years) and roughly equal numbers of men and women (Table 1). The crude mean muscle mass in women was 7.8 kg (95% CI 7.7-7.9) less than that in men. However, the BMI of women was 2.2 kg/m2higher than that of men (95% CI 2.1-2.3). The mean eCCl by mCG was 98.8 ml/min/ 1.73 m2and by Rule’s formula 103.2 ml/min/1.73 m2. eGFR as estimated by MDRD was 91.2 ml/min/1.73 m2 and by CKD-EPI 96.3 ml/min/1.73 m2. Generally, estimates of excre-tory renal function were higher in women than in men. In men the Rule formula generated the highest estimate of renal function, followed by CKD-EPI, mCG and MDRD. In women,
Table 1 Baseline characteristics of Hyderabad arm of the Indian Migration Study stratified by sex
All Male Female
No of observations 917 484 (52.8%) 433 (47.2%)
Mean (± S.D)
Age (years) 48.5 (±8.3) 50.2 (±8.4) 46.6 (±7.7)
Weight (kg) 65.4 (±11.9) 67.7 (±11.5) 62.8 (±11.9)
Height (cm) 159.0 (±8.7) 165.1 (±6.3) 152.3 (±5.6)
BMI (kg/m2) 25.9 (±4.4) 24.8 (±3.7) 27.0 (±4.8)
BSA (m2) 1.69 (±0.18) 1.76 (±0.17) 1.62 (±0.17)
Muscle Mass (kg) 24.1 (±5.4) 27.7 (±4.0) 19.9 (±3.4)
Muscle mass (kg per 1.73 m2) 24.4 (±3.7) 27.2 (±2.1) 21.1 (±1.9)
Systolic Blood Pressure (mmHg) 122 (±16) 125 (±16) 117 (±15)
Diastolic Blood Pressure (mmHg) 81(±10) 82 (±10) 79 (±9)
Socio-economic Status–Low 16 (1.7%) 5 (1.0%) 11 (2.5%)
Socio-economic Status–Middle 44 (4.8%) 25 (5.2%) 19 (4.4%)
Socio-economic Status–High 857 (93.5%) 454 (93.8%) 403 (93.1%)
Creatinine (μmol/l) 73 (±18) 84 (±14) 62 (±13)
Diabetes 162 (17.8%) 95 (19.7%) 67 (15.7%)
Hypertension 231 (25.3%) 118 (24.4%) 113 (26.3%)
Vascular Disease (Coronary Heart Disease and Stroke)
38 (4.3%) 25 (5.2%) 13 (3.0%)
Modified Cockcroft-Gault eCCl (ml/min/1.73 m2)
98.8 (±23.4) 89.6 (±18.2) 108.7 (±24.4)
MDRD eGFR (ml/min/1.73 m2) 91.2 (±20.5) 87.4 (±17.9) 95.4 (±22.3)
CKD-EPI eGFR (ml/min/1.73 m2) 96.3 (±15.6) 92.4 (±14.7) 100.6 (±15.4)
DXA based Rule formula eCCl
(ml/min/1.73 m2) 103.2 (±20.4) 96.1 (±17.1) 111.1 (±21.0)
Number (%)
Modified CG–CKD 3-5 61 (6.7%) 44 (9.1%) 17 (3.9%)
MDRD–CKD 3-5 39 (4.4%) 25 (5.5%) 14 (3.3%)
CKD-EPI–CKD 3-5 18 (2.0%) 11 (2.3%) 7 (1.6%)
the findings were slightly different with mCG generating a higher estimate than CKD-EPI.
In the total population the estimated prevalence of CKD stages 3-5 showed up to 10 fold variability; the highest was with mCG (6.7%) followed by MDRD (4.4%), CKD-EPI (2.0%) and finally Rule formula (0.6%). In general, prevalence was higher in men compared to women (Table 1 and Additional file 1: Figure S1).
We examined whether there was any systematic bias be-tween the different formulae according to the level of renal function. The Bland-Altman plots (Additional file 1: Figure S3) showed that the variation in the differences be-tween formulae gets larger as the mean level of renal func-tion increases but in a non-specific fashion except for CKD-EPI. The CKD-EPI formula shows a biased pattern: under-estimating renal function compared to the other formulae at the high end of function.
Association between estimated creatinine production and muscle mass
Overall, lean muscle mass explained a greater proportion of the variance in 24 h creatinine production as esti-mated by MDRD, though this was not the case in the gender specific analyses. Overall and in the gender-specific analyses, the strength of the relationship, as measured by the regression gradient, was strongest with mCG. The strongest correlation was seen with the Rule formula, which was unsurprising as this was itself derived against DXA measures (Additional file 1: Table S1 and Additional file 1: Figure S3).
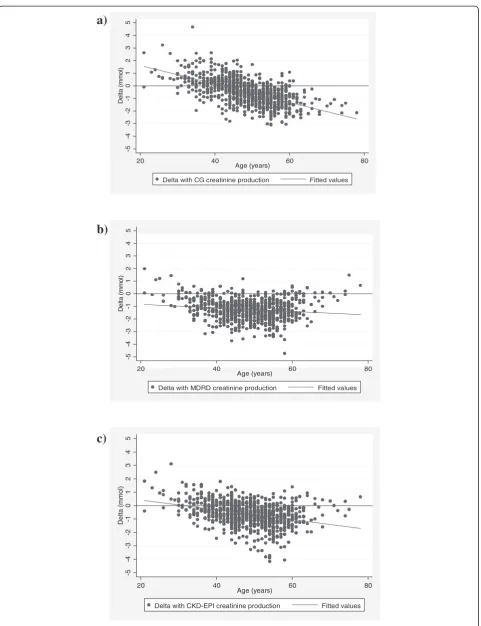
Formula estimated adjustment of muscle mass with age As the Rule formula was most closely related to measured muscle mass it was used as the closest estimate of 24 h creatinine production. The difference between 24 h cre-atinine production as estimated by the other formulae and that by Rule was regressed against the subjects’ age. All formulae underestimated the 24 h creatinine production when compared to the Rule formula. Both mCG and CKD-EPI showed a marked negative association with age (regression coefficients per year increase –0.072 (95% CI
–0.080 to–0.065) and –0.035 (95% CI–0.044 to–0.027) respectively so that they underestimate 24 h Cr produc-tion more in the old than the young (Figure 1). This was less marked for the MDRD formula (regression coeffi-cients per year increase –07.012 (95% CI –0.021 to – 0.003) (formal heterogeneity test between coefficients p<0.001).
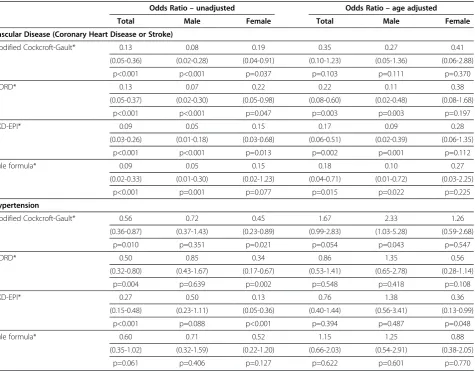
Association with vascular disease and hypertension All formulae showed an inverse association with com-bined cardiac and cerebrovascular disease so that dis-ease status was associated with worse renal function (Table 2). This was, in general, stronger for men than
women. After adjustment for age these associations were attenuated; CKD-EPI had the strongest inverse as-sociation but the wide 95% confidence intervals show there is no strong evidence that one formula is superior to the others. For hypertension there was an inverse association in the crude analysis with a stronger associ-ation for women. The CKD-EPI formula had the stron-gest association but again overlapping 95% confidence intervals. After age adjustment the association atten-uated so that they were consistent with chance. Diffe-rences in the effect estimates by gender were consistent with chance (all p-values for interaction >0.05).
Discussion
This is a large study of renal function in a mixed urban-rural Indian population. The comparison with measured muscle mass provides an insight into the ability of demographic variables to estimate creatinine generation in Indian populations. This is important as the demo-graphic variables used as surrogates for variability in cre-atinine production and excretion were developed in White populations and thus may not be generalisable to other ethnicities.
The mean eCCl derived from the Rule formula in healthy White Americans was 104±26 ml/min/1.73 m2 as com-pared to 103.2±20.4 ml/min/1.73 m2in our Indian popula-tion [11]. It is interesting to note that the Indian populapopula-tion in this study had a lower mean total body mass and a lower BMI compared to the Rule’s population, but that muscle mass was comparable (Additional file 1: Table S2) showing that this Indian group is relatively lean. However, our popu-lation contained both rural and urban residents, and with a gradient of increasing obesity with urbanization recognized [20] these results should not be generalised to urban Indian populations.
Of the traditional GFR estimating equations, MDRD derived 24 h creatinine production was most strongly correlated with DXA measured muscle mass. MDRD was the only formula which did not have a marked dif-ferential bias with age and thus may be the most suitable at predicting age-related differences in muscle mass and creatinine production. The mCG formula generates the highest mean clearance but also gives the highest pro-portion of those with CKD 3-5, which at first sight appears paradoxical. This is explained by the distribution of creatinine clearance which appears to have a larger right sided tail using mCG (Additional file 1: Figure S1).
-5
-4
-3
-2
-1
0
1
2
3
4
5
De
lt
a
(
mmo
l)
20 40 60 80
Age (years)
Delta with CG creatinine production Fitted values
-5
-4
-3
-2
-1
0
1
2
3
4
5
De
lt
a
(
m
m
o
l)
20 40 60 80
Age (years)
Delta with MDRD creatinine production Fitted values
-5
-4
-3
-2
-1
0
1
2
3
4
5
D
e
lt
a (
mmol
)
20 40 60 80
Age (years)
Delta with CKD-EPI creatinine production Fitted values
a)
b)
c)
important implications for health service planning. We didn’t find evidence that one formula was better than the others in predicting vascular disease and hypertension.
This study is the largest comparison of different esti-mates of creatinine clearance in an Indian population which also has DXA derived measures of muscle mass. It does, however, have several important limitations. (1) Lack of a gold standard. We did not compare the calcu-lated GFR and CCl estimates with a ‘measured gold standard’. However, the assumption that measured GFR is the‘gold standard’against which all estimating formu-lae should be compared has been called into question
[21]. There’s no universally recognised gold standard method of measuring GFR and different methods often yield different measurements. Measured GFR has not been shown to be better than other markers of renal di-sease at predicting outcomes associated with poor renal function [22]. Determining with great accuracy ‘actual’ GFR is less a priority than calculating a person’s risk of clinical complications. (2) CCl over-estimates GFR GFR estimating equations have been developed to estimate GFR against measured GFR and underestimate mea-sured CCl by approximately 15% [23]. CG was developed to estimate CCl by regressing UCCl/kg body weight onto
Table 2 Odds ratios for cross-sectional associations between vascular disease (CHD and stroke) and hypertension with different estimated renal function formulae adjusted for age and stratified by gender
Odds Ratio–unadjusted Odds Ratio–age adjusted
Total Male Female Total Male Female
Vascular Disease (Coronary Heart Disease or Stroke)
Modified Cockcroft-Gault* 0.13 0.08 0.19 0.35 0.27 0.41
(0.05-0.36) (0.02-0.28) (0.04-0.91) (0.10-1.23) (0.05-1.36) (0.06-2.88)
p<0.001 p<0.001 p=0.037 p=0.103 p=0.111 p=0.370
MDRD* 0.13 0.07 0.22 0.22 0.11 0.38
(0.05-0.37) (0.02-0.30) (0.05-0.98) (0.08-0.60) (0.02-0.48) (0.08-1.68)
p<0.001 p<0.001 p=0.047 p=0.003 p=0.003 p=0.197
CKD-EPI* 0.09 0.05 0.15 0.17 0.09 0.28
(0.03-0.26) (0.01-0.18) (0.03-0.68) (0.06-0.51) (0.02-0.39) (0.06-1.35)
p<0.001 p<0.001 p=0.013 p=0.002 p=0.001 p=0.112
Rule formula* 0.09 0.05 0.15 0.18 0.10 0.27
(0.02-0.33) (0.01-0.30) (0.02-1.23) (0.04-0.71) (0.01-0.72) (0.03-2.25)
p<0.001 p=0.001 p=0.077 p=0.015 p=0.022 p=0.225
Hypertension
Modified Cockcroft-Gault* 0.56 0.72 0.45 1.67 2.33 1.26
(0.36-0.87) (0.37-1.43) (0.23-0.89) (0.99-2.83) (1.03-5.28) (0.59-2.68)
p=0.010 p=0.351 p=0.021 p=0.054 p=0.043 p=0.547
MDRD* 0.50 0.85 0.34 0.86 1.35 0.56
(0.32-0.80) (0.43-1.67) (0.17-0.67) (0.53-1.41) (0.65-2.78) (0.28-1.14)
p=0.004 p=0.639 p=0.002 p=0.548 p=0.418 p=0.108
CKD-EPI* 0.27 0.50 0.13 0.76 1.38 0.36
(0.15-0.48) (0.23-1.11) (0.05-0.36) (0.40-1.44) (0.56-3.41) (0.13-0.99)
p<0.001 p=0.088 p<0.001 p=0.394 p=0.487 p=0.048
Rule formula* 0.60 0.71 0.52 1.15 1.25 0.88
(0.35-1.02) (0.32-1.59) (0.22-1.20) (0.66-2.03) (0.54-2.91) (0.38-2.05)
p=0.061 p=0.406 p=0.127 p=0.622 p=0.601 p=0.770
*All renal function estimates underwent log base 2 transformation. (See figure on previous page.)
age [24]. Direct comparison of CCl and GFR is therefore limited but in clinical practice they are used similarly. (3) Estimating Muscle Mass from DXA scans Wang et al’s original work, concluding that appendicular muscle mass constitutes approximately 75% of total body skeletal mus-cle mass [16], was on a sample of 25 White men. In fur-ther work ethnicity was not found to be a significant predictor of skeletal muscle, but of the 414 study subjects, only 0.12% were‘Asian’[25]. We applied Wang’s estimate to an Indian group, although lacking validation data in this population. However, any error should apply equally to all the compared formulae. (4)Contribution of diet and me-tabolismCreatinine is mainly produced by muscle break-down, largely determined by muscle mass but affected by dietary protein and metabolic rate. The effect of dietary protein is minimised by ensuring serum creatinine is mea-sured on a fasting blood sample [26], as in this study. Me-tabolism was not examined. (5) Comorbidity measures There may have been under-ascertainment of vascular end-points in rural areas, compared to urban which bene-fit from employment health facilities. This may have atte-nuated true associations.
This study supports previous evidence that formulae to estimate renal function based on serum creatinine and demographic characteristics are all imprecise due to the impossibility of predicting steady-state creatinine gene-ration in an individual. The MDRD formula appears less variable and less biased by age in the prediction of creati-nine generation. However there was no convincing evi-dence that any one measure was superior in predicting complications of CKD; this may be due to a low preva-lence of complications in this relatively young, healthy population. Follow-up will show which estimate of renal function is most strongly associated with comorbidities. Further work is required to determine the most useful es-timate of renal function in an Indian population. Given the large and increasing burden of diabetes and obesity in India, this will be of major future importance in planning future renal care services.
Conclusions
Our analyses support the use of MDRD for estimating renal function in Indian populations. Further work is required to assess the predictive value of formulae for incident disease and complications of CKD.
Additional file
Additional file 1: Table S1. Correlation and regression estimates between estimated 24 hour creatinine production using different formulae as predicted by lean muscle mass from DXA scan.Table S2.Comparison of Indian Study population and White American Study population in which the Rule formula was derived.Figure S1.Distribution of renal function by different estimates across Indian study population–vertical reference line eGFR 60 ml/min/1.73 m2(Below this = CKD 3 or worse).Figure S2.
Bland-Altman plots comparing difference between the GFR/CCl generated by one formula and that generated by another against the mean GFR/CCl of both formulae. The central horizontal line corresponds to the mean difference while the outer lines correspond to the 95% limits of agreement (Mean ± 2 S.D.).Figure S3.Linear regression of relationship between estimated 24 hour creatinine production derived from different formulae against measured lean muscle mass derived from DXA.
Competing interests
The authors declare that they have no competing interests.
Authors’contributions
SK SE YBS KR and HK contributed to study design. HK SK and SE managed the fieldwork, staff training and supervision of the data collection for the study. PB CT and YBS contributed to data analysis. PB CT YBS and DN contributed to data interpretation. PB wrote the first draft of the paper. CT YBS DN and HK contributed to the writing of the paper. All authors provided feedback on the manuscript and approved the submitted version.
Acknowledgements
The Indian Migration Study was funded by the Wellcome Trust (grant no. WT083707MA). Abstracts were presented at the ERA-EDTA and UK Renal Association Conferences 2012. We would like to acknowledge the contribution made by Professor Andrew Rule, Associate Professor of Medicine, Mayo Clinic, USA.
The authors thank the field staff and local investigators who conducted this study.
The Indian Migration Study group comprises Prof. K Srinath Reddy, Dr. Dorairaj Prabhakaran, Prof. Tulsi Patel, Dr. Lakshmy Ramakrishnan, Dr. Ruby Gupta, and Dr. Tanica Lyngdoh (New Delhi); Prof. R C Ahuja and Prof. R K Saran (Lucknow); Dr. Prashant Joshi and Dr. N M Thakre (Nagpur); Dr. K V R Sarma, Prof. S Mohan Das, Dr. R K Jain, and Dr. S S Potnis (Hyderabad); Prof. Anura V Kurpad, Dr. Mario Vaz, AV Barathi, and Dr. Murali Mohan (Bangalore); Dr. Chittaranjan Yajnik (Pune); Prof. George Davey Smith and Prof. Yoav Ben Shlomo (Bristol); and Professor Shah Ebrahim and Dr. Sanjay Kinra (London School of Hygiene and Tropical Medicine).
Author details
1The Richard Bright Renal Unit, Southmead Hospital, Westbury-on-Trym,
Bristol BS10 5NB, UK.2London School of Hygiene and Tropical Medicine,
Keppel Street, London WC1E 7HT, UK.3National Institute of Nutrition,
Hyderabad, India.4School of Social and Community Medicine, University of
Bristol, Canynge Hall, 39 Whatley Road, Bristol BS8 2PS, UK.
Received: 12 September 2012 Accepted: 31 January 2013 Published: 4 February 2013
References
1. Castledine C, Steenkamp R, Feest T, Tomson CR:UK renal registry 13th annual report (December 2010): chapter 6: survival and causes of death of UK adult patients on renal replacement therapy in 2009: national and centre-specific analyses.Nephron Clin Pract2011,119(Suppl 2):107–34. 2. Leoncini G, Viazzi F, Pontremoli R:Overall health assessment: a renal
perspective.Lancet2010,375(9731):2053–2054.
3. Roderick PJ, Raleigh VS, Hallam L, Mallick NP:The need and demand for renal replacement therapy in ethnic minorities in England.J Epidemiol Community Health1996,50(3):334–339.
4. Gupta R:Burden of coronary heart disease in India.Indian Heart J2005,
57(6):632–638.
5. Stevens L, Claybon MA, Schmid CH, Chen J, Horio M, Imai E, Nelson RG, Van Deventer M, Wang HY, Zuo L, Zhang YL, Levey AS:Evaluation of the chronic kidney disease epidemiology collaboration equation for estimating the glomerular filtration rate in multiple ethnicities.Kidney Int2011,79:555–562. 6. Pottel H, Hoste L, Delanaye P, Cavalier E, Martens F:Demystifying ethnic/
sex differences in kidney function: Is the difference in (estimating) glomerular filtration rate in serum creatinine concentration?Clin Chim Acta2012,413(19-20):1612–1617.
mineral mass between black and white females and their relevance to estimates of body composition.Am J Clin Nutr1992,55:8–13.
8. Jones C, Jones CA, Wilson IB, Knox TA, Levey AS, Spiegelman D, Gorbach SL, Van Lente F, Stevens LA:Cystatin C and creatinine in an HIV cohort: the nutrition for healthy living study.Am J Kidney Dis2008,51:914–924. 9. Gallagher D, Visser M, De Meersman RE, Sepúlveda D, Baumgartner RN,
Pierson RN, Harris T, Heymsfield SB:Appendicular skeletal muscle mass: effects of age, gender, and ethnicity.J Appl Physiol1997,83(1):229–239. 10. Yajnik CS, Yudkin JS:The Y-Y paradox.Lancet2004,363(9403):163. 11. Rule AD, Bailey KR, Schwartz GL, Khosla S, Lieske JC, Melton LJ 3rd:For
estimating creatinine clearance measuring muscle mass gives better results than those based on demographics.Kidney Int2009,75(10):1071–1078. 12. Reddy K, Prabhakaran D, Chaturvedi V, Jeemon P, Thankappan KR,
Ramakrishnan L, Mohan BV, Pandav CS, Ahmed FU, Joshi PP, Meera R, Amin RB, Ahuja RC, Das MS, Jaison TM:Methods for establishing a surveillance system for cardiovascular diseases in Indian industrial populations.
Bull World Health Organ2006,84:461–469.
13. Lyngdoh T, Kinra S, Shlomo YB, Reddy S, Prabhakaran D, Smith GD, Ebrahim S:Indian Migration Study group. Sib-recruitment for studying migration and its impact on obesity and diabetes.Emerging Themes in Epidemiology 2006,3(1):2.
14. International Institute for Population Sciences (IIPS) National Family Health Survey (NFHS-3). 2007. www.nfhsindia.org/nfhs3.html.
15. National Institute of Clinical Excellence CG127 Hypertension:The Clinical Management of Primary Hypertension in Adults. National Clinical Guideline Centre; Aug 2011. http://www.nice.org.uk/nicemedia/live/13561/56007/56007.pdf 16. Wang ZM, Visser M, Ma R, Baumgartner RN, Kotler D, Gallagher D, Heymsfield SB:
Skeletal muscle mass: evaluation of neutron activation and dual-energy X-ray absorptiometry methods.J Appl Physiol1996,80(3):824–831. 17. Mosteller R:Simplified calculation of body-surface area.N Engl J Med
1987,317:1098.
18. National Kidney Foundation:KDOQI clinical practice guidelines for chronic kidney disease: evaluation, classification, and stratification.Am J Kidney Dis2002,39:S1–266.
19. Levey AS, de Jong PE, Coresh J, El Nahas M, Astor BC, Matsushita K, Gansevoort RT, Kasiske BL, Eckardt KU:The definition, classification, and prognosis of chronic kidney disease: a KDIGO Controversies Conference report.Kidney Int2011,80(1):17–28.
20. Ebrahim S, Kinra S, Bowen L, Andersen E, Ben-Shlomo Y, Lyngdoh T, Ramakrishnan L, Ahuja RC, Joshi P, Das SM, Mohan M, Davey Smith G, Prabhakaran D, Reddy KS:Indian migration study group. The effect of rural-to-urban migration on obesity and diabetes in india: A cross-sectional study.PLoS Med2010,7(4):e1000268.
21. Hsu C-Y, Bansal N, Measured GFR as Gold Standard:All that glitters is not gold?Clin J Am Soc Nephrol,6(8):1813–1814.
22. Hsu C, Propert K, Xie D, Hamm L, He J, Miller E, Ojo A, Shlipak M, Teal V, Townsend R, Weir M, Wilson J, Feldman H, CRIC Investigators:Measured GFR does not outperform estimated GFR in predicting CKD-related complications.J Am Soc Nephrol2011,22(10):1931–1937.
23. Levey AS, Bosch JP, Lewis JB, Greene T, Rogers N, Roth D:A more accurate method to estimate glomerular filtration rate from serum creatinine: a new prediction equation.Ann Intern Med1999,130(6):461–470. 24. Cockcroft D, Gault M:Prediction of creatinine clearance from serum
creatinine.Nephron1976,16(1):31–41.
25. Kim J, Shen W, Gallagher D, Jones A Jr, Wang Z, Wang J, Heshka S, Heymsfield SB:Total-body skeletal muscle mass: estimation by a new dual-energy X-ray absorptiometry method.Am J Clin Nutr2002,76(2):378–383.
26. Preiss D, Godber IM, Lamb EJ, Dalton RN, Gunn IR:The influence of a cooked-meat meal on estimated glomerular filtration rate.Ann Clin Biochem2007,44:35–42.
doi:10.1186/1471-2369-14-30
Cite this article as:Baileyet al.:Differences in estimation of creatinine generation between renal function estimating equations in an Indian population: cross-sectional data from the Hyderabad arm of the Indian migration study.BMC Nephrology201314:30.
Submit your next manuscript to BioMed Central and take full advantage of:
• Convenient online submission
• Thorough peer review
• No space constraints or color figure charges
• Immediate publication on acceptance
• Inclusion in PubMed, CAS, Scopus and Google Scholar
• Research which is freely available for redistribution