The University of San Francisco
USF Scholarship: a digital repository @ Gleeson Library |
Geschke Center
Master's Theses Theses, Dissertations, Capstones and Projects
Spring 5-9-2014
Women’s Empowerment and Community-Driven
Development: Evidence from the Solomon Islands
Erin M. Steffen
Follow this and additional works at:https://repository.usfca.edu/thes
Part of theCivic and Community Engagement Commons,Growth and Development Commons, Inequality and Stratification Commons, and theInternational Economics Commons
This Thesis is brought to you for free and open access by the Theses, Dissertations, Capstones and Projects at USF Scholarship: a digital repository @ Gleeson Library | Geschke Center. It has been accepted for inclusion in Master's Theses by an authorized administrator of USF Scholarship: a digital repository @ Gleeson Library | Geschke Center. For more information, please [email protected].
Recommended Citation
Steffen, Erin M., "Women’s Empowerment and Community-Driven Development: Evidence from the Solomon Islands" (2014).
Master's Theses. 90.
The author wishes to thank the people of the Solomon Islands, especially those who took part in this study and offered incredible insight into their lives and communities. A special thanks also goes to the following individuals who made this project all the more worthwhile: Heather Belfor, Ariel Benyishay, Alessandra Cassar, Giovanna D’Adda, Nick Garcia-Guerrero, Pauline Grojean, Erik Johnson, Mark Johnston, Lennox Ju, Tommy Mason, Franklin Qaloboe, Solomon Radei, Rebecca Pizzitola, Thomas Sackman, Patrick Schneider, Basilio Solevudu, Yaniv Stopnitzky, Lottie Vaisekavea, and Joseph Vecci.
Women’s Empowerment and Community-Driven
Development: Evidence from the Solomon Islands
Master’s Thesis
International and Development Economics
JEL Classifications: O12, O18, J16
Key Words: Community-Driven Development, Women’s Empowerment, Rural Development
Erin M. Steffen
Department of Economics University of San Francisco
2130 Fulton St. San Francisco, CA 94117
E-mail: [email protected]
May 2014
Abstract: This study evaluates the impact to-date of a community-driven development (CDD) program on women’s empowerment in the Solomon Islands. Originally launched in 2008, the CDD program is known as the Rural Development Program (RDP). The RDP aims to foster employment and income growth by focusing on participatory development, demand-responsive provisions of government services, and the creation of a supportive economic environment for small-scale rural development. The RDP process mandates female involvement, which manifests predominately in the selection of community infrastructure projects and by participation in a RDP subcommittee known as the Sub-Implementation Committee (SIC). Members of the SIC are in charge of organizing the maintenance and operation of the implemented infrastructure projects. While the program has helped increase women's participation in RDP’s projects and processes since 2008, their involvement outside the program appears limited. Through 2013 data show limited evidence that women have increased their participation in political, social, and household empowering roles.
I. Introduction
Gender equality is shaped by several factors, such as rules, social norms, social perceptions, territorial claims, and personal and household attributes. The influence and magnitude of each factor varies across cultures and countries. In developing countries in particular, promoting gender equality can be difficult. Often, countries have long-standing cultural traditions that preclude women’s participation in fundamental economic, social, and political activities. Despite the limitations, gender equality is a basic human right, and women can be important drivers of sustainable development. As such, women’s involvement is increasingly promoted, if not mandated, as one of the objectives of many development projects, programs, and policies.
This study examines whether requiring women’s participation in a development program increases female empowerment. Evidence is used from a cohort of women in the Solomon Islands exposed to a community-drive development (CDD) program known as the Rural Development Program (RDP). While women in the Solomon Islands are commonly regarded as having a lower status than men, the RDP includes special provisions in its objectives to improve gender equality. The provisions include promoting (i) the significant and visible participation of women in the expression of needs and decisions made in the program and (ii) non-discriminatory access to the social and economic benefits of the program’s projects.
This paper is divided into six sections. Section II presents a review of literature relevant to women's empowerment through community-driven initiatives and other programs that mandate female participation. Section III provides background information on the setting of the RDP and women in the Solomon Islands. Section IV states the four main research objectives of the study. Section V describes the empirical design, including the data sources, identification strategy, and model used to complete the analysis. Section VI presents and has a discussion of the results. Section VII concludes.
II. Relevant Literature
II.1 Community-Driven Development
CDD is an approach that emphasizes community control over planning decisions and resource investments. The philosophy is that each local community has a right to be involved in their development process in a decision-making capacity. The community’s greater involvement often leads to a more effective use of resources and outcomes more in line with their needs (Wong, 2012). Despite the growing popularity of CDD programs, there is little evidence on their ability to improve local institutions and social capital in a fundamental and sustainable way.
In a critical review by Mansuri and Rao (2003), the authors concluded that evidence of the effectiveness of CDD initiatives lags considerably behind the rate at which such projects are being implemented and scaled-up. They provided examples of projects creating effective community infrastructure, but noted the lack of a causal relationship between any of the outcomes sought and the participatory elements of a given CDD project. More recently, Chase and Labonne (2010) examined the impact of a CDD program in the Philippines, in which communities competed for block grants for infrastructure investment. Their results showed improvements in participation in community assemblies. However, there was a negative impact on collective action and limited evidence supporting that trust increased.1 In a study in Sierra Leone, Casey, Glennester, and Miguel (2010) found that CDD programs and related donor projects significantly improved links between communities and local government officials and left communities materially better off, yet they also found no impact or effectiveness in fundamentally transforming local fundraising capacity,
1 Chase and Labonne (2010) use difference-in-difference and propensity score matching estimates to capture the average
making processes, or even social attitudes and norms.2 In short, previous studies suggest that CDD programs may increase interactions between community members and leaders, but they may not fundamentally improve long-term social capital.
II.2 Women’s Empowerment
Economists increasingly see investing in women as the key to development. For example, Duflo (2012) recently argued, “while development itself will bring about women’s empowerment, empowering women will bring about changes in decision-making, which will have a direct impact on development” (p. 1076). The low level of women’s participation in decision-making activities is seen as one of the greatest barriers to improving gender balance, which consequently hinders economic development. In 1990, the United Nations Economic and Social Council set the target of having 30 percent or more women in national legislative seats in each country worldwide. While 30 percent stands as the minimum, the parity zone is considered between 40 and 60 percent. As of January 2014, women held only 20.4 percent of the legislative seats across the world.3 In the Solomon Islands, women held none (Inter-Parliamentary Union, 2014).
CDD has the potential to address the persistent gender gap that limits or even prohibits women’s active participation in public decision-making. CDD programs can promote development and enhance women’s opportunities by not just allowing them to participate in decision-making, but instead requiring them to be part of the process. Whether or not women are included in or excluded from the political process can depend on several factors. For example, in the case of community forestry projects in India and Nepal, Agarwal (2001) claimed that women were excluded because of their weak bargaining power. Duflo (2012) has argued that the strongest barrier to improving female participation in policymaking is the widespread perception that women are not competent leaders. For instance, in her work with Beaman, Chattopadhyay, Pande, and Topalova (2009), they used experimental data from West Bengal and revealed that lower levels of satisfaction with women leaders was based on prejudicial views rather than actual performance. The study's reported outcomes on electoral data further showed that voter bias against women leaders decreased with greater (previous) exposure to female leaders.
2 Casey, Glennester, and Miguel (2010) evaluated GoBifo, which allotted block grants for constructing local public goods
and sponsoring trade skills training and small business start-up capital. Using household survey data with structured community activities (SCA), they used a randomized experimental research design to capture the causal impacts of the program.
3 As of January 2014, women held 20.8 percent of the legislative seats in the single or lower house and 18.2 percent in
Even when women have participated by right or as required, the evidence supporting equality, institutional efficiency, and other beneficial outcomes has been mixed. Research by Pande (2003) examined whether mandated political representation impacted policy for marginalized groups. She found an increase in the redistribution of resources in favor of the groups that benefited from political reservation. Similarly, Chattopadhyay and Duflo (2004) found that political quotas geared towards women shifted the composition of public spending toward goods they prefer.4 In contrast, Casey et al. (2012) found that, fours years after the CDD program in Sierra Leone was implemented with measures to enhance participation (i.e., promoting women to hold leadership positions, sign off on projects' finances, and attend meetings), women were no more likely to voice an opinion in community meetings or to play a leading decision-making role than in the past. The authors noted that the outcome might have come as a result of the traditional system in Sierra Leone, which is dominated by male leaders and has continued to the present day to exclude women. Similarly, Beath, Christia, and Enikolopov (2012) examined a CDD program in Afghanistan, where women are faced with stringent household restrictions that could limit the effect of a development intervention. They found that women’s participation and support for decision-making activities increased. However, there was no effect on the division of intra-household activities or on attitudes towards the general role of women in society. Even with the mixed results coming from the mandatory participation of women in development, evidence shows that women should not be excluded from the process. Participation in and of itself is a measure of citizenship rights and not allowing for equal participation tolerates institutional inefficiency.
II.3 Evaluation and Limitations
The length and timing of a study, as well as the effects of the local culture and social system, can be crucial when implementing and evaluating a CDD program. For example, Beath et al. (2009) argued that their evaluation was done prematurely (two years after the start of the program), which did not allow sufficient time for the deep social change required to recognize an impact. In Beaman et al. (2009), they found time-variant effects in the rating of female leaders, leading to the idea that a few years of exposure to a program is not sufficient.5 Also, Mansuri and Roa (2004) advised against taking a wholesale application of “best practices” to CDD evaluation, reasoning that each country is unique and should be evaluated according to its individual context. Wong (2012) also noted that a
4 In 1993, an amendment to the constitution of India required each state to both devolve more power over expenditures
to local community councils and to reserve one-third of all chief positions to women.
5 Beaman et al. (2009) found significant results only after two electoral cycles; female leaders in councils reserved for a
country's context is very important when initiating and evaluating a CDD because every country will have different complexities. For example, some countries may be suffering from financial crises, while others may be in post-conflict situations--or both. The Solomon Islands, as is discussed further below, is a country in the process of moving from post-conflict reconstruction to longer-term development.
Measuring women’s empowerment has its difficulties as well. For instance, it is challenging to define measures that clearly indicate if a development program has changed the status or perception of women in a community or country at-large and to what extent a possible change will be sustainable. Blattman, Green, Annan, and Jamison (2013) evaluated the impact of giving cash transfers and basic business skills training to the poorest and most marginalized women in a war-affected region of northern Uganda. Their results showed that, after 18 months, there was a large increase in income and wealth but no effect on women’s empowerment (i.e., household decision-making, independence, status in the community, or freedom from domestic violence). Garikipati (2008) has called this the “impact-paradox”, where households benefit from economic assistance targeting women, but the women themselves may not be empowered as a result. Garikipati further stated that women may, in fact, be disempowered when family assets are not co-owned.6 CDD projects can have the same problem, yet evidence in the field is limited. Nonetheless, efforts are being made to find ways to increase the meaningful engagement of women in community development, while also trying to effectively evaluate how women have participated, to what extent their needs were considered during decision-making, and whether or not they have benefited from such programs.
III. Setting
III.1 Solomon Islands Rural Development Program
From 1998 to 2003, the Solomon Islands underwent a period of civil conflict known as the ‘tensions’. Since then, the country has been trying to move from post-conflict reconstruction to longer-term development. In 2008, as one of the first phases for long-term growth, the government of the Solomon Islands, with the support of several funders, established a community-driven
development program known as the Rural Development Program (RDP).7 The RDP aims to foster
6 Garikipati (2008) evaluated the impact of loans procured by women on a several indicators. The author found that the
loans often enhanced the household’s assets and incomes, but lack of co-ownership of family assets may have further deepened the resource division between the wife and husband.
7 RDP is a US$22 million initiative executed and implemented by the Government of the Solomon Islands Ministry of
employment and income growth by focusing on participatory development, the demand-responsive provisions of government services, and the creation of a supportive economic environment for small-scale rural development. The program is expected to reach 70 percent of the rural population, targeting approximately 300,000 people across 60,000 rural households (World Bank, 2007).8
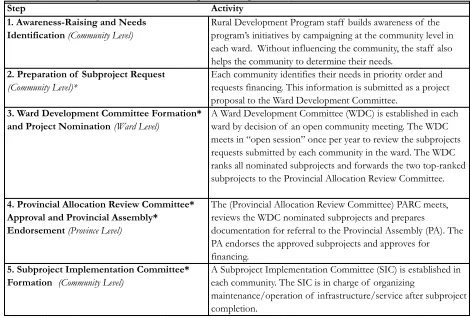
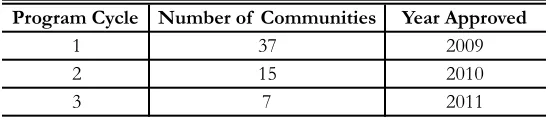
As part of its main strategy, the RDP provides support and funding at the community level for various infrastructure projects, such as the building of new schools, health services, roads, markets, water supply and sanitation systems, and community buildings. The RDP has been ongoing since 2008, with new projects being rolled-out almost ever year. The projects associated with this study were all implemented in one of the first three cycles of program rollout. Cycle one began in 2009 followed by cycles two and three in 2010 and 2011, respectively. The program cycle during which a given project was implemented was based upon the project's ranking amongst all the current proposals. The criteria used to rank the proposals included the quality and level of access to existing infrastructure and the percentage of the population a new project would serve. In some instances, the amount of funding available or the feasibility of a project altered the type or timing of the project actually approved. Figure 1 displays a more detailed account of the RDP project selection process, including the steps and committees involved and the types of activities taking place.
The explicit goals of the RDP are to 1) increase access to services and infrastructure projects and 2) increase satisfaction with the quality of infrastructures and services delivered through the variety of subprojects implemented. Additionally, one of the strategic goals is to ensure equality. To do this, the RDP requires all members of the community, including men and women, to be invited to participate in the subproject selection meeting. Then, at least one woman is required to serve on each of the following committees: the Sub-Implementation Committee (SIC), the Ward Development Committee (WDC), and the Provincial Allocation Review Committee (PARC). The committees and the associated roles are outlined in detail in Figure 1. In brief, the SIC is in charge of organizing the maintenance and operation of the infrastructure/service after a subproject's completion. The WDC ranks subproject options and makes recommendations to the PARC, which is responsible for the annual approval of subprojects that will go forward to the Provincial Assembly for endorsement. The RDP is one of the first and the largest community-driven development programs to be implemented in the Solomon Islands. With its mandates for female participation, the RDP safeguards equality by ensuring the significant and visible participation of women in the
8In 2010 it was estimated that 81 percent of the total population lived in rural areas with an annual rate of urbanization at
process of defining and making decisions about community needs and ensuring equal access to and distribution of the social and economic benefits of the subprojects (World Bank, 2007).
III.2 Women’s Status in the Solomon Islands
The Solomon Islands is an archipelago known for its complex and diverse culture. It is commonly regarded as a society in which women have a lower status than men. Although the United Nations Development Program publishes rankings on gender equality by country, the Solomon Islands has yet to be included. However, the Solomon Islands are ranked on other measures, such as the Human Development Indicator (HDI) and the Country Performance and Institutional Assessment (CPIA). The HDI for the country is 0.53, which places the Solomon Islands in the low human development category with a rank of only 143 out of 187 countries (UNDP, 2013). The HDI is not explicit to gender equality, as such an alternative measure is the CPIA gender equality indicator. The CPIA indicator gives the Solomon Islands a three out of a six-point scale. The CPIA score is also low as compared to many other countries, even as compared to
Step Activity
1. Awareness-Raising and Needs Identification (Community Level)
Rural Development Program staff builds awareness of the program’s initiatives by campaigning at the community level in each ward. Without influencing the community, the staff also helps the community to determine their needs.
2. Preparation of Subproject Request (Community Level)*
Each community identifies their needs in priority order and requests financing. This information is submitted as a project proposal to the Ward Development Committee.
3. Ward Development Committee Formation* and Project Nomination (Ward Level)
A Ward Development Committee (WDC) is established in each ward by decision of an open community meeting. The WDC meets in “open session” once per year to review the subprojects requests submitted by each community in the ward. The WDC ranks all nominated subprojects and forwards the two top-ranked subprojects to the Provincial Allocation Review Committee.
4. Provincial Allocation Review Committee* Approval and Provincial Assembly*
Endorsement (Province Level)
The (Provincial Allocation Review Committee) PARC meets, reviews the WDC nominated subprojects and prepares
documentation for referral to the Provincial Assembly (PA). The PA endorses the approved subprojects and approves for financing.
5. Subproject Implementation Committee* Formation (Community Level)
A Subproject Implementation Committee (SIC) is established in each community. The SIC is in charge of organizing
maintenance/operation of infrastructure/service after subproject completion.
Figure 1 - Rural Development Program Project Selection Process
other developing nations in Asia (4.5 = Vietnam; 4 = Cambodia, 3.5 = Loa PDR, Samoa, and
Vanuatu; 2.5 = Papua New Guinea) (World Bank, 2012).9
At all levels of politics, women are under-represented in the Solomon Islands. As of January 2014, no female members held a position in national parliament. At lower levels of government, males traditionally hold the power and leadership positions, especially in rural areas. While both matriarchal and patriarchal systems exist, it is still often assumed that men serve as authority figures, while women serve primarily domestic roles as caregivers (Japan International Cooperation Agency, 2010).
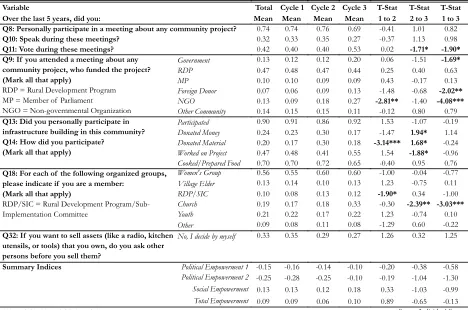
A recent RDP process evaluation supports the discrepancies between men’s and women’s
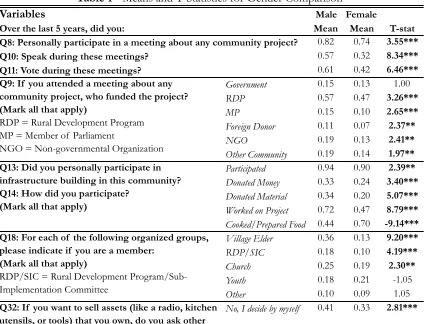
roles and activities (See Table 1 in Appendix A). The data from the evaluation showed that men's
participation in all types of community activities, except for attending government meetings, donating food to workers completing infrastructure-building projects, and participating in youth and ‘other’ types of community groups, was higher and statistically significant. Further, in each of the categories where the difference was not statistically significant (excluding participating in youth groups and donating food), men still participated more than women. The only thing women did significantly more than men was donate food to community projects, which is expected given the expectation of traditional gender roles.
VI. Key Research Objectives
What is being examined here is whether the RDP, a development program mandating female participation, has had a demonstrative effect on women living in a society characterized by gender discrimination. To answer this question, a set of research objectives were created to specifically analyze how the program has impacted female political and social empowerment within the community and the status of women in the household and, more broadly, in the community and general society.
IV.1 Women’s Political Empowerment
The low level of civic engagement and representation of women at all levels of government is holding back progress towards gender equality in the Solomon Islands. The mandatory inclusion and active participation of women in the RDP process is an opportunity to address inequality from the bottom up. It is expected that the program has and will continue to increase the level of
9 The International Development Agency (IDA) of the World Bank often uses the CPIA as an assessment guide (World
participation and meaningful engagement of women in local governance. Thus, the first research objective seeks to answer:
Research Question 1: Does a development program mandating female participation increase women’s activity in local governance?
IV.2 Women’s Social Empowerment
Similar to women’s political empowerment, the mandatory inclusion of women in the RDP has the potential to increase female mobility and expand opportunities for women to participate in other social and economic roles. As women are encouraged to participate in the RDP, it is expected that participation may carry over into other community roles and/or social groups. Thus, the second research objective seeks to answer:
Research Question 2: Does a development program mandating female participation increase women's engagement in social activities?
IV.3 Women’s Status in Household Decision-Making
Although the RDP focuses its attention on the role of women within the community, impacts may be seen in the household as well. As women increase their roles within the community, they may also become more empowered in their homes as a result.10 Thus, the third research objective tries to address:
Research Question 3: Does a development program mandating female participation increase women’s role in household decision-making?
IV.4 Women’s Status in Society
Lastly, the RDP is expected to improve the status of women within the community, as well as more broadly within society. In particular, women required to participate on a RDP SIC are expected to increase their own roles and personal skills within society. Community members may recognize this as a positive change and perceive the women as capable workers and leaders, approving of them holding other roles within the community. Thus, the final research objective seeks to answer:
Research Question 4: Does a development program mandating female participation improve the status of women in the community and society more broadly?
10 The reverse may also be true-- that an elevated status within the household may lead to greater political or social
V. Empirical Design
V.1. Data Sources
There are two key data sources for the study including a baseline and follow-up survey. Data from the baseline survey was collected in 2008, prior to the implementation of the RDP. It includes data from 1,388 households in 76 communities from the four pilot provinces (Choiseul, Malaita, Temotu, and Western). Shares of communities were sampled because they had been selected to receive the RDP program, while the rest were still awaiting the outcomes of their requests. Of note, the baseline and follow-up survey data only include 59 of the same set of communities. Thus, the sample size is reduced when matching the two data sets. Further, only key variables from the baseline are matched to the follow-up sample to control for baseline characteristics of both treatment and comparison communities. The variables account for the initial quality of and access to local infrastructure at baseline.
During June and July of 2013, a follow-up survey was conducted to gather data for a process evaluation of the RDP. As part of the data collection process, surveying was conducted in 80 communities equally distributed across the same four pilot provinces. The RDP communities in the sample were chosen using a quasi-random method.11 In nearly all of the communities visited, the RDP subprojects were completed or nearly complete. As discussed further in the identification strategy below, the communities visited were approved for subprojects in one of the first three cycles of the program rollout. The follow-up evaluation utilized an experiment and an individual, household, and community leader survey. For this study, however, only the individual and community leader survey data were utilized.
Individual survey: In each of the 80 communities visited, the individual survey was given to the 18 participants (stratified along gender) that were randomly selected to participate in the experiment.12 Also, two more people--one female leader and one male leader from each community--were asked to participate in the experiment and complete the survey (i.e., 20 individuals total from each community). After accounting for people leaving and/or not showing up for the experiment/survey, the total study sample included 1,520 individuals (772 men, 748 women).
11 Communities were chosen at random from a set of RDP communities in each province, but with differing levels of
“exposure” to the RDP (i.e., years the RDP has been in existence in a given community).
12 Upon arrival into each community, a meeting was called to which everyone in the community was invited. All
Community leader survey: In each of the 80 communities visited, a community leader survey was administered. During administration, typically at least the male and female leader from the experiment as well as a member of the RDP’s SIC were present. The number of respondents and title of each respondent was not always the same. The respondents varied based on availability. Also, given that one of the aims of the instrument was to critically analyze the RDP process, including the SIC, of which some of the respondents were members, the information collected may be biased. Nevertheless, the respondents were active members of the community with first-hand knowledge about the RDP.
V.2. Data Description
A. Individual Characteristics
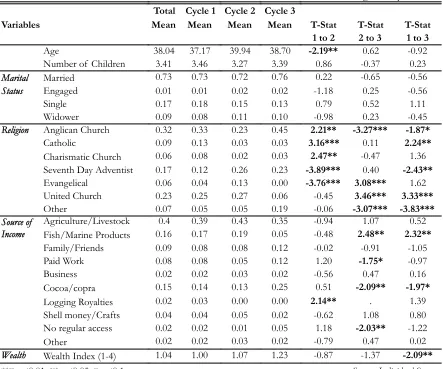
The analysis used only female observations and matched the follow-up survey with pre-treatment characteristics from the baseline survey. After combing both data sets, the final set included observations for 562 females. The average age of women in the sample at the time of the survey was 38 years old, about 73 percent were married, and on average, each woman had three to four children. The data did not include any detailed information about health, income, or educational status.13 However, there were some proxies to account for wealth, including if whether or not someone in the women’s home owned a radio, mobile phone, and/or outboard motor. Seventy-three percent of the sample reported they owned at least one of the items.14
Table 2 presents the details of the women’s individual characteristics, including the t-statistics for differences in means across the three program cycles. The results show some significant variations between the cycles in relation to age, religion, source of income, and wealth. For example, women in cycle one happened to be younger and rank lower on the wealth index than women in cycle two and cycle three.
Table 3 displays summary results for several of the key outcome variables. The results here also show some variation between the program cycles. Women in cycle three voted significantly more than women in cycles one and two. They also attended more government, foreign donor, and non-governmental organization meetings and belonged to significantly more church groups. Women
13 Other available data sources were considered. However, they all pre-dated the RDP implementation and as a result
would not be appropriate. The sources included the 2005/2006 National Household Income and Expenditure Survey (HIES), the 2007 Demographic and Health Survey, and the 2009 National Census.
14 Additionally, approximately 27 percent owned none of the proxies for wealth (radio, mobile phone, and/or outboard
in cycle two donated more money and materials and worked less on infrastructure projects. Lastly, women in cycle one participated less in RDP groups than women in the other two cycles.
B. Community Characteristics
The women examined came from 59 different communities. The average population of the communities was 540 people with a range of between 28 and 3,000 people. Table 4 displays more information on the community characteristics as well as cycle comparisons. There were only two statistically significant differences: cycle one had more communities in the Choiseul province than cycle three, and cycle three had more sanitation projects than cycle one. It should be reiterated that the projects are the type of RDP subprojects implemented in each community. The ‘other’ category included subprojects that were identified as either solar or radio.
The community baseline characteristics are also included in Table 4. The baseline variables were used to control for the pre-treatment status of the communities/community infrastructure. The variables specifically account for the level of access to and quality of important infrastructure within communities before RDP implementation. Baseline characteristics are a necessary component of the analysis because all communities within the sample have received a RDP subproject and the timing and selection of subprojects implementation was not random. Therefore, there is no clear treatment and control between communities that did and did not receive a project, respectively. Instead, the study compares women in groups of communities that were approved for a RDP subproject in an earlier cycle to women in communities that had subprojects approved in a later cycle. In other words, the study compares communities that have been exposed to the RDP intervention longer (i.e. treatment group) to communities that have been exposed to the RDP for a short duration (i.e. control group). Again, the baseline data is not used for any comparison purposes but serves to control for the pre-treatment characteristics that account for community status. Without the controls - if poorer communities or those without other projects were prioritized, impacts could be under-estimated, but if those with higher capabilities are prioritized, impacts may be over-estimated.
V.3. Empirical Strategy
infrastructure.15 As a result, baseline characteristics were matched to the sample and were used to control for the pre-treatment status of the communities. By controlling for these determinants of project allocation, all differences between communities related to treatment are removed and the causal effects of the program can potentially be identified.
The communities studied for this evaluation were chosen at random from a list of communities that had implemented RDP subprojects. Because all the communities had been treated, an effectiveness comparison was completed by reflecting on the amount of “exposure” to the treatment. For example, cycle one communities have been exposed to the RDP treatment longer than communities from cycles two and three, while cycle two communities have been exposed longer than cycle three.16 Figure 2 below depicts the number of cycles, the number of communities treated within each cycle, and the year of implementation. A more recent implementation year means less exposure to treatment and vice versa. Each cycle was separated by one year.
The strategy for testing each hypothesis was to regress the outcome measures on the treatment indicator variable (i.e., length of exposure to the RDP) and controls using the following OLS model:
!!"!!= !!!+!!!!!" +!!"! +!!!! +!!! +!!!+!!" (1)
where Yic is the given outcome for individual i in community c; Tic is the community treatment dummy taking a value of two, three, or four respective of the number of years a community has been exposed to the RDP; Xc is a vector of community-level controls; Zi is a vector of individual-level controls; Pc is a province fixed effect used to account for time-invariant province level characteristics; CC is a vector of community baseline characteristics17 that controls for community
15 The project rankings, which could have potentially been used with alternative methods to test outcomes, were not
available for the analysis. If project rankings were available, other identification strategies could have been considered, including techniques with matching, regression discontinuity, and/or even instrumental variables.
16 In other words, cycle one communities have been exposed to the RDP for four years, while cycle two and cycle three
communities have been exposed to the program for three years and two years, respectively.
17 In an attempt to mitigate type 1 (false positive) errors, the examination controlled for baseline/pre-treatment
covariates, using variables that measured the existing access to and quality of infrastructure projects. Given the inferential strategy, type I errors would have otherwise been more at risk due to the differences in pre-treatment levels and/or trajectories across the communities and the subsequent implausibility of the counterfactual provided by the control group.
Program Cycle Number of Communities Year Approved
1 37 2009
2 15 2010
3 7 2011
pre-treatment status; and !!"is the usual idiosyncratic error term. In each regression, standard errors were clustered at the community level to account for the fact that treatment was at the community level and individual errors could be correlated within the community. The parameter of interest is
!!.
To avoid over-testing whenever multiple outcomes exist for the same hypothesis and to improve statistical power, summary index tests similar to the one introduced by Anderson (2008) were implemented.18 A detailed breakdown of all the hypotheses, outcomes, variables, and composition of indices are outlined in Appendix B.
VI. Results
The analysis began by creating a master index, grouping all of the empowerment variables of interest together. The master index, the Women’s Empowerment Index, consisted of 19 different binary variables. Grouping the variables in such a way essentially reduced the analysis down to one single test to see if the RDP had a general effect. The results displayed below in Figure 3 show a positive effect size, statistically significant at the ten percent level, of 0.052 standard deviations. The result suggests that female empowerment does increase with greater exposure to the RDP. While this outcome is meaningful, it is also important to explore how the RDP impacted different types of empowerment as there maybe variation between different dimensions. To do this, the master index was broken down into three distinct categories of empowerment (i.e. political, social, and household) to see which areas the RDP had the most impact.
18 Anderson’s (2008) method is defined by grouping outcomes that are based on priori notions of importance. Then,
within the index less weight is given to the highly correlated outcomes, while more weight is given to outcomes that are uncorrelated and as a result represent new information.
Variables (1) (2) (3) Variables (1)
Length of Exposure 0.019 0.034 0.052* Three Years (Cycle 2) 0.009
(0.031) (0.034) (0.030) (0.063)
Individual Controls Y Y Y Four Years (Cycle 1) 0.082
Community Controls Y Y (0.066)
Baseline Controls Y Constant -0.041
Constant -0.247 -0.188 -0.122 (0.201)
(0.210) (0.187) (0.205) Observations 507
Observations 507 507 507 R-squared 0.192
R-squared 0.095 0.163 0.191
Figure 3 - Women's Empowerment (All Variables) Dependent Variable: Women's Empowerment Index
Clustered standard errors at the community level in parentheses *** p<0.01, ** p<0.05, * p<0.1
. . .by Length of Exposure
VI.1. Women’s Political Empowerment
The breakdown analysis of the master index began by looking at the most immediate effects the RDP intervention had on women's participation in local governance. The impact was examined by considering the types of community meetings in which women may have participated over a five-year period, as well as their level of participation, measured by whether or not they spoke and/or voted at any one of the meetings.19
A. Political Participation Index 1
In the first attempt to analyze the impact of the RDP on female political participation, the Political Participation Index 1 was utilized. The index consists of eight different outcome variables, including six for the different types of community meetings a woman could have attended and one each for if she spoke and/or voted at one of the meetings. Table 8 in Appendix C displays the main results, which suggest a positive effect size of 0.087 standard deviations. In other words, greater exposure to the RDP may lead to increased levels of empowerment for women in the political sphere. However, the results are statistically indistinguishable from zero.
B. Political Participation Index 2
In an attempt to deepen the understanding of the RDP’s impact on political empowerment, a second index and specification test was utilized. In Agarwal (2001), the typology of participation was discussed. Agarwal's first typology, passive participation, is described as attending a meeting and listening in on decisions without actively participating or speaking up. Meanwhile, expressing opinions or having a voice in the matters discussed in a meeting so as to influence a group’s decision is defined as active or interactive participation. Interactive participation is considered to be a more empowering feature. Thus, measuring the level of involvement for women who just spoke and/or voted at any of the meetings has the potential to offer more meaningful results. In this case, the Political Empowerment Index 2, consisting of only the variables for speaking and voting, was utilized. This index was regressed on the same controls as in the first index as well as on the type of meeting variables used in the first index along with their interaction with the treatment variable. The results seen in Table 9 in Appendix C suggest a negative effect of 0.016 standard deviations. This is contrary to the outcome found with the first index, suggesting women may have been attending
19 No information was available as to the total number of meetings each woman attended, or how many times she spoke
more meetings but not becoming more interactive participants as a result. However, again the results are statistically indistinguishable from zero.
Looking at the coefficients on the variables for the type of meetings that women could have attended, only community meetings associated with the RDP are statistically significant and positive. Of note, the only type of meeting in the sample known to mandate women’s participation is the RDP. Attending a RDP meeting had an effect size of 0.621 standard deviations and is statistically significant at the ten percent level. Attending a RDP interacted with the treatment variable has a 0.035 standard deviation effect size but is not statically significant. It should be noted that the ‘other’ type of meeting category interacted with the treatment variable indicated a positive and statistically significant result. Based on the understanding of the RDP and the Solomon Islands, there are two possible explanations for this. First, if it was assumed that the RDP meetings or ‘other’ types of meetings were the only new types of meetings to take place over the last five years, it could be suggested that the positive effect size could have been absorbed in the interaction term for ‘other’ types of meetings. However, under the same assumptions, it would also have been likely to see a positive and statistically significant impact in the RDP interaction term. Again, the RDP interaction term was positive but statistically insignificant. Second, there may have been a recall issue with the related survey questions. Respondents may not have accurately accounted for the type of meetings they attended or known who organized each of the meetings. As a result, responses could have defaulted to the ‘other’ category. There is little evidence to substantiate this conjecture, but there is plausibility in the assumptions.
V1.2. Women’s Social Empowerment
In examining the impact of the RDP on women’s social empowerment, another index was utilized. The Social Empowerment Index is constructed of ten variables, including six for the types of groups in which women could be a member (i.e., women’s group, village elder committee, RDP, church, youth, and/or other) and four for how they could participate in infrastructure building within the community (i.e., donate money, donate materials, work on project, and/or cook food). All activities mentioned provided women opportunities for mobility and social interaction within the community. Table 10 in Appendix C shows the results and indicates a summary effect size increase of 0.017 standard deviations. The outcome suggests that the RDP had a positive impact on women’s social participation; however, the results are again statistically insignificant.
V1.3 Women’s Status in Household Decision-Making
variable indicating whether or not a woman can make the decision to sell an asset alone was utilized. Table 11 in Appendix C shows a 5.9 percent increase between program cycles in the number of women who could decide on their own to sell an asset. When the numbers are broken down by program cycle, the results show a 6.5 percent difference between cycle two (i.e., three years of exposure) and cycle one (i.e., two years of exposure) and a 12.2 percent difference between cycle one (i.e. four years of exposure) and cycle three. Though these results are positive and support the theory that the RDP had a positive impact on women’s status in the household, the results in this case are also statistically insignificant.
V1.4 Women’s Status in Society
To test the fourth hypothesis, only statistical data from the community leader survey was utilized. It is important to recall that the community leader survey was completed by a group of community leaders in each community. Each community's respondent group composition was not always the same, but was designed to include the people with the best knowledge of the subject material. Though the results are likely biased, they are important to report, as they offer some insight as to the perception community leaders have on women within their communities. However, the viewpoints are solely of the community leaders surveyed and not necessarily representative of other members of the community.
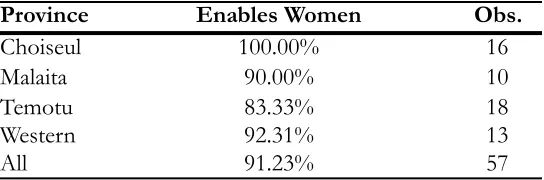
The community leaders were asked if they thought the RDP process enables women to influence decision-making more than other community projects. Approximately 91 percent of the 57 communities surveyed indicated "yes" (see Figure 4 below). The results are consistent throughout all of the surveyed provinces. When asked how the RDP processes enables women, the top three responses centered on having more women participate and make decisions (33 percent), having women on the RDP SIC (27 percent), and providing gender balance within the community (10 percent).
Province Enables Women Obs.
Choiseul 100.00% 16
Malaita 90.00% 10
Temotu 83.33% 18
Western 92.31% 13
All 91.23% 57
Figure 4
QE14: Do you think Rural Development Program processes enables women to influence decision-making
more than other community project?
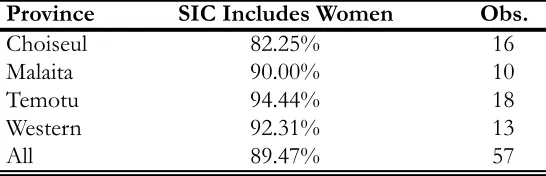
Figure 5 below reports how many of the communities have/had women on the RDP SIC. As stated previously, the SIC is a RDP subcommittee in charge of organizing the maintenance and operation of the infrastructure/service after a subproject's completion. The RDP requires at least one woman to serve on the SIC, but as the numbers below show, the quota for women was not being met in every community at the time of evaluation. Overall, 89 percent of the communities have/had women on the SIC. At the province level, Choiseul had the lowest proportion at 82 percent, while Temotu had the highest at 94 percent.
The results displayed in Figure 6 below show that membership on the SIC is often the first major community responsibility for the women involved. In Temotu, the province with the highest female SIC membership, 82 percent of communities reported it was the woman’s first major community responsibility. For Choiseul, the province with the lowest female SIC membership, 62 percent of the communities reported it was the woman’s first major community responsibility.
With regard to women’s status, program evaluation thus far has shown that the RDP has increased female community engagement via membership on the SIC. However, the findings do not demonstrate if women are increasing their participation in other areas of the community. Thus, the community leaders were further asked how the level of women’s activity inside and outside the community has changed since joining the SIC. Figure 7 below reviews the data for activity inside the community. In 80 percent of communities, the respondents reported that women have participated
Province SIC Includes Women Obs.
Choiseul 82.25% 16 Malaita 90.00% 10 Temotu 94.44% 18 Western 92.31% 13
All 89.47% 57
Figure 5
QE16. Did/do you have any women as members of your Sub-Implementation Committee (SIC)?
Source: Community Leader Survey
Province First Major Responsibility Obs.
Choiseul 61.54% 13
Malaita 66.67% 9
Temotu 82.35% 17
Western 75.99% 12
All 72.55% 51
Source: Community Leader Survey QE17: If so, was/is this their first major community
responsibility?
more in community activities since joining the SIC, while 20 percent responded that the level of activity has stayed the same.
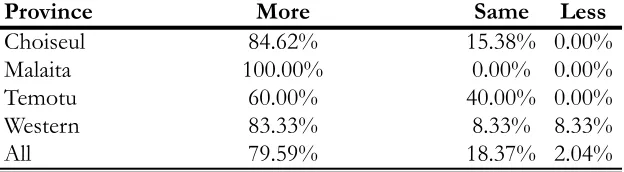
With regard to female activity outside the community (see Figure 8 below), in 80 percent of the cases, the leaders reported women have increased their engagement, while 18 percent said it stayed the same and two percent said it decreased.
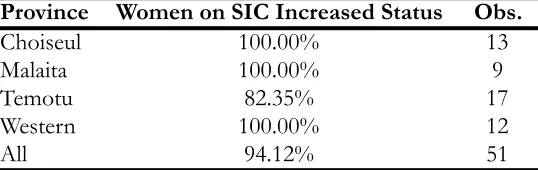
The last question in the set examined how female SIC members’ status changed in the community since joining the committee. All community respondents in Choiseul, Malaita, and Western reported that women on the SIC increased their status within the community (See Figure 9 below). For Temotu, however, the figure came in at only 82 percent.
Province More Same Less
Choiseul 100.00% 0.00% 0.00%
Malaita 88.89% 11.11% 0.00%
Temotu 50.00% 50.00% 0.00%
Western 91.67% 8.33% 0.00%
All 80.00% 20.00% 0.00%
Figure 7
QE18: If there was/is a women on the SIC, has her/their activity in the village changed since joining the SIC?
Source: Community Leader Survey
Province More Same Less
Choiseul 84.62% 15.38% 0.00%
Malaita 100.00% 0.00% 0.00%
Temotu 60.00% 40.00% 0.00%
Western 83.33% 8.33% 8.33%
All 79.59% 18.37% 2.04%
Source: Community Leader Survey
Figure 8
The last set of results provided information about how women are increasing their participation in other areas of the community as a result of the RDP. The responses suggest women who are part of the SIC are more active inside and outside the community and their status within the community has improved since joining the committee.
V1.5 Female Leaders
One of the concerns about implementing the RDP was that only existing women leaders would be nominated for or take-on the responsibilities of the new RDP roles. In some cases, the responsibility may have been an opportunity for ‘elite’ women to further elevate their status in the community, while, for others, it may have been a burden to take on additional tasks. As previously noted, the community leaders reported that, in almost 73 percent of the cases, membership on the RDP SIC was the first major community responsibility for the women involved (See Figure 6 above). This result offers some relief as to the concern of the RDP, but it is still important to further investigate the impact the RDP may have had on female leaders, as female leaders constitute a little over ten percent of the sample. Table 12 in Appendix D shows the results for the impacts on women leaders. The results suggest that female leaders had a positive and statistically significant impact on the political and social indicators. When comparing the outcomes across the cycles (female leader variable interacted with treatment variable), female leaders do not appear to be impacted differently than the rest of the female population, except when considering the Political Empowerment Index 2 indicator. The result suggests that female leaders may be more interactive participants overall and may be becoming increasingly more significant interactive participants in political settings.
V1.6 Discussion
The analysis suggests a statistical effect when all the empowerment variables are grouped into one index. However, the results are statistically insignificant, yet positive with regards to impacts
Province Women on SIC Increased Status Obs.
Choiseul 100.00% 13
Malaita 100.00% 9
Temotu 82.35% 17
Western 100.00% 12
All 94.12% 51
Figure 9
QE20: Do you think women who participated in the SIC increased their status in the community?
on female political empowerment, social empowerment, and household decision-making. With results indistinguishable from zero, there is concern for type II (false negative) errors. Four potential reasons for type II errors are: (1) inadequate statistical power; (2) slow onset of project impacts; (3) externalities; and/or (4) crowding out of other potential development projects.
A.
Inadequate Statistical Power
In this study, the analysis does not have enough statistical power to detect a true effect. In order to have been able to do so, a larger sample size or realized impact would have to have been achieved. For example, based on the sample size used, the minimum detectable effect for the indices ranged from between 0.210 and 0.280 standard deviations. Table 13 in Appendix D displays the power and minimum detectable effect for each outcome variable/index. It can be noted from the table that the statistical power for the analysis ranges from a low of four percent to a high of only 25 percent. For example, by looking at the information for the Political Empowerment Index 1, the data suggest that there was only a 14 percent chance of finding an effect if there was one, or an 86 percent chance of finding an effect that is not really there.
B.
Slow Onset of Project Impacts
Similar to other studies (see Beaman at al., 2009; Beath et al., 2009), the potential impact of the RDP could have be minimized by the length of the program to date; it may simply not have been around long enough to see the deep social change required to identify an impact. It could also be the case that comparing only communities that had been treated for longer or short periods of time by length of exposure to the treatment was not the most ideal identification strategy. An alternative would have been to compare communities that had been treated with a RDP subproject to communities that did not. With such a sample and supplemental data, other techniques, such as regression discontinuity or instrumental variable, could have been considered. In both cases, however, the project rankings, which determined treatment, would also have been needed. For regression discontinuity, the project rankings could serve as the threshold (i.e., comparing communities that had been treated to communities that have not been treated but have a similar project ranking). For instrumental variables, the ranking could be used as the actual instrument, as the rankings are a predictor of treatment, but arguably do not have an impact on the outcomes.
C.
Externalities and Crowding Out of Other Potential Development Projects
subproject in a later cycle, thereby reducing the ability to distinguish an impact. In the case of crowding out, it is possible that the implementation of a RDP subproject could be correlated with the implementation of other development programs. The impact could be negative if there is crowding out, or positive if other programs piggybacked on the RDP’s success. In order to address these concern, a list of the communities benefiting from other RDP subprojects would be needed as well as data on other development programs that have been implemented over the life span of the RDP.
VI. Conclusion
The nature of the RDP makes it arguably one of the most important instruments the Solomon Islands government has to actively remove some of the barriers to gender equality and in doing so, reducing poverty from the ground up. While the program has helped increase women's participation in the RDP’s projects and processes since 2008, women’s involvement outside the program appears limited. Through 2013 the data provide limited evidence that women have increased their participation in political, social, and household empowering roles. Coefficients on the empowerment measures are only positive and statistically significant when all outcome variables are combined into a single index. However, the analysis lacks statistical power to detect a true effect. Therefore, more research is needed to better evaluate the RDP and to understand the different gender aspects of men and women’s participation in the Solomon Islands both with regards to the RDP and society in general.
References
Anderson, M. L. (2008). "Multiple Inference and Gender Differences in the Effects of Early Intervention: A Reevaluation of the Abecedarian, Perry Preschool, and Early Training Projects." Journal of the American Statistical Association, 103 (484): 1481-1495.
Argarwal, B. (2001). “Participatory Exclusions, Community Forestry, and Gender: An Analysis for South Asia and a Conceptual Framework.” World Development 29 (10): 1623-48
Beaman, L., E. Duflo, R. Chattopadhyay, R. Pande, and P. Topalova (2009). “Powerful Women: Does Exposure Reduce Bias?” Quarterly Journal of Economics, 124 (4): 1497-1540.
Beath, A., F. Christia, R. Enikolopov (2012). “Empowering Women: Evidence from a Field Experiment in Afghanistan.” The World Bank Policy Research Working Paper No. 6269.
Blattman, C., E. Green, J. Annan, J. Jamison (2013). “Building Women’s Economic and Social Empowerment Through Enterprise: An Experimental Assessment of the Women’s Income Generating Support (WINGS) Program in Uganda.” Innovations for Poverty Action Policy Report.
Casey, K., R. Glennerster and E. Miguel (2012). “Reshaping Institutions: Evidence on Aid Impacts Using a Pre-analysis Plan.” Quarterly Journal of Economics, 127 (4): 1755-1812.
Central Intelligence Agency. (2014). The World Factbook: Solomon Islands. Updated March 27, 2014, Retrieved April, 2014, from https://www.cia.gov/library/publications/the-world-factbook/geos/bp.html
Chase, R., and J. Labonne (2010). “Do community-driven development projects enhance social capital? Evidence from the Philippines.” Journal of Development Economics, 96 (2): 348-358
Chattopadhyay, R. and E. Duflo (2004). “Women as Policy Makers: Evidence from a Randomized Policy Experiment in India. Econometrica, 72 (5): 1409-1443.
Duflo, E (2012). “Women Empowerment and Economic Development.” Journal of Economic
Literature. 50 (4), 1051-1079.
Garikipati, S (2008). “The Impact of Lending to Women on Household Vulnerability and Women‘s Empowerment: Evidence from India.” World Development, 36 (12), 2620-2642.
Glennerster, R., and K. Takavarasha. (2013). Running Randomized Evaluations: A Practical Guide. Princeton, New Jersey: Princeton University Press.
Inter-parliamentary Union (2014). Women in National Parliaments. Updated February 1, 2014, Retrieved April 5, 2014, from http://www.ipu.org/wmn-e/arc/world010213.htm.
Japan International Cooperation Agency. (2010). Country Gender Profile: Solomon Islands. Tokyo, Japan: Japan International Cooperation Agency. Retrieved April 5, 2014, from
http://www.jica.go.jp/english/our_work/thematic_issues/gender/background/pdf/e10sol. pdf
Mansuri, G. and M. Rao (2004). “Community-Based and –Driven Development: A Critical Review.”
Pande, R. (2003). “Can Mandated Political Representation Increase Policy Influence for
Disadvantaged Minorities? Theory and Evidence from India.” American Economic Review, 98 (4) 1132-1151
United Nations Development Programme (UNDP). (2013). “The 2013 Human Development Report - The Rise of the South: Human Progress in a Diverse World.” Human Development Report Office. Retrieved April 9, 2014, from
http://hdr.undp.org/sites/default/files/reports/14/hdr2013_en_complete.pdf
Wong, S. (2012). “What have been the impacts of World Bank-funded Community-Driven Development Programs?” World Bank Social Development Network Research Paper. Retrieved April 9, 2014, from
http://www-wds.worldbank.org/external/default/WDSContentServer/WDSP/IB/2012/06/14/000386 194_20120614062031/Rendered/PDF/695410WP0SW0CD00Box370017B00PUBLIC0.pdf
World Bank. (2007). Solomon Islands - Rural Development Program. Washington, DC: World Bank. Retrieved April 9, 2013, from
http://documents.worldbank.org/curated/en/2007/08/8148215/solomon-islands-rural-development-program
World Bank. (2012). “CPIA gender equality rating (1=low to 6=high),” World Bank, CPIA database (http://www.worldbank.org/ida). Retrieved April 5, 2014, from
Appendix Contents
Appendix A
: Summary Statistics and Comparison Tables• Table 1 – Gender Comparison
• Table 2 – Women’s Characteristics Across Program Cycles
• Table 3 – Women’s Outcome Variables Across Program Cycles
• Table 4 – Community Characteristics Across Program Cycles
Appendix B
: Summary Indices and Research Questions• Women’s Empowerment
• Women’s Political Empowerment
• Women’s Social Empowerment
• Women’s Status in Household Decision-Making
• Women’s Status in Society
Appendix C
: ResultsWomen's Political Empowerment
• Table 5 - Attended a Political Meeting
• Table 6 - Spoke at a Political Meeting
• Table 7 - Voted at a Political Meeting
• Table 8 - Political Empowerment Index 1
• Table 9 - Political Empowerment Index 2
Women’s Social Empowerment
• Table 10 - Social Empowerment Index
Women's Status in Household Decision-Making
• Table 11 - Ability to Make Decisions Alone, Selling as Asset
Appendix D
: Additional Information• Table 12 - Empowerment of Female Leaders
• Table 13- Power and Minimum Detectable Effect
Appendix E
: Case Study with policy/process recommendationsAppendix A
: Summary Statistics and Comparison TablesVariables
Over the last 5 years, did you:
Q8: Personally participate in a meeting about any community project? Q10: Speak during these meetings?
Q11: Vote during these meetings?
Government RDP MP Foreign Donor NGO Other Community Participated Donated Money Donated Material Worked on Project Cooked/Prepared Food Village Elder RDP/SIC Church Youth Other
No, I decide by myself
*** p<0.01, ** p<0.05, * p<0.1
Number of Observations: Q8-11: 566 Males, 557 Females; Q13: 560 Males, 550 Females; Q18: 549 Males, 540 Females; Q32: 561 Males, 542 Females
Table 1 - Means and T-Statistics for Gender Comparison
Q9: If you attended a meeting about any community project, who funded the project? (Mark all that apply)
RDP = Rural Development Program MP = Member of Parliament NGO = Non-governmental Organization
Q13: Did you personally participate in
infrastructure building in this community? Q14: How did you participate?
(Mark all that apply)
Q18: For each of the following organized groups, please indicate if you are a member:
(Mark all that apply)
RDP/SIC = Rural Development Program/Sub-Implementation Committee
Q32: If you want to sell assets (like a radio, kitchen utensils, or tools) that you own, do you ask other persons before you sell them?
Source: Individual Survey
Male Mean 0.82 0.57 0.61 0.15 0.57 0.15 0.11 0.19 0.19 0.94 0.33 0.34 0.72 0.44 0.36 0.18 0.25 0.18 0.10 0.41 Table 1 - Means and T-Statistics for Gender Comparison
Source: Individual Survey
Female Mean T-stat 0.74 3.55*** 0.32 8.34*** 0.42 6.46*** 0.13 1.00 0.47 3.26*** 0.10 2.65*** 0.07 2.37** 0.13 2.41** 0.14 1.97** 0.90 2.39** 0.24 3.40*** 0.20 5.07*** 0.47 8.79*** 0.70 -9.14*** 0.13 9.20*** 0.10 4.19*** 0.19 2.30** 0.21 -1.05 0.09 1.05 0.33 2.81***
Table 1 - Means and T-Statistics for Gender Comparison
Age
Number of Children
Marital Married
Status Engaged
Single Widower
Religion Anglican Church Catholic
Charismatic Church Seventh Day Adventist Evangelical
United Church Other
Source of Agriculture/Livestock
Income Fish/Marine Products Family/Friends Paid Work Business Cocoa/copra Logging Royalties Shell money/Crafts No regular access Other
Wealth Wealth Index (1-4) *** p<0.01, ** p<0.05, * p<0.1
Number of Observations: (Variable: Cycle 1, Cycle 2, Cycle 3) Age: 356, 142, 64; Number of Children: 357, 142, 63; Marital Status: 357, 142, 63; Religion: 355, 146, 64; Source of Income: 336, 136, 57; Wealth Index: 370, 150, 70
Table 2 - Means and T-Statistics for Women's Characteristics Across Program Cycles
Variables
Total Cycle 1
Mean Mean 38.04 37.17 3.41 3.46 0.73 0.73 0.01 0.01 0.17 0.18 0.09 0.08 0.32 0.33 0.09 0.13 0.06 0.08 0.17 0.12 0.06 0.04 0.23 0.25 0.07 0.05 0.4 0.39 0.16 0.17 0.09 0.08 0.08 0.08 0.02 0.02 0.15 0.14 0.02 0.03 0.04 0.04 0.02 0.02 0.02 0.02 1.04 1.00 *** p<0.01, ** p<0.05, * p<0.1
Number of Observations: (Variable: Cycle 1, Cycle 2, Cycle 3) Age: 356, 142, 64; Number of Children: 357, 142, 63; Marital Status: 357, 142, 63; Religion: 355, 146, 64; Source of Income: 336, 136, 57; Wealth Index: 370, 150, 70
Table 2 - Means and T-Statistics for Women's Characteristics Across Program Cycles Cycle 2 Mean 39.94 3.27 0.72 0.02 0.15 0.11 0.23 0.03 0.02 0.26 0.13 0.27 0.05 0.43 0.19 0.08 0.05 0.03 0.13 0.00 0.05 0.01 0.03 1.07
Number of Observations: (Variable: Cycle 1, Cycle 2, Cycle 3) Age: 356, 142, 64; Number of Children: 357, 142, 63; Marital Status: 357, 142, 63; Religion: 355, 146, 64; Source of Income: 336, 136, 57; Wealth Index: 370, 150, 70
Table 2 - Means and T-Statistics for Women's Characteristics Across Program Cycles Cycle 3 Mean 38.70 3.39 0.76 0.02 0.13 0.10 0.45 0.03 0.03 0.23 0.00 0.06 0.19 0.35 0.05 0.12 0.12 0.02 0.25 0.00 0.02 0.05 0.02 1.23
Number of Observations: (Variable: Cycle 1, Cycle 2, Cycle 3) Age: 356, 142, 64; Number of Children: 357, 142, 63; Marital Status: 357, 142, 63; Religion: 355, 146, 64; Source of Income: 336, 136, 57; Wealth Index: 370, 150, 70
Table 2 - Means and T-Statistics for Women's Characteristics Across Program Cycles
T-Stat T-Stat T-Stat
1 to 2 2 to 3 1 to 3
-2.19** 0.62 -0.92
0.86 -0.37 0.23 0.22 -0.65 -0.56 -1.18 0.25 -0.56
0.79 0.52 1.11
-0.98 0.23 -0.45
2.21** -3.27*** -1.87*
3.16*** 0.11 2.24**
2.47** -0.47 1.36
-3.89*** 0.40 -2.43**
-3.76*** 3.08*** 1.62
-0.45 3.46*** 3.33*** -0.06 -3.07*** -3.83*** -0.94 1.07 0.52 -0.48 2.48** 2.32** -0.02 -0.91 -1.05
1.20 -1.75* -0.97
-0.56 0.47 0.16
0.51 -2.09** -1.97*
2.14** . 1.39
-0.62 1.08 0.80
1.18 -2.03** -1.22
-0.79 0.47 0.02 -0.87 -1.37 -2.09**
Number of Observations: (Variable: Cycle 1, Cycle 2, Cycle 3) Age: 356, 142, 64; Number of Children: 357, 142, 63; Marital Status: 357, 142, 63; Religion: 355, 146, 64; Source of Income: 336, 136, 57; Wealth Index: 370, 150, 70
Source: Individual Survey