www.ijper.org
Development of a Validated Stability Indicating
Liquid Chromatographic Method for the
Determination of Pterostilbene
Mukthinuthalapati Mathrusri Annapurna*, Bukkapatnam Venkatesh, Gunnam Ravi Teja Department of Pharmaceutical Analysis and Quality Assurance, GITAM Institute of Pharmacy, GITAM University, Visakhapatnam-530045, Andhra Pradesh, INDIA.
ABSTRACT
Introduction: Pterostilbene, a stilbenoid possess diversified pharmacological activities. In the present study, a stability-indicating liquid chromatographic method was proposed for the determination of Pterostilbene in pharmaceutically available formulations. Materials and Methods: The chromatographic separation was achieved on Phenomenex C8 type column as stationary phase. UV detection was carried out at 219 nm. Pterostilbene was subjected to various stress conditions such as acidic, alkaline, oxidative, thermal and photolytic degradations. Results:The drug was found to be sensitive towards acidic and alkaline stress conditions. The proposed method was validated as per the ICH guidelines and successfully applied to the available marketed formulations. Conclusion:
The proposed method is selective, specific, robust and can be applied for the assay of pharmaceutical dosage forms.
Key words: Pterostilbene, Stability-Indicating, RP-HPLC, Validation, ICH guidelines.
DOI: 10.5530/ijper.52.4s.77 Correspondence: Prof. Mukthinuthalapati Mathrusri Annapurna,
Department of Pharmaceutical Analysis and Quality Assurance, GITAM Institute of Pharmacy, GITAM University, Rushikonda, Visakhapatnam, Andhra Pradesh-530045, INDIA. Phone: 91-9985654603 E-mail: mathrusri2000@ yahoo.com
INTRODUCTION
Pterostilbene (PTB), was first isolated from
Pterocarpus santalinus (red sandalwood),1
and is an active constituent in Pterocar-pus marsupium.2-5 It is traditionally used as
the medicine in the therapy of diabetes. It has also shown diversified pharmacological activities: anti hyper-glycemic;6 hypolididemic;7
anti-cancer;8-10 anti-diabetic11-13 and
anti-fungal14 properties. PTB, a methyl ether of
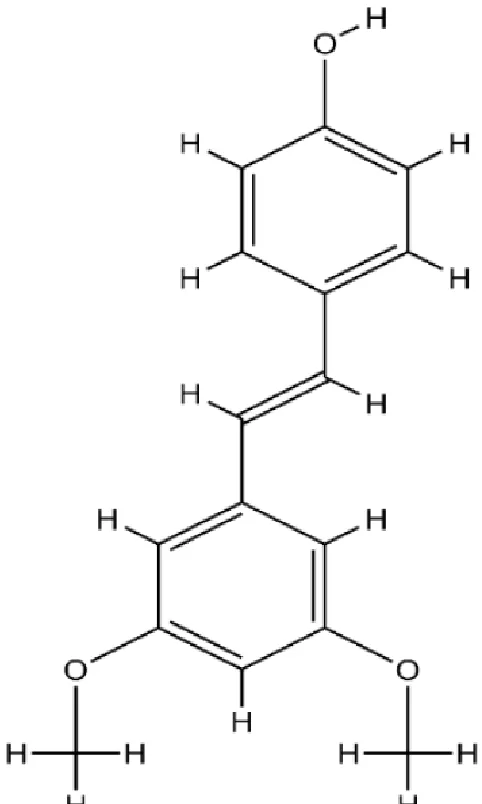
resveratrol, which is chemically 3,5-dime
-thoxy-4’- hydroxy-trans-stilbene (C16H16O3); Mol. Wt. – 256.296 g/mol (Figure 1). Only two liquid chromatographic methods have been developed for the determination of Pterostilbene, one with fluorescence detection15 and the other in rat plasma16 and
also one spectrophotometric method.17 Till
date from the literature available it is evident that no stability indicating liquid chromatographic method was available assay of Pterostilbene in formulations.
Submission Date: 28-11-2017;
Revision Date: 24-01-2018;
Accepted Date: 17-05-2018
MATERIALS AND METHODS
Instrumentation and Chromatographic Conditions
The chromatographic separation was suc
-cessfully achieved on - HPLC system: UFLC Shimadzu Prominence system (CBM-20Alite) model equipped with SPD M20A detector (PDA); Stationary Phase: Phenomenex C8 type column (250 mm × 4.6 mm i.d., 5 µm particle size); Mobile Phase: 0.1% Trifluo
-roacetic acid (TFA) in water (v/v): aceto
-nitrile (10:90 %, v/v); Flow rate: 0.6 ml/min; Injection volume: 20 µl; UV detection wave
-length: 219 nm; Temperature: Ambient (25°C).
Chemicals and Reagents
Pterostilbene standard (>99.0% purity) was obtained from Oxford laboratory, India. It is available as capsules with brand names: PTEROSTILBENE (Source Naturals Inc. (Canada); Label claim: 50 mg), PTEROS
-lina); Label claim: 100 mg). Trifluoroacetic acid (TFA), Water, Methanol, Sodium hydroxide (NaOH), Hydro
-chloric acid (HCl) and Hydrogen peroxide (H2O2) were
purchased from Merck (India) and all chemicals are of HPLC grade and used as received.
Preparation of 0.1% TFA Buffer (v/v)
The mobile phase was prepared by accurately transferring 1ml of TFA in to a 1000 ml volumetric flask and dissolved with HPLC grade water.
Preparation of Stock Solution
The stock solution was prepared by transferring accu
-rately 25 mg of PTB in to a 25 ml volumetric flask and diluting with mobile phase (1000 μg/ml) and further dilutions were made on daily basis from the stock solution with mobile phase as per the requirement.
Validation
The developed method was validated as per ICH Q2(R1) guidelines, 2005.18 The linearity (0.02–250 μg/ml) and
precision (10, 20 and 50 μg/ml) studies were conducted. The accuracy studies were accomplished with three pre-delineate spiked concentration levels (80, 100 and 120%). In robustness study the chromatographic condi
-tions were marginally modified for: flow rate (0.54 and 0.66 ml/min); % organic phase (88 and 92% v/v) and detection wavelength (217 and 221 nm). The robustness study was carried at a concentration level of 20 μg/ml of the standard. All the validation data obtained was taken in triplicate.
Forced Degradation Studies
To confirm that the analytical method is stability-indi
-cating, PTB was exposed to stress under to various conditions to accomplish forced degradation studies.19
As the present ICH guidelines did not make any statement regarding the detailed degradation conditions in the stress testing, the presently used forced degradation conditions were all based on trial and error.
Acidic degradation was performed by refluxing stock solution (1ml) with 1 ml of 1N HCl for a time of 60 min
at 80ºC in a thermostat, the solution was cooled, neutralized and then diluted as per requirement. Alkaline degradation was conducted by heating stock solution (1ml) along with 1 ml of 1N NaOH for a period of 60 min at 80ºC, later it was cooled, neutralized and then diluted as per requirement. During oxidative degradation, stock solution (1ml) was left in a 10ml volumetric flask with 1.0 ml of 30% H2O2 for a period of 60 min at
40ºC, later cooled and then diluted.Thermal degradation was conducted by exposing a definite quantity of PTB standard in solid state and also in solution state to dry heat in a hot air oven maintained at 80 ºC continuously for 7 days and the resultants were cooled and diluted before the study. For Photolytic degradation, the sample in solid state taken in a petri-plate and placed in a UV cabinet for the exposure to cool florescent and near UV lamp continuously for about 7 days. The sample was spread as a thin layer and sealed with a transparent cover to minimize the effects of the changes in the physical state. . The solu
-tion was prepared with acetonitrile and further dilu-tion with diluent.
Assay of Marketed Formulations
Twenty capsules of each brand of PTB were procured from the local pharmacy store, weighed, crushed into fine powder and was extracted and filtered, from which
Table 1: Comparison of Previously Published Methods for Pterostilbene with Present Method.
Mobile phase/Reagent λ (nm) Linearity (µg/ml) Method Reference
Acetonitrile: water (50:50, v/v) Excitation 330Emission 374 5-100 HPLC 15
Acetonitrile: 0.1% formic acid 320 0.2-20 HPLC 16
0.1% TFA: Acetonitrile (10:90) 219 0.02-250 Stability indicating RP-HPLC Present work
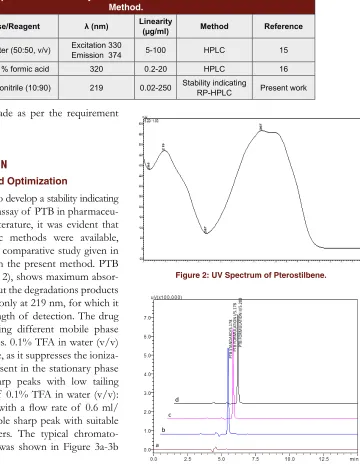
Figure 2: UV Spectrum of Pterostilbene.
Figure 3: Typical Chromatograms of: (a) Blank; (b) Pterostil-bene standard (20 μg/ml); (c) Formulation I (20 μg/ml) and (d)
Formulation II (20 μg/ml)
the final dilutions were made as per the requirement prior analysis.
RESULTS AND DISCUSSION
Method Development and Optimization
An attempt has been made to develop a stability indicating RP-HPLC method for the assay of PTB in pharmaceu
-tical products. From the literature, it was evident that only two chromatographic methods were available, which were summarized in comparative study given in Table 1 and compared with the present method. PTB in its UV spectrum (Figure 2), shows maximum absor
-bance at 219 and 307 nm, but the degradations products formed were clearly detect only at 219 nm, for which it was selected as the wavelength of detection. The drug samples were analyzed using different mobile phase compositions and flow rates. 0.1% TFA in water (v/v) is adopted as aqueous phase, as it suppresses the ioniza
-tion of residual silinols present in the sta-tionary phase and thereby facilitates sharp peaks with low tailing factor. Finally, a mixture of 0.1% TFA in water (v/v): acetonitrile (10:90%, v/v) with a flow rate of 0.6 ml/ min has produced a desirable sharp peak with suitable system suitability parameters. The typical chromato
-grams of blank and PTB was shown in Figure 3a-3b respectively.
Method Validation
The method was validated for system suitability, linearity, limit of quantitation (LOQ), limit of detection (LOD), precision, accuracy, selectivity and robustness.18
Linearity
PTB shows linearity over a concentration range of
0.02–250 μg/ml, with their percentage relative standard deviations (%RSD) in limits (Table 2). The limit of quantitation (LOQ), limit of detection (LOD) were found to be 0.01965 and 0.00648 μg/ml respectively.
Accuracy
The method accuracy was demonstrated by the % recovery at three different concentrations i.e., 36, 40
and 44 µg/ml (80, 100 and 120%), in which the known amount of standard was spiked to the samples. The % recovery was found to be 98.91-99.59% and %RSD in limit with and very low standard error mean (SEM).
Precision
Precision studies were conducted at three concentrations i.e., 10,20, 50 µg/mlfor both intra-day and inter-day precision for which the %RSD was found to be 0.02-0.67% (Table 3).
Table 2: Linearity of Pterostilbene.
Concentration (µg/ml) *Mean Peak Area ± SD RSD (%)
0.02 3425 ± 10.96 0.32
0.5 85138 ± 127.71 0.15
1 170349.09 ± 545.12 0.32
2 342598 ± 1438.91 0.42
5 852099 ± 937.31 0.11
10 1701798 ± 1361.44 0.08
15 2577209 ± 9793.39 0.38
20 3409584 ± 15343.13 0.45
50 8513960 ± 23839.09 0.28
100 17909796 ± 66266.25 0.37
200 34095870 ± 61372.57 0.18
250 42618800 ± 268498.44 0.63
Slope ± SD : 175933.33 ± 9199.66
Intercept ± SD : 42115.67 ± 818.61
: 0.9997
(LOD) : 0.00648
(LOQ) : 0.01965
(Range) : 0.02-250
*Mean of three replicates
The robustness of the method was estimated by assaying the sample in diverse analytical conditions by deliberately making slight fluctuations the original condition. From the results (Table 4), it was shown that the system suitability parameters, retention times and the assays for the test solution was not much affected there by signifying that the method is robust.
Stress degradation studies
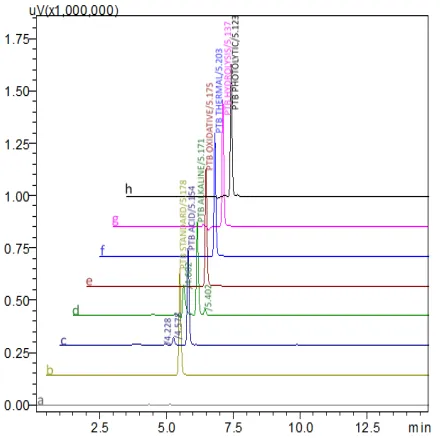
The stability-indicating capability of the method was established from the separation of PTB peak from the degradation peaks of degraded samples. Figure 5 has shown the evidence of chromatograms of the stressed
samples. PTB shows sufficient degradation in acidic and alkaline stress conditions, which resulted in the forma
-tion of degradant peaks at 3.207, 4.288 and 4.578 min in acid degradation and at 4.602 and 5.492 min during alkaline degradation. The drug peak was separated properly with better resolution from the so formed degradants, for which the system suitability parameters were within the acceptance criteria as shown in Table 5. The 3D chromatograms for the degradation studies were obtained from the PDA data which shows the selectivity of the wavelength and the degradation peaks at the wide range of wavelength (Figure 4a-4g). During the optimization of the conditions for oxidative stress
Table 3: Precision and Accuracy Studies of Pterostilbene.
Concentration (µg/ml)
Intra-day Precision Inter-day Precision * Measured
Concentration (µg/ml) ±
SD %RSD SEM
* Measured Concentration (µg/
ml) ± SD %RSD SEM
10 9.99 ± 0.03 0.03 0.0015 9.75 ± 0.04 0.02 0.0012
20 19.97 ± 0.02 0.02 0.0021 19.98 ± 0.13 0.67 0.0768
50 50.07 ± 0.07 0.15 0.0424 49.72 ± 0.26 0.53 0.1513
Accuracy
Spiked Concentration (µg/ml) Total Concentration (µg/ml) * Concentration Found (µg/ml) ± SD %RSD SEM %Recovery
16 (80 %) 36 35.61 ± 0.0568 0.16 0.0911 98.91
20 (100 %) 40 39.64 ± 0.0210 0.05 0.0303 99.11
24 (120 %) 44 43.82 ± 0.2109 0.48 0.2767 99.59
Table 6: Assay of Available Formulations. Formulation Labelled claim(mg) found* (mg)Amount Recovery*%
I 50 49.38 98.75
II 50 49.37 98.94
Table 5: Forced Degradation Studies of Pterostilbene.
Stress Conditions Retention time (R
t)
*Drug recovered (%)
*Drug decomposed
(%)
Theoretical
plates (N) Tailing factor Extra peaks Resolution (R)
Standard 5.178 100.00 0.00 15342.694 1.269 -
-Acidic degradation 5.154 92.35 7.65 15453.164 1.278 3.207 3.497
4.228 4.578
Alkaline degradation 5.171 95.43 4.57 14508.194 1.273 4.602 2.797
5.492
Oxidative degradation 5.175 93.01 6.99 15602.304 1.274 -
-Thermal degradation 5.203 97.21 2.79 14911.933 1.279 -
-Hydrolysis 5.137 99.13 0.87 14323.968 1.261 -
-Photolytic degradation 5.123 96.37 3.63 14912.366 1.266 -
-*Mean of three replicates
Table 4: Robustness Study of Pterostilbene.
Parameter (condition) *%Assay ± SD %RSD SEM *Retention time ± SD %RSD SEM
Mobile phase flow rate (± 10%)
(0.54 ml/min) 100.00 ± 0.0121 0.01 0.0070 5.19 ± 0.0154 0.2965 0.0089
(0.66 ml/min) 99.02 ± 1.6933 1.71 0.9776 4.89 ± 0.0172 0.3521 0.0099
Detection wavelength (± 2 nm)
(217 nm) 98.03 ± 1.6902 1.72 0.9758 5.21 ± 0.0065 0.1248 0.0038
(221 nm) 99.85 ± 0.0364 0.04 0.0210 5.20 ± 0.0036 0.0693 0.0021
Mobile phase composition (0.1% TFA: Acetonitrile) (±2, v/v)
(12:88, v/v) 99.99 ± 0.0099 0.01 0.0057 5.22 ± 0.0316 0.6042 0.0182
(08:92, v/v) 99.81 ± 0.0634 0.06 0.0366 5.20 ± 0.0032 0.0619 0.0019
*Mean of three replicates
degradation study, the strength of the Hydrogen perox
-ide was varied for 3% Hydrogen perox-ide and finally to 30% Hydrogen peroxide. Even at the final condition the drug have shown almost no degradation. As mentioned in the ICH Q1B Guidelines,20 for photo-stability forced
degradation studies, a variety of exposure conditions may be used, depending on the photo sensitivity of the drug. It is appropriate to limit the exposure and end the study if extensive degradation occurs. But in our case, the dug has almost shown no degradation even exposed for 7 days.
Analysis of commercial formulations
The proposed method was applied to the assay of available formulations for the determination of PTB. The % recovery was found to be 98.75-98.94 (Table 6).
The resultant chromatograms obtained for the assay of marketed formulations were shown in Figure 3c-3d.
CONCLUSION
The proposed stability-indicating HPLC method for the determination of PTB in pharmaceutical dosage forms was developed and validated as per ICH guide
-lines. The water used in this method development is of HPLC grade and was procured from Merck (India). The method has produced precise results during the inter-day precision studies which was conducted in 3 differ
-ent days, which implies that the water quality shows no effect in the method development.. From the forced degradation studies it was clear that PTB was tends to be more sensitive towards acidic and alkaline degrada
Figure 5: Typical chromatograms of Pterostilbene (a) Blank (b) Standard (20 μg/ml) (c) Acidic (d) Alkaline (e) Oxidative (f)
Thermal (g) Hydrolysis (h) Photolytic degradations
so formed degradants obtained during stress degradation studies. The developed method was successfully applied to the available formulations. This method can be helpful for the long term stability studies and also to the kinetics studies.
ACKNOWLEDGEMENT
The authors are grateful to University Grants Commis
-sion, New Delhi, India for the financial support and M/s GITAM (Autonomous) (Deemed to be University) Visakhapatnam for providing research facilities. The authors are very much thankful M/s Symed labs for providing the gift samples of Pterostilbene and there is no conflict of interest..
CONFLICT OF INTEREST
Authors decalare no conflict of interest.
ABBREVIATIONS
PTB: Pterostilbene; RP:HPLC: Reverse Phase High Performance Liquid Chromatography; TFA: Trifluo
-roacetic acid; ACN: Acetonitrile; NaOH: Sodium hydroxide; HCl: Hydrochloric acid; H2O2: Hydrogen peroxide; ICH: International Conference on Harmoni
-zation; RSD: Relative Standard Deviation; LOQ: Limit of Quantitation; LOD: Limit of Detection
REFERENCES
1. Seshadri TR. Polyphenols of Pterocarpus and Dalbergia woods. Phytochemistry. 1972;11(3):881-98.
2. Fuendjiep V, Wandji J, Tillequin F, Mulholland DA, Budzikiewicz H, Fomum ZT,
et al. Chalconoid and stilbenoid glycosides from Guibourtia tessmanii. Phytochemistry. 2002;60(8):803-6.
3. Pezet R, Pont V. Identification of pterostilbene in grape berries of Vitis
vinifera. Plant Physiol. Biochem. 1988;26(5):603-7.
4. Adrian M, Jeandet P, Douillet-Breuil AC, Tesson L, Bessis R. Stilbene content of mature Vitis vinifera berries in response to UV-C elicitation. J. Agric. Food Chem. 2000;48(12):6103-5.
5. Breuil ACD, Jeandet P, Adrian M, Bessis R. Changes in the phytoalexin content of various Vitis spp. in response to ultraviolet C elicitation. J. Agric. Food Chem. 1999;47(10):4456-61.
6. Manickam M, Ramanathan M, Jahromi MAF, Chansouria JPN, Ray AB. Antihyperglycemic activity of phenolics from Pterocarpus marsupium. J. Nat. Prod. 1997;60(6):609-10.
7. Rimando AM, Cuendet M, Desmarchelier C, Mehta RG, Pezzuto JM, and Duke SO. Cancer chemopreventive and antioxidant activities of pterostilbene, a naturally occurring analogue of resveratrol. J. Agric. Food Chem. 2002;50(12):3453-7.
8. Roberti M, Pizzirani D, Simoni D, Rondanin R, Baruchello R, Bonora C,
et al. Synthesis and biological evaluation of resveratrol and analogues as apoptosis-inducing agents. J. Med. Chem. 2003;46(16):3546-54.
9. Tolomeo M, Grimaudo S, Cristina AD, Roberti M, Pizzirani D, Meli M, et al.
Pterostilbene and 3′-Hydroxypterostilbene are effective apoptosis-inducing
agents in MDR and BCR-ABL-expressing leukemia cells. Int. J. Biochem. Cell Biol. 2005;37(8):1709-26.
10. Ferrer P, Asensi M, Segarra R, Ortega A, Beniloch M, Obrador E, et al. Association between pterostilbene and quercetin inhibits metastatic activity of B16 melanoma. Neoplasia. 2005;7(1):37-47.
11. Stivala LA, Savio M, Carafoli F, Perucca P, Bianchi L, Maga G, et al. Specific
structural determinants are responsible for the antioxidant activity and the cell cycle effects of resveratrol. J. Biol. Chem. 2001;276(25):22586-94. 12. Akansha M, Rohit S, Swayam PS, Sudeep G, Rakesh M, Akhilesh KT, et
al. Confirmation towards establishing antidiabetic activity in heart wood of
Pterocarpus marsupium and analysis of phytoconstituents. Indian J. Exp. Biol. 2013;51:363-74.
13. Amorati R, Lucarini M, Mugnaini V, Pedulli GF. Antioxidant activity of hydroxystilbene derivatives in homogeneous solution. J. Org. Chem. 2004;69(21):7101-7.
14. Jeandet P, Douillet-Breuil AC, Bessis R, Debord S, Sbaghi M, Adrian M. Phytoalexins from the Vitaceae: Biosynthesis, phytoalexin gene expression in transgenic plants, antifungal activity, and metabolism. J. Agric. Food Chem. 2002;50(10):2731-41.
15. Connie MR, Jaime AY, Kathryn AR, Neal MD. High-performance liquid
chromatographic analysis of pterostilbene in biological fluids using fluorescence detection. J. Pharm. Biomed. Anal. 2007;43(1):250-4.
16. Lin HS, Yue BD, Ho PC. Determination of pterostilbene in rat plasma by a simple HPLC-UV method and its application in pre-clinical pharmacokinetic study. Biomed. Chromatogr. 2009;23(12):1308-15.
17. Mathrusri Annapurna M, Sai Phani Kumar J. New derivative and differential spectrophotometric methods for the determination of pterostilbene - an antioxidant. Pharm. Methods. 2015;6:143-7.
18. ICH: Validation of analytical procedures. Text and methodology Q2 (R1), International Conference on Harmonization. 2005.
19. ICH: Stability testing of new drug substances and products Q1A (R2), International Conference on Harmonization. 2003.
Cite this article: Annapurna MM, Venkatesh B, Teja GR. Development of a Validated Stability Indicating Liquid Chromatographic Method for the Determination of Pterostilbene. Indian J of Pharmaceutical Education and Research. 2018;52(4S):S63-S70.
SUMMARY
• Pterostilbene is a stilbenoid, with diversified phar-macological activities such as oxidant, anti-inflammatory, anti-diabetic, anti-cancer etc. • A new stability-indicating RP-HPLC method has
been developed and validated (ICH guidelines) for the determination of Pterostilbene.
• Optimized chromatographic conditions –
• Mobile Phase: Trifluoroacetic acid in water: Aceto-nitrile (10:90 %, v/v)
• Flow rate: 0.6 ml/min (UV detection at 219 nm).
Prof. Mukthinuthalapati Mathrusri Annapurna is working at GITAM Institute of Pharmacy, GITAM (Deemed to be University), Visakhapatnam, India. She pursued her B. Pharm (1990) and M. Pharm (1993) from Andhra University, Visakhapatnam and Ph.D from Berhampur University, Orissa. Her research is keenly focussed on analytical method development, validation and degradation studies of drug molecules. She also explores computer augmented simulated studies of metal complexes of drug molecules.
About Authors
PICTORIAL ABSTRACT
Mr. Bukkapatnam Venkatesh: Obtained his M.Pharm (2013) and currently pursuing Ph.D. (Pharmaceutical Analysis) (JRF-UGC) at GITAM Institute of Pharmacy, GITAM (Deemed to be University), Visakhapatnam, India.