Iranian Journal of Language Teaching Research 1(2), (July, 2013) 37-64 37
* Corresponding author: The University of Groningen, The Netherlands Email address: [email protected]
© Urmia University Press
Urmia University
Two studies were carried out in order to create distinct motivational profiles of students, examine the way in which context had an effect on motivational styles, and attempt to collaborate these findings with the L2 Motivational Self-System. The research questions for this study were concerned with ascertaining whether or not it is possible to identify distinct learner types in terms of their motivational profiles; and to what extent different aspects of motivation contribute towards distinguishing different motivational profiles. The participants for the first study were 42 Dutch university students of English; and the participants for the second study were 26 adult learners of English at a language school in Sydney, Australia. In order to construct the motivational profiles, several exploratory statistical procedures were carried out, including principal components analysis and cluster analysis. The results found that the strength of the factors extracted in the principal components stage differed depending on the context of each study. In addition, the motivational profiles that were formed during the cluster analyses revealed distinct subgroups of learners which displayed varying levels of homogeneous characteristics.
Keywords: motivation; context; motivational self-system; L2 learning
© Urmia University Press
Received: 24 Dec. 2012 Revised version received: 20 Apr. 2013
Accepted: 25 Apr. 2013 Available online: 15 May 2013
L2 motivation profiling and the role of context: A study
in exploratory statistical procedures
Lousia Vahtrick
a, Kees de Bot
a*a
The University of Groningen, The Netherlands
A B S T R A C T
A R T I C L E S U M M A R Y
Content list available at www.urmia.ac.ir/ijltr
Iranian Journal
of
38 Vahtrick & de Bot/L2 motivation profiling ….
Introduction
The concept of motivation as one of the most influential individual differences associated with successful mastery of a second language has long been a primary focus of the field of applied linguistics. However, unlike many individual differences which can be quantifiably measured on an accurate scale (e.g. age or length of time learning the language), there is much debate in the literature as to what exactly motivation is comprised of and what effect it has on outcomes and proficiency in learning a second language (L2). In addition, traditional research designs have failed to incorporate L2 motivation research into the wider field of linguistic research, as the former‟s research designs are often product rather than process related. In an attempt to correct this, Dörnyei (2005) proposed a model he named the L2 Motivational Self-System, which focused on the idea of „possible selves‟, as well as stressing the importance of context to the language learning experience. It has been argued (Skehan, 1991) that within larger bodies of language learners, there are smaller sub-groups of learners which naturally group together as a result of demonstrating particular motivational patterns. Investigating these groups not only allows researchers to explore the complex interactions of variables which are thought to relate to motivation, but also contributes to the study of effective language teaching within a classroom (Alexander & Murphy, 1999).
A study conducted by Csizér and Dörnyei (2005) used cluster analysis as a means of investigating intra-individual differences across a variety of measures relating to motivation. The study constructed motivational profiles of students and then applied them to the L2 Motivational Self-System. This research design therefore demonstrated a possible initial step for a larger study that would exhibit a process rather than product-related design and acted as the impetus for the current study.
This paper is concerned with four research questions:
1. Is it possible to identify distinct learner types in terms of their motivational profiles?
2. How do the different aspects of motivation contribute towards distinguishing different motivational profiles?
3. To what extent does context (i.e. the environment in which the language is learned) affect the construction of motivational profiles?
4. What conclusions can we draw from the construction of motivational profiles and what pedagogical implications will these conclusions have?
Iranian Journal of Language Teaching Research 1(2), (July, 2013) 37-64 39
Background
Conceptualising motivation
The Socio-Educational Model (Gardner, 1985) has been one of the most influential models of second language acquisition (SLA) and dominated the field in the second half of the twentieth century. The model was primarily concerned with the role individual differences play in SLA. The core finding made by the socio-educational model when it was investigated using causal modelling is that the factor that is most linked to second language proficiency and success is motivation, with attitudes towards the learning situation and integrativeness acting as supporting factors of motivation (Gardner, 1985). In addition, the model allows for motivation in an individual learner to be influenced by numerous other variables, including integrative and instrumental orientations. An integrative orientation could include wishing to participate in the activities of a different cultural group or making more friends amongst people from that group. In contrast, a learner who has an instrumental orientation wishes to learn a particular language because of the pragmatic benefits associated with the language. This could include the promise of a better job or an increased ability to compete with others (Gardner & Lambert, 1972).
In addition to Gardner‟s work, research into the effect that self-confidence and anxiety have on one‟s motivation to learn a second language have gradually been incorporated into research on motivation. When looking at self-confidence, Richard Clément‟s research that focused on the Canadian context and the relationship between the Anglophone and Francophone communities has proven influential. He argued that linguistic self-confidence becomes a natural determiner for motivation to learn a second language when two language communities can be found in the same place (Clément &Kruidenier, 1985) and many studies have reported significant correlations between indices of self-confidence and L2 proficiency (e.g. Clément, Dörnyei & Noels, 1994; Gardner, Tremblay & Masgoret, 1997). When looking at anxiety, several studies have found that as proficiency increases, anxiety decreases, and that there is a negative correlation between these two factors (Bernaus& Gardner, 2008; Clément, Dörnyei & Noels, 1994). However, several studies have found the opposite. Kleinmann (1977), for example, found that students who performed more proficiently when required to use difficult linguistic structures reported higher levels of anxiety than those students who did not perform as proficiently. It is possible that correlations between anxiety and performance are dependent upon variables, including, but not limited to, context. It is also possible that anxiety can have a facilitating effect when the gaps between the students‟ perceived level of proficiency and their desired level of proficiency are seen as possible to navigate, i.e. the learners feel that closing such a gap is feasible. When a student does not believe that bridging this gap is possible, anxiety begins to have a debilitating effect. Tremblay and Gardner (1995, p.507) suggest that: “The higher the expectancy that a behaviour can produce a specific outcome, the greater tends to be the motivation to perform the activity.”
Gardner‟s instrumental and integrative orientations as well as measures of self-confidence and anxiety have been widely used in the study of L2 motivation since the initial publication of Gardner‟s model (1985). It has been argued (Jacques, 2001) that one of the principal reasons that Gardner‟s model has been so influential is that he also aided in the creation around this time of the Attitudes and Motivation Test Battery (AMTB), (Gardner &Smythe, 1981). The AMTB has been widely implemented in the field of L2 motivational research (e.g. Gardner, Tremblay & Masgoret, 1997).
40 Vahtrick & de Bot/L2 motivation profiling ….
dominated the field thoroughly yet only examined limited paradigms, such as integrative and instrumental orientation. Drawing on both Attribution Theory (Weiner, 1972) and Self-Determination Theory (Deci& Ryan, 1985), Dörnyei conceptualised what he termed the L2 Motivational Self-System (2005). This theory draws on the idea of possible selves, a concept first introduced by Markus and Nurius (1986). Dörnyei states: “I believe that possible selves offer the most powerful, and at the same time the most versatile, motivation self-mechanism, representing the individual‟s ideas of what they might become, what they would like to become, and what they are afraid of becoming.” (2005, p. 98). Dörnyei (2005) is primarily concerned with two types of possible selves- the ideal self and the ought-to self (Higgins, 1987).
Motivation research designs
Despite the relatively robust theories surrounding the role that individual differences such as motivation, attitudes, self-confidence, anxiety, and perceived proficiency play in successful L2 acquisition, motivation research has yet to be fully integrated into the broader field of SLA research. Dörnyei (2003) argues that this is because motivation research designs have traditionally been from a macro perspective, conducted by social psychologists, whereas SLA research focuses on analysing the development of an L2 from a micro perspective, and is most often conducted by linguists. Therefore, whilst various theories or models regarding different orientations, individual differences, and possible selves provoke thoughtful contemplation, the traditional research designs which often accompanied such paradigms were product-oriented (concerned with investigating the relationship between learner characteristics and language outcomes), whereas SLA research designs are most often process-oriented (Dörnyei, 2003).
Researchers interested in aligning the field of L2 motivation research to mainstream SLA research thus began, in the 1990s, to adopt a process-oriented approach to motivational research (Dörnyei, 2005). In order to do this, motivational research designs must begin to take into account the specific learning behaviours which must take place in order for language learning achievement to occur. In line with this, Skehan (1991) proposed that learner strategies and learner styles mediated the influence of affective variables (such as motivation) and cognitive variables (such as intelligence) in order to produce outcomes. Currently, it is more common to test variables relating to motivation or attitudes and then compare these to measures of achievement or proficiency, without acknowledging that there must be a process in between these two measures (e.g. Gardner, Day & MacIntyre, 1992).
This process-oriented approach has also aided in the operationalization of motivation as a situated construct, rather than a latent, cognitive system independent of agent or context. Dörnyei (2009) argues that individual differences (such as motivation) can never be measured accurately unless the characteristics of a particular environment are also taken into account, as they are inseparable.
Statement of purpose
Iranian Journal of Language Teaching Research 1(2), (July, 2013) 37-64 41
personality that decides which behaviours will occur. Skehan (1991) hypothesized that researchers are likely to find differing types of L2 learners amongst student populations- a hypothesis which has found support in other studies (e.g. Moody, 1988).
The current study aimed, therefore, to create motivational profiles of students as an initial stage in a process-oriented approach to motivational research. In a process-oriented approach, the ultimate goal would be to create motivational profiles and then examine which specific learning behavior students within those profiles exhibit. Examining these behaviours in light of language learning outcomes would provide valuable insight into the causal effect motivation has on behaviour and behaviour has on learning outcomes. Taking inspiration from a study conducted by Csizér and Dörnyei (2005), the current study used cluster analysis as a means of investigating intra-individual differences across a variety of measures. Cluster analysis is a relatively uncommon procedure used in SLA research, although many studies which have implemented the procedure have been able to successfully apply a pre-nominated theoretical framework (e.g. the L2 Motivational Self-System) to the resultant clusters (e.g. Csizér & Dörnyei, 2002; Csizér & Dörnyei, 2005; Hiromori, 2009; Kojic-Sabo &Lightbown, 1999; Koul, Roy, Kaewkuekool & Ploisawaschai, 2009; Skehan, 1986; Yamamori, Isoda, Hiromori& Oxford, 2003; Yashima & Zenuk-Nishide, 2008). One of the benefits of cluster analysis is that it allows researchers to investigate the ways in which different manifestations of motivation affect a student‟s subsequent behaviour in the language learning context. An example of the use of motivational profiles formed through cluster analysis can be seen in a study by Tagashira, Yamato and Isoda (2011) who used these profiles to investigate the effect they had on the pragmatic awareness of students in the classroom.
The current study defined and described distinct motivational profiles amongst two disparate groups of language learners using cluster analysis and other exploratory statistical procedures. The purpose of creating these motivational profiles was to investigate the way in which different variables commonly explored in L2 motivation research combine to form clusters and the way in which the L2 learning environment (or context) affects the strength of these variables. The results of these findings are then explored in light of Dörnyei‟s model of the L2 Motivational Self-System (2005).
Study one: Method
Participants
The sample was comprised of 42 Dutch university students who were all enrolled in the Bachelor of English Studies at the Rijksuniversiteit Groningen in the Netherlands. There were 17 first year, 15 second year and 10 third year students, including 11 males and 31 females.
Materials
42 Vahtrick & de Bot/L2 motivation profiling ….
Self-perceivedproficiency. (SPP; α = .89).
This measure consisted of two items, with a high score indicating a very high self-perceived proficiency.
The other 10 variables were assessed using a 4-point Likert scale ranging from “Strong Disagreement” to “Strong Agreement” and were adapted from the AMTB (Gardner &Smythe, 1981). The full set of questions can be found in the appendix. The reliability (Cronbach‟s alpha) of each variable is listed in brackets.
Integrativeness was defined as the willingness and aspiration of the student to adopt characteristics of the target language‟s culture and was measured using three different variables.
Attitudes towards native English speakers. (ANE; α = .548).
This measure consisted of two positively worded items and two negatively worded items. A high score indicates a highly favourable attitude towards native English speakers.
Interest in foreign languages. (IFL; α = .718).
This measure consisted of two positively worded items and two negatively worded items. A high score indicates a high level of interest in any L2.
Integrative orientation. (ITO; α = .755).
This measure consisted of four positively worded items. A high score indicates a strong desire to learn English for integrative reasons.
Motivation is a grouping of variables concerned with the students‟ motivational intensity to learn the language and was measured using three different variables.
Attitudes towards learning English. (ALE; α = .360).
This measure consisted of two positively worded items and two negatively worded items. A high score indicates a positive attitude towards learning English.
Desire to learn English. (DLE; α = .397).
This measure consisted of two positively worded items and two negatively worded items. A high score indicates a strong desire to learn English.
Motivational intensity. (MOI; α = .449).
This measure consisted of two positively worded items and two negatively worded items. A high score indicates a significant amount of applied effort from the student.
Iranian Journal of Language Teaching Research 1(2), (July, 2013) 37-64 43
Instrumental orientation. (ISO; α = .726).
This measure consisted of four positively worded items. A high score indicates a strong desire to learn English for pragmatic/instrumental reasons.
Anxiety was measured using two variables.
English class anxiety. (ECA; α = .711).
This measure consisted of one positively worded item and two negatively worded items. A high score indicates a low level of anxiety experienced in class.
English use anxiety. (EUA; α = .791).
This measure consisted of two positively worded items and two negatively worded items. A high score indicates a low level of anxiety experienced when using English.
In addition, measures of self-confidence were adapted from Clément &Kruidenier (1985).
Self-confidence (SCO; α = .809) was measured using five positively worded items. A high score indicates a high level of self-confidence.
Design and analyses
In this study, we were not specifically concerned with developing and testing hypotheses. Instead, we approached the four research questions outlined in the introduction in an explorative manner. We were particularly interested in exploring whether or not there was evidence of ideal or ought-to selves within the clusters which emerged, as a follow-on from Csizér and Dörnyei‟s (2005) study where evidence of this model was found in the clusters they formed. In addition, due to the work of past researchers who have found a significant effect of context on the ways in which various cognitive or affective variables influence learners (Kojic-Sabo &Lightbown, 1999; Oxford & Shearin, 1994), we explored the effect that the language learning environment (the context in which the language is learned) had on the structure of motivational profiles amongst language learners.
This study was primarily concerned with motivation and therefore measures of specific learner strategies or behaviours were not taken in this study. However, in light of previous studies (e.g. Tagashira, Yamato & Isoda, 2011), we suggest that the construction of motivational profiles may act as an initial step in a process-oriented approach which aims to investigate not only the motivation of language learners, but the subsequent language learning behaviours and language skills which develop in these learners.
Principal components analysis
44 Vahtrick & de Bot/L2 motivation profiling ….
After the data was collected from the participants, it was entered into the SPSS 20 programme. A principal component analysis (PCA) was conducted to identify latent, essentially uncorrelated variables within the data. This form of analysis has been widely implemented in linguistic research (e.g. Belmechri& Hummel, 1998; Clément, Dörnyei & Noels, 1994; Warden & Lin, 2000). PCA is primarily used for very large-scale designs (e.g. Inbar, Donitsa-Schmidt &Shohamy, 2000; Schmidt & Watanabe, 2001) although it is possible to use it for smaller data sets providing these meet certain requirements (i.e. the Kaiser-Meyer-Olkin measure and Bartlett‟s test of sphericity). As it does not require longitudinal data, PCA was chosen as the most applicable tool for this particular study. Other studies which have used cluster analysis to define different learner profiles have also made use of PCA as an initial procedure (e.g. Csizér & Dörnyei, 2005; Morris, 2001).
Cluster analysis
Cluster analysis identifies participants who have similar characteristics and then creates homogeneous subgroups amongst the large population. If all participants behaved in completely unique manners, there would be an equal number of clusters to participants. Conversely, if participants acted in exactly the same way, there would only be one cluster. Using cluster analysis allows researchers to cluster participants meaningfully, whilst still recognising that each subject will, at some level of the clustering process, behave in a way that is completely unique. Traditionally, cluster analysis is performed as a two-step procedure, first with a hierarchical analysis and then a K-means analysis. The hierarchical analysis produces dendrograms which help the researcher determine the optimum number of clusters. Once the optimum number of clusters has been decided, a K-means analysis is run which allocates participants to the predefined number of clusters. As cluster analysis is an exploratory statistical procedure, it is important to validate it in terms of a sound theoretical construct and use subsequent procedures to substantiate the results (Csizér & Dörnyei, 2005). Throughout this study, the resulting clusters were analysed in an attempt to apply them to Dörnyei‟s L2 Motivational Self-System. One method of substantiating the results from cluster analysis is to compare the results with an external criterion measure (Alexander & Murphy, 1999). However, with the absence of such a measure in this study, an alternative approach was sought. Kojic-Sabo andLightbown (1999) argue that there is no way to determine what the optimal number of clusters is, and in fact, whether or not subjects have been organized into the cluster that best fits their individual profile. However, in this paper it is argued that using a MANOVA and subsequent discriminant function analysis (DFA) enables a researcher to ascertain (to a high degree of accuracy) whether or not the original clustering process has been effective, as the nominal independent variable cluster membership is calculated from the 11 variables originally used in the cluster analysis- thus substantiating any results found in the latter.
MANOVA and Discriminant Function Analysis
Iranian Journal of Language Teaching Research 1(2), (July, 2013) 37-64 45
The loadings that appear in discriminant function analysis are comparative to factor loadings in a principal components analysis, in that they specify the strength of each of the functions. However, it must be stressed that a discriminatory function analysis does not produce the same factors that a principal component analysis does. Instead, it serves as a predictor of subject membership to clusters that already exist by identifying underlying functions that serve to discriminate the clusters from each other (Field, 2009).
Once the clusters had been classified correctly they were subjected to one-way ANOVAs to ascertain the effect of cluster membership on the 11 individual variables. The clusters were thendescribed in terms of their most dominant characteristics. The decision level for all analyses conducted in this study was set at < .05, which is the industry norm.
Study one: Results
Principal components analysis
A principal component analysis was run on the 11 variables with orthogonal rotation (varimax). However, upon first running the analysis it became apparent that three of the variables did not correlate highly enough with any of the other factors (IFL, ANE and ISO) and were thus excluded from the analysis (the correlation coefficient tables can be found in Appendix C). The analysis was run again. The Kaiser-Meyer-Olkin (KMO) measure confirmed that the sample size was adequate for the analysis (KMO = .75). According to Field (2009), the KMO measure should be higher than .5 in order for PCA to be appropriate. Bartlett‟s test of sphericity (χ² (28) = 127.95, p < .001) signifies that the correlations between the variables are sufficiently strong enough to conduct principal component analysis. Eigen values were obtained for all factors and only those with a value higher than 1 were retained (as specified by Kaiser, 1974). Two components were found to have Eigen values over 1 and these collectively described 65.55% of the variance found in the data, which is substantial. Examination of the scree plot (Cattell, 1966) confirmed that a two factor solution was appropriate. After the varimax rotation the manner in which the variables are loaded suggests that the factors represent two distinct subscales: Factor I contains all variables relating to self-confidence; and Factor II represents the overall language learning motivation of the student. The loadings in Table 1 are only present above the value of .4, as this is the cut-off point that Stevens (2002) suggests.
46 Vahtrick & de Bot/L2 motivation profiling ….
Table 1
Summary of Principal Component Analysis Results for Dutch Data (N=42)
Note. The rotation method was varimax with Kaiser normalisation. The Eigen values and % of variance are taken from after the varimax rotation.
Cluster analysis
The cluster analysis was conducted in two stages, using all 11 variables as grouping variables. Firstly, a hierarchical cluster analysis using Ward‟s method and the squared Euclidean distance as the interval measure was run. Upon analysis of the dendrograms (found in Appendix B), the decision was made to continue with the assumption that the data could be separated into three clusters. A subsequent K-means analysis was run to ensure the between-cluster distance was as distinct as possible and the within-cluster distance was as homogeneous as possible.
MANOVA
Using Pillai‟s trace there was a significant effect of cluster membership on the11 variables, V = 1.3, F(22,60) = 5.152, p < .01. In addition, separate univariate ANOVAs revealed significant cluster effects on all variables except IFL and ANE.
Discriminant function analysis
This analysis revealed two discriminant functions. The first explained 69.7% of the variance; and the second explained 30.3%. Both discriminant functions found in the analysis significantly differentiated the three cluster groups, together (ʌ = .11, χ²(22) = 74.67, p < .01) as well as individually (ʌ = .44, χ²(10) = 28.01, p < .01). The classification results from the discriminant function analysis revealed that 97.6% of the subjects from the original cluster analysis had been clustered effectively. Only one subject was labelled as being clustered incorrectly. This subject was moved from cluster 2 to cluster 1 for the subsequent analyses.
Within cluster analyses
One-way ANOVAs were then conducted in order to ascertain what effect cluster membership had on the individual variables. There were significant effects of cluster membership on the
Variables Factors
Factor 1 Factor 2 SCO .932
ECA .860 EUA .828 SPP .814
MOI .772
ITO .749
DLE .732
ALE .731
Iranian Journal of Language Teaching Research 1(2), (July, 2013) 37-64 47
variables SPP, ALE, DLE, ECA, EUA, ITO, MOI, and SCO. Subsequent Post-Hoc analyses revealed that there was most often a significant difference between the lowest scoring group and the higher groups, but no significant differences were found between the two highest groups. Details of all one-way ANOVAs and Post-hoc analyses can be found in Appendix E.
Study one: Discussion
Principal components analysis
When looking at the factors which were uncovered in the PCA, it becomes apparent that the results are comparable to those from previous studies. Factor I has high loadings from the self-confidence, English use anxiety, English class anxiety, and self-perceived proficiency variables. Whilst this is contrary to Gardner‟s (1985) socio-educational model, which relates English class anxiety to the learning environment rather than to self-confidence; more recent studies would argue differently (e.g. Clément, 1986; Clément, Dörnyei & Noels, 1994; Clément, Gardner & Smythe, 1980; Gardner & MacIntyre, 1993a; Gardner, Tremblay & Masgoret, 1997).
The second factor revealed by the principal components analysis (the „motivation‟ factor) contained the variables ALE, DLE, MOI, and ITO. The AMTB (Gardner, 1985) groups the first three of these variables together into one category termed „motivation‟, which would validate the strong correlations between these variables. It is also understandable that ITO loads strongly onto this factor, given that those participants who have strong, positive feelings for a language community are more likely to demonstrate higher motivation to learn that language. This does not mean that one directly influences the other, but that interaction over time between two variables such as these is likely to result in positive correlations.
Cluster analysis
Cluster 1 scored lowest on SPP, EUA, ECA, and SCO. It scored significantly higher than the lowest (but with no significant differences to the other cluster) on ALE, DLE, and MOI. Therefore, it is possible to describe Cluster 1 as having low levels of self-confidence and the highest levels of anxiety in English class (thereby scoring poorly on all variables that loaded onto Factor I). However, they scored significantly better than the lowest scoring group on three of the factors that load onto Factor II- the motivation factor. This would indicate that even though the subjects experience anxiety and have a low perception of their own proficiency, their attitude and desire towards learning English is strong enough to provide the impetus for the students to continue with their motivated efforts to learn the language. This links back to the idea that anxiety need not be debilitating or counter-productive to motivation as long as bridging the gap between the students‟ perceived current proficiency and their ideal proficiency is seen as attainable (Crookes & Schmidt, 1991; Shaaban & Ghaith, 2000).
48 Vahtrick & de Bot/L2 motivation profiling ….
Cluster 3 had the lowest scores for ITO, MOI, DLE, and ALE. However, this cluster did not score significantly better than the lowest scoring cluster on SPP, ECA, EUA, and SCO. This cluster can therefore be categorised as scoring highly on all variables from the factor „self-confidence‟, but very poorly on the variables from Factor II, indicating a low level of esteem held for the target language. This cluster may therefore have separated their confidence in the English language from the language itself; and so what we see exhibited is that an integrative orientation or desire to learn the language has no bearing on the performance of the student. A similar finding was made by Csizér and Dörnyei (2005), in that one of their clusters exhibited a strong sense of the relevancy of learning an L2 but did not have positive feelings towards the L2 community. Csizér & Dörnyei suggest that this is because this particular cluster of subjects had not “… internalised their professional interest to the extent that it has developed into an ideal language self.” (2005, p. 638). Instead, this group appear to embody Dörnyei‟s (2005) description of the „ought-to‟ language self.
Study two: Method
Participants
The second study examined students from an English language school in Sydney, Australia. All students who participated in the study were in Australia on a student visa to learn English and all attended the morning classes offered by the school. It was important that the students examined did not attend the night classes offered by the school, as the majority of these students work during the day and attend classes at night to satisfy the conditions of their visa. As a result of this, their motivational levels tend to be much lower than those of the students in the morning classes. There were 26 students who filled in the research questionnaire. Of these 26, 8 were from the intermediate level, 13 were from the upper-intermediate level and 5 students were in the advanced level at the school. At this particular school, students are expected to complete each course level in approximately 12 weeks. There were 10 male and 16 female students. The ages of the students ranged from 17 to 45 years with an average age of 24.19 (SD = 6.3).
Materials
The students were given the same questionnaire as the Dutch students in the first study, with minor changes made to suit an international group of participants. The Cronbach‟s alpha values for the 11 variables can be found in Appendix A.
Study two: Results
Principal components analysis
Iranian Journal of Language Teaching Research 1(2), (July, 2013) 37-64 49
Table 2
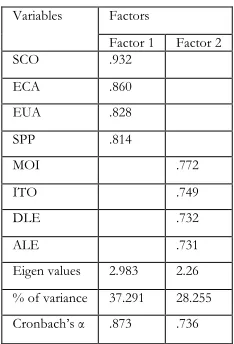
Summary of Principal Component Analysis Results (N=26)
Note. As there was only one factor extracted no rotation method was used.
Cluster analysis, MANOVA and discriminant function analysis
The cluster analysis was conducted in the same way as the first study and it revealed two clusters within the group.
A MANOVA was run to test the validity of the two clusters when measured against the variables. Using Pillai‟s trace there was a significant effect of cluster membership on the variables, V = .85, F(11,14) = 7.202, p < .01. In addition, separate univariate ANOVAs revealed significant cluster effects on all variables except SPP, ECA, and EUA.
The discriminant function analysis revealed one discriminant function which explained 100% of the variance; and also helped to validate the original PCA which suggested a single factor solution. It significantly differentiated the clustered groups, ʌ= .15, χ²(11) = 35.075, p < .01. The classification results from the discriminant function analysis revealed that 100% of the subjects from the original cluster analysis had been clustered effectively.
Independent samples t-tests were then conducted in order to examine the variables within each cluster. For those variables where there was a significant effect of cluster membership (all but SPP, ECA, and EUA), Cluster 1 significantly outperformed Cluster 2 (p < .05). Details of all independent samples t-tests can be found in Appendix E.
Study two: Discussion
Principal components analysis
When looking at the factors that were extracted in the principal components analysis, immediate differences can be noted between the Australian and Dutch data. Whilst the Dutch PCA revealed two factors (a self-confidence factor and a motivation factor) the Australian data only revealed one factor which seemed to encompass most of the variables to differing degrees. The loadings of ITO and ISO in combination with MOI are noteworthy, as Masgoret and Gardner (2003) argue, a strong integrative or instrumental orientation does not necessarily equate with high levels of motivation. Further analysis of the correlation matrix (Appendix B) reveals that all variables demonstrated high correlations with most other variables within the factor, indicating that, for
50 Vahtrick & de Bot/L2 motivation profiling ….
this set of data, the factor exhibits a lack of differentiation amongst the participants in terms of how they view the language learning process.
Cluster analysis
Cluster 1 scores significantly higher than cluster 2 on all variables where a significant effect of cluster membership was found (p < .05). Cluster 1, therefore, can be seen as demonstrative of the fact that motivation and a positive attitude towards a language increase when the gap between the current state and the desired state (the ideal or ought-to self) is seen as bridgeable- regardless of current ability. It is hypothesized therefore that Cluster 2 is made up of participants whose motivation is affected by the fact that their self-confidence is too low and anxiety levels too high to have a positive attitude regarding this gap. This would indicate that this cluster has no developed concept of the ideal L2 self (Dörnyei, 2005). It is notable that the three variables where no significant effect was found (SPP, ECA, and EUA) all relate to „performance‟ of the language. This can be related back to the idea that anxiety does not necessarily have to have a debilitating effect on language learning and performance (Tremblay& Gardner, 1995).
Discussion
Test-Score Validity
All of the test items for this study were taken from the AMTB and all had sufficiently high Cronbach‟s alpha values (> .07). However, upon testing the reliability of the test items on the particular data used in this study (for both the Dutch and Australian data) what emerges is that, for many of the items, particularly in the Australian data, the Cronbach‟s alpha values are low. This was not a huge cause for concern, as the alpha values for thesevariables in the AMTB are high and justified their usage in the study. However, there should be an explanation for why the alpha values for the individual variables are so low. Bernardi (1994) states that a sample which contains subjects from similar backgrounds will result in an increased similarity in the responses to test questions; therefore, particularly when looking at the Australian data where subjects came from numerous different countries and cultures, the reason for the low Cronbach‟s alpha values could be context. In addition, Bernardi argues that Cronbach‟s alpha should actually be interpreted as a very conservative test of reliability, considering that most of the time it measures the internal consistency of factorially complex variables.
Comparison of factors extracted in principal components analysis
Iranian Journal of Language Teaching Research 1(2), (July, 2013) 37-64 51
the Dutch students‟ did, possibly because they have a very great need to learn English which influenced all other factors.
In addition, distinct from the personal context of the students is the context of the learning environment or culture. Several studies have found that whether the L2 is being learnt in a second or foreign context can determine the influence of both cognitive and affective variables in individual learners (e.g. Oxford &Shearin, 1994; Kojic-Sabo &Lightbown, 1999). However, a mere distinction between a second and foreign language culture is most probably insufficient to determine the influence of context on the manifestation of different motivational profiles. For example, Warden and Lin (2000) found that one of the most influential factors affecting the level of motivation in a group of 442 non-English major students at Chaoyang University of Technology in Taiwan was requirement. That is, if a subject was a requirement of the students, then their motivation was found to increase. This is obviously neither an integrative nor instrumental orientation, but an orientation not fully explored in the West.
Clusters and the L2 motivational self-system
Context also had an effect on the way in which Dörnyei‟s (2005) proposal of the L2 Motivational Self-System manifested itself. In the Dutch data what appeared were three relatively distinct groups who exhibited different possible selves, ranging from a group that had not begun to develop an ideal self at all to students with fully-fledged ideal selves. However, in the Australian data there was one cluster which had a more developed sense of the ideal self and one that showed virtually no sign of such a concept.
What emerges from both sets of clusters is that whilst signs of both the ought-to and ideal-selves can be seen in the Dutch data, no such distinction is discernible in the Australian data. This again ties in with the discussion of the differences in the factors which were found- the Australian students may have a driving need to learn English which has already internalised all aspects of Dörnyei‟s (2005) model of the L2 Motivational Self-System, thereby making it less clear which types of possible selves they have begun to identify.
Conclusion
Yamamori et al (2003) argue that teachers will become more efficacious educators, the better they understand their students, yet investigating the individual cognitive and affective variables of every student and their subsequent learning behaviours would be an extremely time consuming process. In addition, even if such investigations were to be carried out, teaching each student individually in a manner suited to their motivational or learning style profile would be logistically impossible. When also taking into account the dynamic nature of one‟s motivation, it could also be argued that such analyses would be useless longitudinally, as each student‟s motivation will change over time. Therefore, cluster analysis is perhaps best utilized as a procedure in research designs which precedes investigation of language learning behaviours and subsequent language learning outcomes. Information on which learning behaviours are utilized by successful language learners will enable teachers to effectively coach less motivated students and create a pedagogical environment that is conducive to inspiring rather than dampening motivation.
52 Vahtrick & de Bot/L2 motivation profiling ….
learning behaviours. Future research concerning the field of motivation should focus on exploring a three-step link between motivation, language learning behaviour and subsequent language learning outcomes or proficiency. In this paper, we have argued that cluster analysis is a valid means of performing this first step- identifying differing levels of motivation amongst students and attempting to note similar characteristics which may then go on to influence the language learning behaviours students are likely to exhibit.
In identifying differing levels of motivation amongst students, researchers may then begin to examine the ways in which teaching strategies and the classroom context have an effect on the different aspects of motivation and therefore on the subsequent learning behaviours students exhibit as a result of their motivational profile.
References
Alexander, P.A. & Murphy, P.K. (1999). Learner profiles: Valuing individual differences within classroom communities. In P.L. Ackerman, P.C. Kyllonen& R.D. Roberts (Eds.), Learning and individual differences: Process, trait, and content determinants (pp. 412-431). Washington, DC: American Psychological Association.
Belmechri, F. & Hummel, K. (1998). Orientations and motivation in the acquisition of English as a second language among high school students in Quebec City.Language Learning, 48(2), 219-244.
Bernardi, R.A. (1994). Validating research results when Cronbach‟s Alpha is below .70: A methodological procedure. Educational and Psychological Measurement 54, 766-775.
Bernaus, M. & Gardner, R.C. (2008). Teacher motivation strategies, student perceptions, student motivation, and English achievement.The Modern Language Journal 92(3), 387-401.
Cattell, R.B. (1966). Scree test for number of factors. Multivariate Behavioural Research 1(2), 245-276.
Clément, R. (1986). Second language proficiency and acculturation: An investigation of the effects of language status and individual characteristics. Journal of Language and Social Psychology 5, 271-290.
Clément, R., Dörnyei, Z. & Noels, K.A. (1994). Motivation, self-confidence, and group cohesion in the foreign language classroom.Language Learning 44(3), 417-448.
Clément, R., Gardner, R.C. &Smythe, P.C. (1980).Social and individual factors in second language acquisition.Canadian Journal of Behavioural Science 12, 293-302.
Clément, R. &Kruidenier, B. (1985). Aptitude, attitude, and motivation in second language proficiency: A test of Clément‟s model. Journal of Language and Social Psychology 4, 21-37.
Crookes, G. & Schmidt, R.W. (1991). Motivation: Reopening the research agenda. Language Learning 41(4), 469-512.
Iranian Journal of Language Teaching Research 1(2), (July, 2013) 37-64 53
Csizér, K. & Dörnyei, Z. (2005). Language learner‟s motivational profiles and their motivated learning behaviour.Language Learning 55(4), 613-659.Deci, E.L. & Ryan, R.M. (1985). The general causality orientations scale: Self-determination in personality. Journal of Research in Personality 19(2), 109-134.
Dörnyei, Z. (2003). Attitudes, orientation, and motivations in language learning: Advances in theory, research and applications. Language Learning 53 (sup.), 3-32.
Dörnyei, Z. (2005). The psychology of the language learner: Individual differences in second language acquisition. Mahwah, NJ: Erlbaum.
Dörnyei, Z. (2009). Individual differences: Interplay of learner characteristics and learning environment. Language Learning 59(1), 230-248.
Field, A. (2009). Discovering statistics using SPSS. London: Sage Publications Ltd.
Gardner, R.C. (1985). Social psychology and second language learning: The role of attitudes and motivation. London: Arnold.
Gardner, R.C., Day, J.B. & MacIntyre, P.D. (1992).Integrative motivation, induced anxiety, and language learning in a controlled environment.Studies in Second Language Acquisition 14, 197-214.
Gardner, R.C. & Lambert, W.E. (1972). Attitudes and motivation in second-language learning.Massachusetts: Newbury House.
Gardner, R.C. & MacIntyre, P.D. (1993a). On the measurement of affective variables in second language learning.Language Learning 43(2), 157-194.
Gardner, R.C. &Smythe, P.C. (1981). On the development of the Attitude/Motivation Test Battery.The Canadian Modern Language Review 37, 510-525.
Gardner, R.C., Tremblay, P.F. & Masgoret, A-M. (1997). Towards a full model of second language learning: An empirical investigation. The Modern Language Journal 81(3), 344-362.
Higgins, E.T. (1987). Self-discrepancy: A theory relating to self and affect. Psychological Review 94, 319-340.
Hiromori, T. (2009). A process model of L2 learners‟ motivation: From the perspectives of general tendency and individual differences. System 37(2), 313-321.
Inbar,O., Donitsa-Schmidt, S. &Shohamy, E. (2000). Students‟ motivation as a function of language learning: The teaching of Arabic in Israel. In Z. Dörnyei & R. Schmidt (Eds.), Motivation and second language acquisition.Honolulu, HI: University of Hawaii Press.
Jacques, S.R. (2001). Preferences for instructional activities and motivation: A comparison of student and teacher perspectives. In Z. Dörnyei & R. Schmidt (Eds.), Motivation and second language acquisition (pp. 187-214). Honolulu, HI: University of Hawaii Press.
54 Vahtrick & de Bot/L2 motivation profiling ….
Kleinmann, H.H. (1977). Avoidance behaviour in adult second language acquisition.Language Learning 27, 93-107.
Kojic-Sabo, I. &Lightbown, P.M. (1999).Students‟ approaches to vocabulary learning and their relationship to success.The Modern Language Journal 83(2), 176-192.
Koul, R., Roy, L., Kaewkuekool, S. &Ploisawaschai, S. (2009). Multiple goal orientations and foreign language anxiety.System 37(4), 676-688.
Markus, H &Nurius, P. (1986). Possible selves. American Psychologist 41, 954-969.
Masgoret, A.-M. & Gardner, R.C. (2003). Attitudes, motivation and second language learning: A Meta-analysis of studies conducted by Gardner and associates. Language Learning 53(1), 123-163.
Moody, R. (1988). Personality preferences and foreign language learning.The Modern Language Journal 72(4), 389-401.
Morris, F.A. (2001). Language learning motivation for the class of 2002: Why first-year Puerto Rican high school students learn English. Language and Education 15(4), 269-278.
Myers, I.B. (1962). Inferences as to the dichotomous nature of Jungs types, from the shape of regressions of dependent-variables upon Myers-Briggs Type Indicator Scores. American Psychologist 17(6), 364.
Oxford, R. &Shearin, J. (1994). Language learning motivation: Expanding the theoretical framework. The Modern Language Journal 78, 12-28.
Schmidt, R. & Watanabe, Y. (2001). Motivation, strategy use, and pedagogical references in foreign language learning.In Z. Dörnyei & R. Schmidt (Eds.), Motivation and second language acquisition (pp. 313-359). Honolulu, HI: University of Hawaii Press.
Shaaban, K.A. &Ghaith, G. (2000). Student motivation to learn English as a foreign language.Foreign Language Annals 33(6), 632-644.
Skehan, P. (1986). Cluster analysis and the identification of learner types. In V. Cook (Ed.), Experimental approaches to second language acquisition (pp. 81-94). Oxford: Pergamon.
Skehan, P. (1991). Individual differences in second language learning.Studies in Second Language Acquisition 13, 275-298.
Stevens, J.P. (2002). Applied multivariate statistics for the social sciences (4th Ed.). Hillsdale, NJ: Erlbaum.
Tagashira, K., Yamato, K. &Isoda, T. (2011). Japanese EFL learners‟ pragmatic awareness through the looking glass of motivational profiles.JALT Journal 33(1), 5-26.
Iranian Journal of Language Teaching Research 1(2), (July, 2013) 37-64 55
Warden, C.A. & Lin, H.J. (2000).Existence of integrative motivation in an Asian EFL setting.Foreign Language Annals 33(5), 535-545.
Weiner, B. (1972). Attribution theory, achievement motivation, and the educational process.Review of Educational Research 42(2), 203-215.
Yamamori, K., Isoda, T. Hiromori, T. & Oxford, R. (2003). Using cluster analysis to uncover L2 learner differences in strategy use, will to learn and achievement over time. IRAL 41(4), 381-409.
Yashima, T. &Zenuk-Nishide. (2008). The impact of learning contexts on proficiency, attitudes, and L2 communication: Creating an imagine international community. System 36, 566-585.
Louisa Vahtrick graduated from the University of Groningen in the Netherlands with an M.A.
in Applied Linguistics. Prior to this she completed her B.A. at the University of Sydney, Australia. Her areas of interest include psycholinguistics, language attrition, and bilingual mother-tongue acquisition. She is currently employed at the University of Groningen in the Applied Linguistics department.
Prof. Dr. Kees de Bot graduated from the University of Nijmegen in General Linguistics and
56 Vahtrick & de Bot/L2 motivation profiling ….
Appendix A: Attitude/Motivation Test Battery Items These items were adopted from the AMTB (Gardner, 1985).
Attitudes towards native English speakers (Study I α = .548; Study II α = .025)
Positively keyed
- Most native English speakers are so friendly and easy to get along with that the Netherlands is fortunate to have them.
- Native English speakers are very sociable, warm-hearted and creative people.
Negatively keyed
- The more I learn about native English speakers, the less I like them.
- The spread of English in the Netherlands is having a negative effect on the Dutch culture.
Attitudes towards learning English(Study I α = .360; Study II α = .606)
Positively keyed
- I plan to learn as much English as possible. - I really enjoy studying English literature. - I really enjoy learning the English language.
Negatively keyed
- Learning English is a waste of time.
Desire to learn English(Study I α = .397; Study II α = .531)
Positively keyed
- I wish I had begun studying English at an early age. - The English language is really great.
Negatively keyed
- I sometimes daydream about not studying English anymore. - I find I‟m losing any desire I ever had to learn English.
English class anxiety(Study I α = .711; Study II α = .237)
Positively keyed
- It worries me that other students in my class seem to speak English better than I do.
- I am sometimes afraid the other students in my English class will laugh at me when I speak English.
Negatively keyed
- I don‟t usually get anxious when I have to respond to a question in my English class.
English use anxiety(Study I α = .791; Study II α= .147)
Positively keyed
- I would feel comfortable speaking English in an informal gathering where both English and Dutch speaking persons are present.
- I would feel quite relaxed if I had to ask street directions in English. Negatively keyed
Iranian Journal of Language Teaching Research 1(2), (July, 2013) 37-64 57
Interest in foreign languages(Study I α = .718; Study II α= .764)
Positively keyed
- I would really like to learn many foreign languages.
- I enjoy meeting and listening to people who speak other languages.
Negatively keyed
- Most foreign languages sound crude and harsh.
- I really have no interest in foreign languages other than English.
Instrumental orientation (Study I α = .726; Study II α = .726)
- Studying English is important because it will increase my ability to influence others. - Studying English is important because it will make me appear more cultured.
- Studying English is important because it will give me an edge when competing with others. - Studying English can be important to me because I think it will someday be useful in getting a good job.
Integrative orientation(Study I α = .755; Study II α = .597)
- Studying English is important because it will allow me to participate more freely in the activities of native English speakers.
- Studying English is important because it will allow me to gain good friends more easily amongst native English speakers.
- Studying English is important because it will enable me to better understand native English speaking life and culture.
Motivational intensity(Study I α = .449; Study II α = .570)
Positively keyed
- I make a point of trying to understand all the English I see and hear. - I really work hard to learn English.
Negatively keyed
58 Vahtrick & de Bot/L2 motivation profiling ….
Appendix B: Dendrograms
Figure 1
Dendrogram of Dutch Data.
Figure 2
Iranian Journal of Language Teaching Research 1(2), (July, 2013) 37-64 59
Appendix C: Descriptive statistics tables
Table 3
Descriptive Statistics of the Variables from the Dutch Data.
N Range Mean Std Dev Skewness Kurtosis Statistic Statistic Statistic Statistic Statistic Std. Err Z-score Statistic St. Err Z-score SPP 42 6 5.50 1.469 -.412 .365 -1.13 -.435 .717 -.61 ANE 42 8 12.02 1.522 -.565 .365 -1.55 1.73 .717 2.41* ALE 42 4 14.14 1.317 -.074 .365 -0.34 -1.14 .717 -1.63 DLE 42 6 13.69 1.522 -.404 .365 -1.11 -.332 .717 -.46 ECA 42 8 10.90 2.314 .022 .365 .06 -.922 .717 -1.29 EUA 42 7 13.50 2.027 -.341 .365 -.93 -1.003 .717 -1.40 IFL 42 8 12.83 2.059 -.328 .365 -.98 -.595 .717 -.86 ISO 42 9 10.36 2.128 -.350 .365 -.96 -.279 .717 -.39 ITO 42 9 11.62 1.780 -.287 .365 -.79 .777 .717 1.08 MOI 42 6 13.14 1.539 -.125 .365 -.04 -.636 .717 -1.08 SCO 42 10 16.40 2.678 -.465 .365 -1.27 -.474 .717 -.66 Note. * Z-score of kurtosis is significant at p < .05.
Table 4
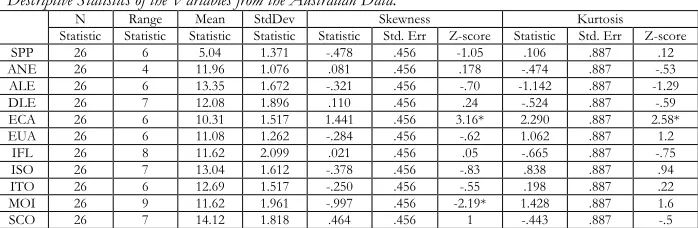
Descriptive Statistics of the Variables from the Australian Data.
N Range Mean StdDev Skewness Kurtosis Statistic Statistic Statistic Statistic Statistic Std. Err Z-score Statistic Std. Err Z-score SPP 26 6 5.04 1.371 -.478 .456 -1.05 .106 .887 .12 ANE 26 4 11.96 1.076 .081 .456 .178 -.474 .887 -.53 ALE 26 6 13.35 1.672 -.321 .456 -.70 -1.142 .887 -1.29 DLE 26 7 12.08 1.896 .110 .456 .24 -.524 .887 -.59 ECA 26 6 10.31 1.517 1.441 .456 3.16* 2.290 .887 2.58* EUA 26 6 11.08 1.262 -.284 .456 -.62 1.062 .887 1.2
60 Vahtrick & de Bot/L2 motivation profiling ….
Appendix D: Correlation coefficient tables
Table 5
Kendall’s Tau Correlation Coefficient of the Dutch Data.
SPP ANE ALE DLE ECA EUA IFL ISO ITO MOI SCO SPP
Sig. (2-tailed) 1.000 -.070 .576 -.021 .864 .027 .829 .502* .000 .466* .000 .133 .274 .138 .259 -.084 .498 .037 .768 .605* .000 ANE
Sig. (2-tailed) -.070 .576 1.000 .017 .891 .164 .187 -.050 .678 -.008 .946 .010 .937 .084 .492 .300* .016 .311* .012 -.101 .406 ALE
Sig. (2-tailed) -.021 .864 .017 .891 1.000 .327* .009 -.029 .814 .581 .068 .220 .072 .215 .079 .391* .002 .289* .020 .083 .493 DLE
Sig. (2-tailed) .027 .829 .164 .187 .327* .009 1.000 .059 .623 -.005 .964 .156 .197 .050 .678 .331* .007 .356* .004 .069 .568 ECA
Sig. (2-tailed) .502* .000 -.050 .678 -.029 .814 .059 .623 1.000 .487* .000 -.186 .114 .132 .263 -.073 .543 -.173 .147 .651* .000 EUA
Sig. (2-tailed) .466* .000 -.008 .946 .068 .581 -.005 .964 .487* .000 1.000 -.052 .664 .099 .410 -.006 .964 -.001 .991 .572* .000 IFL
Sig. (2-tailed) .133 .274 .010 .937 .220 .072 .156 .197 -.186 .114 -.052 .664 1.000 -.024 .842 .217 .072 .317* .009 -.064 .587 ISO
Sig. (2-tailed) .138 .259 .084 .492 .215 .079 .050 .678 .132 .263 .099 .410 -.024 .842 1.000 .353* .004 .049 .687 .135 .253 ITO
Sig. (2-tailed) -.084 .498 .300* .016 .391* .002 .331* .007 -.073 .543 -.006 .964 .217 .072 .353* .004 1.000 .406* .001 -.008 .946 MOI
Sig. (2-tailed) .037 .768 .311* .012 .289* .020 .356* .004 -.173 .147 -.001 .991 .317* .009 .049 .687 .406* .001 1.000 -.032 .789 SCO
Iranian Journal of Language Teaching Research 1(2), (July, 2013) 37-64 61
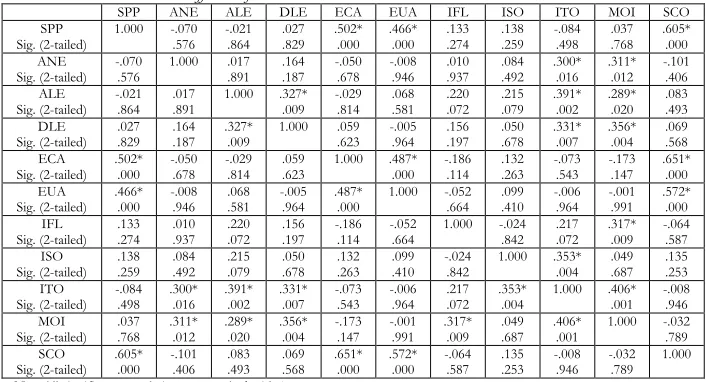
Table 6
Kendall's Tau Correlation Coefficient of the Australian Data.
SPP ANE ALE DLE ECA EUA IFL ISO ITO MOI SCO SPP
Sig. (2-tailed) 1.000 .304 .069 .298 .069 .250 .122 .073 .661 -.078 .641 .209 .198 .149 .361 -.028 .864 .111 .498 .334* .039 ANE
Sig. (2-tailed) .304 .069 1.000 .409* .012 .490* .002 .156 .349 .059 .315 .345* .033 .232 .155 .421* .011 .448* .006 .414* .010 ALE
Sig. (2-tailed) .298 .069 .409* .012 1.000 .562* .000 .263 .107 .120 .254 .540* .001 .456* .004 .350* .030 .525* .001 .525* .001 DLE
Sig. (2-tailed) .250 .122 .490* .002 .562* .000 1.000 .185 .249 .161 .225 .302 .053 .366* .020 .448* .005 .554* .000 .389* .013 ECA
Sig. (2-tailed) .073 .661 .156 .349 .263 .107 .185 .249 1.000 .138 .246 .319* .048 -.043 .794 -.072 .663 .145 .376 .249 .121 EUA
Sig. (2-tailed) -.078 .641 .315 .059 .254 .120 .225 .161 .246 .138 1.000 .188 .244 -.004 .981 .193 .242 .312 .056 .419* .009 IFL
Sig. (2-tailed) .209 .198 .345* .033 .540* .001 .302 .053 .319* .048 .188 .244 1.000 .272 .085 .197 .219 .334* .035 .333* .033 ISO
Sig. (2-tailed) .149 .361 .232 .155 .456* .004 .366* .020 -.043 .794 -.004 .981 .272 .085 1.000 .439* .007 .439* .006 .453* .004 ITO
Sig. (2-tailed) -.028 .864 .421* .011 .350* .030 .448* .005 -.072 .663 .193 .242 .197 .219 .439* .007 1.000 .584* .000 .380* .017 MOI
Sig. (2-tailed) .111 .498 .448* .006 .525* .001 .554* .000 .145 .376 .312 .056 .334* .035 .439* .006 .584* .000 1.000 .472* .003 SCO
62 Vahtrick & de Bot/L2 motivation profiling ….
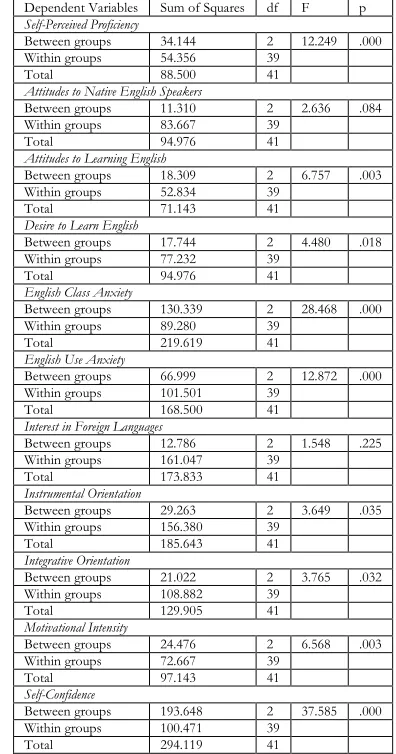
Appendix E: ANOVA, Post-Hoc and t-test tables Table 7
Summary of One-way ANOVAs of Dutch data (N=42).
Dependent Variables Sum of Squares df F p Self-Perceived Proficiency
Between groups 34.144 2 12.249 .000 Within groups 54.356 39
Total 88.500 41 Attitudes to Native English Speakers
Between groups 11.310 2 2.636 .084 Within groups 83.667 39
Total 94.976 41 Attitudes to Learning English
Between groups 18.309 2 6.757 .003 Within groups 52.834 39
Total 71.143 41 Desire to Learn English
Between groups 17.744 2 4.480 .018 Within groups 77.232 39
Total 94.976 41 English Class Anxiety
Between groups 130.339 2 28.468 .000 Within groups 89.280 39
Total 219.619 41 English Use Anxiety
Between groups 66.999 2 12.872 .000 Within groups 101.501 39
Total 168.500 41 Interest in Foreign Languages
Between groups 12.786 2 1.548 .225 Within groups 161.047 39
Total 173.833 41 Instrumental Orientation
Between groups 29.263 2 3.649 .035 Within groups 156.380 39
Total 185.643 41 Integrative Orientation
Between groups 21.022 2 3.765 .032 Within groups 108.882 39
Total 129.905 41 Motivational Intensity
Between groups 24.476 2 6.568 .003 Within groups 72.667 39
Total 97.143 41 Self-Confidence
Between groups 193.648 2 37.585 .000 Within groups 100.471 39
Total 294.119 41
Iranian Journal of Language Teaching Research 1(2), (July, 2013) 37-64 63
Table 8
Post-hoc Analyses of ANOVAs Calculated From Dutch Data (N=42).
Comparisons Mean Difference Std. Error p Hochberg’s Comparison for Self-Perceived Proficiency
Cluster 1 vs. Cluster 2 1.779* .385 .000 Cluster 1 vs. Cluster 3 2.088* .656 .009 Cluster 2 vs. Cluster 3 .310 .644 .949 Hochberg’s Comparison for Attitudes to Native Speakers
Cluster 1 vs. Cluster 2 .333 .478 .863 Cluster 1 vs. Cluster 3 1.500 .814 .200 Cluster 2 vs. Cluster 3 1.833 .799 .079 Hochberg’s Comparison for Attitudes to Learning English
Cluster 1 vs. Cluster 2 .513 .380 .452 Cluster 1 vs. Cluster 3 1.809* .647 .024 Cluster 2 vs. Cluster 3 2.321* .635 .002 Hochberg’s Comparison for Desire to Learn English
Cluster 1 vs. Cluster 2 .342 .459 .839 Cluster 1 vs. Cluster 3 1.956* .782 .049 Cluster 2 vs. Cluster 3 2.298* .768 .014 Hochberg’s Comparison for English Class Anxiety
Cluster 1 vs. Cluster 2 3.272* .494 .000 Cluster 1 vs. Cluster 3 4.676* .841 .000 Cluster 2 vs. Cluster 3 1.405 .825 .259 Hochberg’s Comparison for English Use Anxiety
Cluster 1 vs. Cluster 2 2.179* .526 .001 Cluster 1 vs. Cluster 3 3.691* .897 .001 Cluster 2 vs. Cluster 3 1.512 .880 .252 Hochberg’s Comparison for Interest in Foreign Languages
Cluster 1 vs. Cluster 2 .426 .663 .889 Cluster 1 vs. Cluster 3 1.515 1.129 .458 Cluster 2 vs. Cluster 3 1.940 1.109 .238 Hochberg’s Comparison for Instrumental Orientation
Cluster 1 vs. Cluster 2 1.378 .653 .117 Cluster 1 vs. Cluster 3 1.015 1.113 .741 Cluster 2 vs. Cluster 3 2.393 1.092 .099 Hochberg’s Comparison for Integrative Orientation
Cluster 1 vs. Cluster 2 .353 .545 .887 Cluster 1 vs. Cluster 3 2.147 .929 .075 Cluster 2 vs. Cluster 3 2.500* .912 .027 Hochberg’s Comparison for Motivational Intensity
Cluster 1 vs. Cluster 2 .667 .445 .364 Cluster 1 vs. Cluster 3 2.000* .759 .035 Cluster 2 vs. Cluster 3 2.667* .745 .003 Hochberg’s Comparison for Self-Confidence
64 Vahtrick & de Bot/L2 motivation profiling ….
Note. Significant differences between clusters are noted with *.
Table 9
Summary of Independent Samples T-tests of Australian data (N=26).
Dependent Variables t df Sig. (two-tailed) Mean Difference Std. Error Difference Self-Perceived Proficiency
Equal variances assumed 1.298 24 .207 .690 .532 Attitudes to Native English Speakers
Equal variances assumed 3.235* 24 .004 1.167 .361 Attitudes to Learning English
Equal variances assumed 8.052* 24 .000 2.810 .349 Desire to Learn English
Equal variances assumed 3.865* 24 .001 2.310 .598 English Class Anxiety
Equal variances assumed 1.514 24 .143 .881 .582 English Use Anxiety
Equal variances not assumed ^ 1.867 24 .079 .917 .491 Interest in Foreign Languages
Equal variances assumed 4.659* 24 .000 2.845 .611 Instrumental Orientation
Equal variances assumed 2.909* 24 .008 1.619 .556 Integrative Orientation
Equal variances assumed 3.099* 24 .005 1.595 .515 Motivational Intensity
Equal variances not assumed ^ 3.674* 24 .002 2.381 .648 Self-Confidence
Equal variances assumed 4.925* 24 .000 2.536 .515
Note. Levene‟s test for equality of variance was significant, thus equal variance is not assumed and marked with ^. Significant differences between clusters are marked with *.