155
Copyright © 2018. IJEMR. All Rights Reserved.
Volume-8, Issue-4, August 2018
International Journal of Engineering and Management Research
Page Number: 155-162
DOI:
doi.org/10.31033/ijemr.8.4.19
Performance and Emissions Analysis of N-Butanol Blended with
Gasoline in Spark Ignition Engine
Abdulrahman, A1, Adisa, A. B.2 and Dandakouta, H.3
1Research Fellow, Research, National Center for Petroleum Research & Development Bauchi, NIGERIA 2
Professor, Mechanical Engineering, Abubakar Tafawa Balewa University Bauchi, NIGERIA 3Professor, Automobile Engineering, Abubakar Tafawa Balewa University Bauchi, NIGERIA
1Corresponding Author: [email protected]
ABSTRACT
The power developed by an internal-combustion engine depends upon the fuel used for combustion. Fuels commonly used in internal combustion engines are derived from crude oil, which are depleting and are important sources of air pollution. In this study, n-butanol was used as an additive with gasoline as fuel in spark ignition engine. N-butanol exhibits good burning characteristics, contain oxygen, reduces some exhaust emissions and as well, has energy density and octane rating close to that of gasoline. The various blend rates (4, 8, 12, 16 and 20 percent by volume) were used in the engine performance analysis using a TD110-115 single cylinder, four-stroke air-cooled spark ignition engine test rig, under different loading conditions. An SV-5Q automobile exhausts gas analyzer was used to measure the concentration of gaseous emissions such as unburnt hydrocarbon (UHC), carbon monoxide (CO), and carbon dioxide (CO2) from the engine tail pipe.
The results of engine performance showed reduction in the exhaust temperature was observed for the blends than to that of gasoline. It was observed that all the blends improved the brake thermal efficiency and exhibited high fuel consumption, lower specific energy consumption and lower emissions than gasoline. All the blends performed satisfactorily on spark-ignition engine without engine modification.
Keywords— Brake thermal efficiency, Exhaust emission, Exhaust gas temperature, N-butanol, Performance
I.
INTRODUCTION
Energy requirement and environmental Energy requirement and environmental pollution are the two major challenges faced by the society today. Energy has been always in demand not only in the past, but also due to continuous in research to meet the needs for advance technologies and increase in population. As the population grows, the energy requirement also grows
and the economy tends to grow, as estimated that the world energy demand is to grow by 50% in 2030 [8]. Petroleum is non-environmentally friendly, non-renewable and expected to deplete within few decades. This is due to the problems resulting from prominent use of fossil fuels such as global warming, depletion of fossil fuel resources and environmental deterioration have become serious challenges threatening the continuous development and sustainable progress of human society. The transportation sector accounts for approximately 13% of global anthropogenic greenhouse gas (GHG) emissions [14]. Therefore, it is necessary to search for alternate energy sources, which are non-petroleum based and renewable such as solar, wind and biomass. One way of producing energy with net greenhouse gas emissions close to zero is using biomass [5].
Butanol is a saturated primary alcohol (C4H9OH) and also a promising biofuel. Compared to ethanol, butanol is a viable alternative to ethanol and offers several benefits over ethanol. Ethanol is fully miscible in water [3] and thus cannot be transported using existing fuel supply pipelines [25] whereas butanol is less corrosive than ethanol and is less prone to water contamination [21] allowing it to be transported using existing fuel supply pipelines [27]. The purpose of this work is to investigate the performance characteristics of n-butanol-gasoline blends as a fuel in a spark ignition engine.
156
Copyright © 2018. IJEMR. All Rights Reserved.
gasoline increased the engine torque, power fuel consumption and compression ratio while the reduction was found in the exhaust emission of CO, HC and NOx.
[6] Experimentally studied the behaviour of n-butanol-gasoline on a single cylinder spark ignition engine. The engine performance was reduced by using n-butanol blends compared to gasoline. The exhaust gas temperature found to be lower for the blends compared to gasoline. The emissions of CO, UHC and CO2 were found significantly lower than gasoline. At relatively low engine speed, the emissions of CO, UHC and CO2 was lowered compare to gasoline while at high speed, the emission reduction difference was lower than gasoline.
[2] Conducted the engine test on a single cylinder, 4-stroke gasoline engine by blending ethanol and iso-butanol with gasoline. Using ethanol and ethanol-iso-butanol as a fuel added substance to unleaded gasoline causes an improvement in engine performance and exhaust emissions. Both ethanol addition and ethanol- iso-butanol addition to gasoline results in an increase in brake power, volumetric efficiency, brake thermal efficiency, and fuel consumption respectively. But addition of 5 percent iso-butanol and 10 percent ethanol to gasoline increases about 6.2, 8.2, 7.8 and 6.7 percent mean average values respectively. In addition, the brake specific fuel consumption decreases by about 3.4 percent mean average value. The addition of 10 percent ethanol and 7.5 percent iso-butanol to the unleaded gasoline is achieved without any problems during engine operation.
[9] Experimentally studied the effect of addition of H2O in butanol gasoline blended fuel in a single cylinder, 2-valve, four-stroke, air cooling, spark ignition motorcycle engine. The result revealed that addition of H2O to butanol-gasoline blends increased brake specific energy consumption and engine torque. Exhaust emission of CO and HC decreased while emission of NOx and CO2 increased in comparison to gasoline.
[29] Reported the comparative study amongst ethanol-gasoline blends, butanol-gasoline blends and acetone-butanol-ethanol blends on V8 spark ignition engine. The result showed that E85 has the highest peak in-cylinder pressure and most advanced combustion phasing, while B85 has the lowest peak pressure and most retarded phasing. The longest ignition delay of B85 is mainly because butanol has the lowest vapour pressure leading to relatively poor evaporation while ABE 85 comes in between E85 and B85.All three fuels have lower brake thermal efficiency and higher brake thermal efficiency under stoichiometric conditions. B85 shows higher HC and CO emissions in comparison to E85, ABE85 and gasoline while E85, B85 and ABE85 have lower emissions than gasoline.
[7] investigated the performance and emission characteristics of single cylinder, 4-stroke spark-ignition engine in between the range (2600-3400 rpm with an increment of 100 rpm) of the engine speed. In this study, dual fuel n-butanol and methanol was blended with
gasoline (1.5, 3.5 and 5 percent by volume). The experiment results showed that at low rate of dual fuel blends, the engine volumetric efficiency, brake power, engine torque and exhaust gas temperature reduced. In-cylinder pressure and CO2 emission was also found to be reduced. Emission of unburnt hydrocarbon and CO was found to increase compared to n-butanol-gasoline blend and gasoline. At higher rate of dual fuel blends showed improved in engine performance and exhaust emission to n-butanol-gasoline blend and gasoline.
[16] investigated the butanol isomer combustion in multi cylinder, four stroke homogeneous charge compression ignition (HCCI) engines. In this study, two isomers of butanol viz. n-butanol and iso-butanol were used as tested fuel and then compared with ethanol and gasoline. Test results showed that both isomers show combustion stability during single stage ignition behaviour. Using n-butanol in engine having more stability under all conditions and also at the beginning of combustion n-butanol shows high heat release rate similar to gasoline. Knock resistance of n-butanol was found to be lower than iso-n-butanol and other tested fuels. Both butanol isomers showed similar exhaust emission range with other tested fuels.
II.
MATERIALS AND METHODS
Engine performance measurement was conducted on a single cylinder, four strokes, constant speed and air cooled spark ignition engine with the engine technical detail shown in Table I.
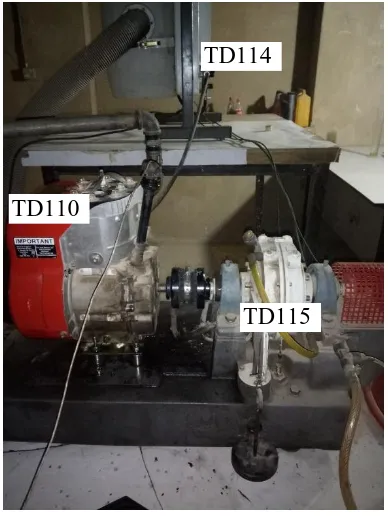
The basic test rig for consists of the engine (TD110), Hydraulic Dynamometer (TD115) and Instrumentation unit (TD114) as shown in plate I. A stop watch, thermometer and barometer were used to measure the time taken to consume 8 ml of fuel, ambient and water flowing out temperature, and barometric pressure respectively. The Instrumentation Unit is designed to stand beside the engine test bed. In addition to housing the instruments necessary for measuring the engine performance, it contains the fuel system and the air box/viscous flow meter used to measure the consumption of air.
157
Copyright © 2018. IJEMR. All Rights Reserved.
dynamometer bearing seals. This process was repeated for all fuel samples. All the data collected were inputted in an MS Excel spread sheet for calculating different parameters like specific fuel consumption, specific energy consumption and brake thermal efficiency.
TABLE I
TECHNICAL SPECIFICATIONS OF ENGINE TEST RIG [23]
Type Single cylinder, four stroke, air- cooled
Bore * Stroke 65 mm x 70 mm Brake power 2.43Kw
Rated speed 1500rpm Starting method Manual cranking Compression
ratio
20.5:1
Net weight 45kg
Manufacturer TQ Educational Training Ltd
Model TD110-115
An SV-5Q automobile exhaust gas analyzer was used to measure the concentration of tail pipe emissions of carbon dioxide (CO2), carbon monoxide (CO), and unburnt hydrocarbon (UHC), to evaluate the behavior of the gasoline engine. The results obtained from the performance analyses are plotted against incremental engine load.
Plate I: Engine Test Rig.
In this present work, engine performance and exhaust gas emissions were experimentally investigated with gasoline and n-butanol gasoline blends (G100, GB4, GB8, GB12, GB16 and GB20) at 500g, 1000g, 1500g, 2000g, 2500g and 3000g loading conditions.
Engine performance test on gasoline fuel was used as a basis for comparison. The measured values of relative densities and calorific values of the fuel samples are shown in the Table II.
TABLE II
SUMMARY OF THE PROPERTIES OF TESTED SAMPLES
Fuel type Relative density
Calorific value (MJ/kg) G100 0.748 45.4 GB4 0.7505 44.9 GB8 0.7529 44.4 GB12 0.7554 43.9 GB16 0.7579 43.4 GB20 0.7603 42.9
III.
RESULTS AND DISCUSSION
The addition of n-butanol to gasoline on spark ignition engine performance and exhaust emission at different engine loads were investigated experimentally.
3.1 Engine Performance Test
The results of experimental engine tests for variation of brake specific fuel consumption, exhaust gas temperature, brake thermal efficiency and brake specific energy consumption versus engine load are presented in the figures below.
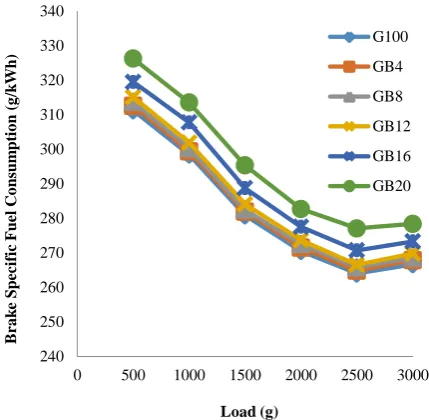
3.1.1 Brake Specific Fuel Consumption (BSFC) The variation of BSFC of the various for gasoline and the blends at different loads are shown in Fig. 1. It was observed that as the load increases, BSFC decreases to the minimum at the load of 2500 g, and turns to increases for both gasoline and the blends at load of 3000 g. This improvement in BSFC could be credited to proper burning of the fuel because of presence of oxygen in the blends [10].
The BSFC was found to be higher in all the blends than gasoline. The higher BSFC of the blends could be attributed to the combined effects of lower calorific values and high density of the blends result in high fuel flow rate. Since BSFC was calculated on weight basis, obviously higher densities result in higher values for BSFC [10].
[24] Reported that the BSFC of the blends were found to be higher when compared to that of gasoline due to higher calorific value of gasoline than that of the blends. When n-butanol gasoline blends are used, the fuel injection quantity required has to be increased to maintain the torque output. Likewise, [22] reported that for obtaining same amount of engine power, the fuel with lower calorific value is required more. This results to BSFC increase with the blends as compared to that of gasoline.
TD110
TD114
158
Copyright © 2018. IJEMR. All Rights Reserved.
Figure 1: BSFC for all fuel samples with load increase
3.1.2 Exhaust Gas Temperature (EGT)
EGT trends for gasoline and the blends at different loads are shown in Fig. 2. The EGT increases with an increase in load for both gasoline and the blends. This increase in EGT with load is obvious from the simple fact that more amount of fuel was required in the engine to generate that extra power needed to take up the additional loading. Besides, engine fueled with gasoline showed the highest EGT, as compared to those of blends. Lower n-butanol concentration in the blends exhibit higher trends of EGT. Increasing the n-butanol concentration in the blends, leads to a decrease in the values of EGT as a result the lower calorific value of n-butanol. This shows that the n-butanol absorbs more heat in order to evaporate and burn, consequently decreases the in-cylinder temperature at the end of compression stroke and so the EGT at the end of combustion process. GB16 and GB20 tend to increase at loads of 2500 g and 3000 g. This could be attributed to higher in-cylinder temperatures and pressures along with the supply of rich mixture at higher loads resulted in increased EGT [20].
[1] Reported that as n-butanol concentration in the blend increased, the exhaust gas temperature decreased. This behavior could lead to the decrease in the combustion temperature. [24] reported that the latent heat of evaporation for gasoline, ethanol and butanol as 305 kJ/kg, 840 kJ/kg and 579 kJ/kg respectively, and also mentioned that due to high calorific value and lower heat of evaporation of gasoline, the exhaust gas temperature increased.
Figure 2: EGT for all fuel samples with load increase
3.1.3 Brake Thermal Efficiency (BTE)
BTE gives an idea of the output generated by the engine with respect to heat supplied in the form of fuel. Fig. 3 presents the variation of brake thermal efficiency with load. For both gasoline and the blends, the brake thermal efficiency increases with increase in load. This can be attributed to the increase in power with increase in load. The initial increase in BTE may also be attributed to the complete and high combustion of fuel, but as the load reached 2500 g, the time taken for complete combustion of fuel was decreased, hence a slight drop in BTE was observed. Oxygen present in the blends perhaps also helped in complete combustion of fuel at low load conditions. At high load conditions the change of state from molecule oxygen to atomic oxygen perhaps lead to a decrease in BTE [1].
The BTE of all the blends are higher than that of gasoline under varying load conditions. GB12 showed higher values in BTE, this could be attributed to proper combustion of the air - fuel mixture in the combustion chamber as n-butanol contains higher oxygen molecules. The lower BTE obtained in GB20 could be due to reduction in calorific value and increase in fuel consumption as compared to other blends. The higher latent heat of vaporization of n-butanol might as well be responsible for inhibiting the process of it being mixed with air, which leads to inferior combustion and thus lower BTE [21].
[12] As well revealed that the increase in BTE generally occurs due to higher latent heat of vaporization of n-butanol which results in excessive cylinder cooling at higher engine loads.
240 250 260 270 280 290 300 310 320 330 340
0 500 1000 1500 2000 2500 3000
B
ra
k
e
S
p
ec
if
ic
Fuel
C
o
n
su
m
p
ti
o
n
(
g
/k
W
h
)
Load (g)
G100
GB4
GB8
GB12
GB16
GB20
350 370 390 410 430 450 470 490
500 1000 1500 2000 2500 3000
E
x
h
a
u
st
Ga
s
T
em
p
er
a
tu
re
(
oC)
Load (g)
G100
GB4
GB8
GB12
GB16
159
Copyright © 2018. IJEMR. All Rights Reserved.
Figure 3: BTE for all fuel samples with load increase
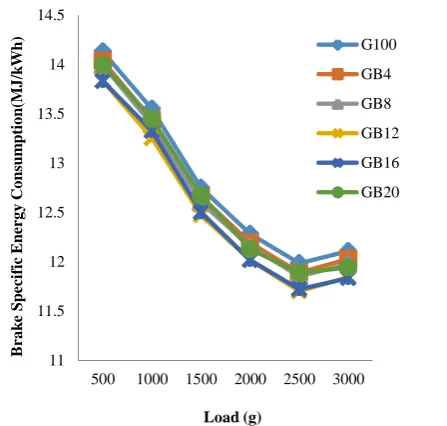
3.1.4 Brake Specific Energy Consumption (BSEC) BSEC is the energy input required to develop unit brake power and is independent of the fuel used. Fig. 4 presents the variation of BSEC for gasoline and the blends with load. Decrease in BSEC with increase in load were observed up to a load level of about 2500 g, and thereafter, a slight increase was observed. This could be due to percent increase in fuel required to operate the engine is less than the percent increase in brake power. The initial decrease in BSEC could be attributed to the complete and high combustion of fuel. Above 2500 g load level, the time taken for complete combustion of fuel decreased, hence a slight increase in BSEC was observed. It was as well observed that increase in proportion of n-butanol in the blend the calorific value decrease, while the specific fuel consumption increase, this is responsible for the lower BSEC of all blends than that of gasoline. The availability of the oxygen in the blends might as well be the reason for the lower BSEC.
[9] Reported that the engine BSEC helps in evaluating the engine economy by comparing with the volumetric consumption of all the blends. The result revealed that BSEC for n-butanol blended with gasoline reduces at all load conditions due to the leaner fuel mixture, higher fuel conversion efficiency and higher combustion efficiency. [22] likewise mentioned that BSEC expressed as the total energy supplied by fuel to generate per engine power over an hour. The BSEC also related to thermal efficiency, the result showed that improved thermal efficiency was found with decreased energy consumption.
Figure 4: BSEC for all fuel samples with load increase
3.2 Engine Emissions Analysis
The results of the tail pipe emission of the tested fuel samples for carbon dioxide (CO2), carbon monoxide (CO) and unburnt hydrocarbon (UHC), gases are presented in Figures respectively.
3.2.1 Carbon Dioxide Emissions (CO2)
The CO2 emissions level for gasoline and the blends at different loads are shown in Fig. 5. It was observed that CO2 emissions for all blends were lower as compared to that of gasoline at different loads under study. However, CO2emissions increased with increase in load for all fuel samples. The increasing trend of CO2 emissions with load was as a result of higher fuel consumption as the load increases. This could be attributed to the fact that n-butanol has low carbon and also lower elemental carbon to hydrogen ratio than gasoline fuel [13]. It was observed that slight increase of CO2 emissions for GB12, GB16 and GB20, this could be due to proper combustion of fuel [19].
Figure 5: Emission of CO2 for all fuel samples with load increase
0.2 0.22 0.24 0.26 0.28 0.3 0.32
500 1000 1500 2000 2500 3000
B
ra
k
e
T
he
rm
a
l
E
ff
ic
ie
nc
y
(%
)
Load (g)
G100
GB4
GB8
GB12
GB16
GB20
11 11.5 12 12.5 13 13.5 14 14.5
500 1000 1500 2000 2500 3000
B
ra
k
e
S
p
ec
if
ic
E
n
er
g
y
C
o
n
su
m
p
ti
o
n
(M
J
/k
W
h
)
Load (g)
G100
GB4
GB8
GB12
GB16
GB20
3 3.2 3.4 3.6 3.8 4 4.2 4.4 4.6 4.8 5
0 500 1000 1500 2000 2500 3000
CO
2
(
%
)
Load (g)
G100
GB4
GB8
GB12
GB16
160
Copyright © 2018. IJEMR. All Rights Reserved.
3.2.2 Carbon Monoxide Emissions (CO)
CO is formed mainly due to incomplete combustion of fuel. CO is converted to CO2 for a complete combustion. Incomplete combustion could be due to shortage of air or low gas temperature, CO will be formed. The variation of CO emissions for gasoline and the blends at different loads are shown in Fig. 6. It was observed that the engine emits more CO for gasoline under all load conditions when compared to the blends understudy. However, as the proportion of n-butanol in the blend increases, the percentage emission decreases owing to higher oxygen content and lower carbon to hydrogen ratio in n-butanol compared to gasoline [6]. These lower CO emissions of n-butanol blends could be due to the presence of oxygen in the blends allowing partial reduction of the CO through formation of CO2 which leads to complete oxidation than gasoline during combustion [26].
From Fig. 6, it was observed that the CO initially decreased as load increases (i.e. 500 g -2500 g) and latter increased at load of 3000 g. This trend was observed for both gasoline and the blends. Initially, at low load condition, cylinder temperature might be too low, which increases with loading due to more fuel injected inside the cylinder. Also at high load, more fuel is consumed leading to a relative lowering of the availability of oxygen for the combustion of the fuel, which results in slightly higher carbon monoxide.
This trend in emissions behavior was also corroborated by the result of the study conducted by [28] that CO and UHC emissions tend to decrease as the concentration of n-butanol increased. In another related work, [18] showed a decrease in CO emissions was attributed to a ―leaning‖ effect that occurs using oxygenated fuels such as n-butanol which is composed of 21.6% oxygen by weight.
Figure 1: Emission of CO for all fuel samples with load increase
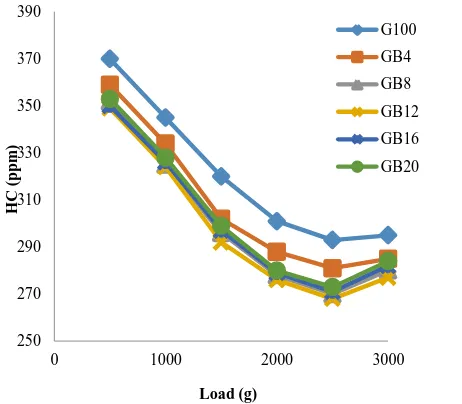
3.2.3 Unburnt Hydrocarbon Emissions (UHC)
UHC in exhaust are a result of incomplete burning of the carbon compounds in the fuel. The
emissions of UHC are majorly dependent on the engine design. The UHC layers are formed because of quenching of flame by the cold surface of walls of the combustion chamber. Fig. 7 presents UHC emissions variation for gasoline and the blends at different loads. All the blends showed lower UHC emissions than gasoline. This could be due to the oxygen content present and the richer combustible mixture of n-butanol and results in the improvement of the combustion properties of blends. GB16 and GB20 UHC emissions tend to rise close to the gasoline. The rises could be due to the density and the latent heat of n-butanol which are higher than those of gasoline. As n-butanol concentration in the blends increases, the temperature of gas mixture into the cylinder becomes lower. During the intake phase, only part of fuel injected is vaporized and most of the fuel inlet into the cylinder in the form of droplets. During the compression phase, the droplets go on vaporizing and absorbing heat. Then the cylinder temperature is reduced, resulting in lower combustion efficiency of flame front and slower the oxidation reaction process. Finally, in the area swept by flame front the amount of unburned fuel increases and UHC emissions increase [17].
It was observed that the UHC emissions decreased with sharp increase in engine load (i.e. 500 g -2500 g) and then increased slightly further with increase in load for both gasoline and the blends. The initial decrease could be due to the oxygen content present and the richer combustible mixture of n-butanol and gasoline, results in the improvement of the combustion properties of fuel. However, at load of 3000 g the effects of viscosity have increased these emission levels for the blends [4].
[24] Reported that n-butanol contains oxygen molecule, which could improve the combustion of the blends and leads to lower emissions of UHC. [11] reported that the UHC emissions emitted by n-butanol gasoline blends are lower than that of gasoline.
Figure 7: Emission of HC for all fuel samples with load increase
0 0.2 0.4 0.6 0.8 1 1.2 1.4 1.6
0 500 1000 1500 2000 2500 3000
C
O (%
)
Load (g)
G100
GB4
GB8
GB12 GB16
GB20
250 270 290 310 330 350 370 390
0 1000 2000 3000
HC
(
p
p
m
)
Load (g)
G100
GB4
GB8
GB12
GB16
161
Copyright © 2018. IJEMR. All Rights Reserved.
IV.
CONCLUSION
Conclusion can be drawn based on the spark ignition engine performance and emission characteristics of n-butanol blended with gasoline without any modification in the engine at various engine loads. The result may conclude as:
i. The use of n-butanol as a fuel additive to gasoline causes in the improvement in engine performance and exhaust emissions.
ii. Since n-butanol has lower calorific value, so the brake specific fuel consumption of the n-butanol gasoline blends are found to be higher than gasoline.
iii. Brake thermal efficiency of the n-butanol gasoline blends is found to be higher in comparison to gasoline.
iv. Due to oxygen contain by n-butanol gasoline blends, the exhaust gas temperature of the blends are found to be lower in comparison to gasoline.
v. UHC and CO emissions for GB12 and GB20 respectively were found to be lower in comparison to gasoline.
vi. All the tested fuel performed well in the engine without any hardware modification.
Overall, it can be concluded that the existing fleet of automobiles showing better performance without any modifications in engines the automobile industries.
ACKNOWLEDGMENT
The authors would like to thank the staffs of the Automobile Workshop in the Faculty of Mechanical Engineering, Federal Polytechnic Bauchi and National Centre for Petroleum Research and Development Bauchi, Nigeria.
REFERENCES
[1] Agarwal, A. K. (2007). Biofuels (alcohols and biodiesel) applications as fuels for internal combustion engines. Progress in Energy and Combustion Science, 33(3), 233-271.
[2] Balaji, D., Govindarajan, P., & Venkatesan. J. (2010). Influence of iso-butanol blend in spark ignition engine performance and emissions operated with gasoline and ethanol. International Journal of Engineering Science and Technology,2(7), 2859-2868. [3] Bill, B. & Richard, E. (2015, June 11). Ethanol and Butanol: Symbiotic Partners for a Modern Fuel. Retrieved November 22, 2016, from: https://advancedbiofuelsusa.info/ethanol-and-butanol-symbiotic-partners-for-a-modern-fuel/
[4] Broustail, G., Seers, P., Halter, F., Moréac, G., & Mounaim-Rousselle, C. (2011). Experimental determination of laminar burning velocity for butanol and ethanol iso-octane blends. Fuel, 90, 1–6.
[5] Chunbao, (Charles) X., Linghong, Z., & Pascale, C. (2010). Overview of recent advances in thermo -
Chemical conversion of biomass. Energy Conversion and Management,51, 969-982.
[6] Elfasakhany, A. (2014). Experimentally study on emission and performance of an internal combustion engine fueled with gasoline and gasoline/n-butanol blends. Energy Conversion and Management, 88, 277-283.
[7] Elfasakhany, A. (2016). Experimental study of dual n-butanol and iso-butanol additives on SI engine performance and emissions. Fuel,163, 166-174.
[8] Energy Information Administration [EIA]. (2008).
Annual Energy Outlook. Retrieved November 28, 2016, from:
http://tonto.eia.doe.gov/energyexplained/index.cfm. [9] Feng, R., Yang, J., Zhang, D., Banglin, D., Fu, J., & Liu, J. et al. (2013). Experimental study on SI engine fuelled with butanol-gasoline blend and H2O addition.
Energy Conversion and Management,74, 192-200. [10] Grabys, J. (2012). Influence of composition of gasoline – ethanol blend parameters of internal combustion engines, Journal of KONES Internal Combustion Engines, 10, 3-4.
[11] Gravalos, I., Moshou, D., Gialamas, T., Xyradakis, P., Kateris, D., & Tsiropoulos, Z. (2013). Emission characteristics of spark ignition engine operating on lower-higher molecular mass alcohol blended gasoline fuels. Renewable Energy, 50, 27-32.
[12] Gupta, V. K. (2005). Studies on diesel alcohol emulsification and performance evaluation of C.I. engine on emulsified fuels. Thesis, Ph.D. G.B.Pant University of Agriculture & Technology, Pantnagar, 112.
[13] Hubballi, P.A. & Babu, T. P. A. (2004). Effect of aqueous denatured spirit on engine performance and exhaust emissions. SAE, 2004, 28-0036. Available at: https://zapdf.com/effect-of-aqueous-denatured-spirit-on-engine-performance-and.html.
[14] International Panel on Climate Change [IPCC]. (2007). Climate Change 2007: Synthesis Report. Retrieved November 28, 2016, from: http://www.ipcc.ch/ipccreports/ar4-syr.html.
[15] Koç, M., Sekmen, Y., Topgül, T., & Yücesu, H. S. (2009). The effects of ethanol–unleaded gasoline blends on engine performance and exhaust emissions in a spark-ignition engine. Renewable Energy,34, 2101–2106. [16] Mack, J. H., Schuler, D., Butt, R. H., & Dibble, R. W. (2016). Experimental investigation of butanol isomer combustion in homogeneous charge compression ignition (HCCI) engines. Applied Energy,165, 612-626. [17] Qi, D., Liu, S., & Li, H. (2007). Experimental Investigation on an EFI Engine Fueled with Gasohol Blend. Chinese Internal Combustion Engine Engineering, 28(2), 27-30.
[18] Rice, R.W., Sanyal, A.K., Elrod, A.C., & Bata, R.M., (1991). Exhaust gas emissions of butanol, ethanol and methanol–gasoline blends. Journal of Engineering for Gas Turbine and Power, 113, 337–381.
162
Copyright © 2018. IJEMR. All Rights Reserved.
[20] Siwale, L., Kristóf, A., Bereczky, A., Mbarawa, M., & Kolesnikov, A. (2014). Performance, combustion and emission characteristics of n-butanol additive in methanol–gasoline blend fired in a naturally-aspirated spark ignition engine. Fuel Processing Technology, 118, 318-326.
[21] Szwaja, S. & Naber, J.D. (2010). Combustion of n-butanol in a spark-ignition IC engine. Fuel, 89(7), 1573-1582.
[22] Topgül, T. (2015). The effects of MTBE blends on engine performance and exhaust emissions in a spark ignition engine. Fuel Processing Technology, 138, 483-489.
[23] TQ. (2000). TD110-TD115 Test bed and instrumentation manual for small engines. London: TQ Educational and Training Publishers, 1-6.
[24] Varol, Y., Öner, C., Öztop, H. F., & Altun, Ş. (2014). Comparison of methanol, ethanol or n-butanol blending with unleaded gasoline on exhaust emissions of an SI engine. Energy Sources, Part A. 36, 938-948. [25] Reid, J. F., Hansen, A.C., & Goering, C.E. (1989). Quantifying diesel injector coking with computer vision.
Transactions of ASAE, 32(5), 1503-1506.
[26] Wigg, B., Coverdill, R., Lee, C. F., & Kyritsis, D. (2011). Emissions characteristics of neat butanol fuel using a port fuel-injected, spark-ignition engine. SAE Technical Paper, 2011-01-0902.
[27] Nileshpatil, Anandpaul & Lalit More. (2014). Literature review on effect of oxygenated additives on SI engines performance & emissions. IJEBEA, 10(1), 73-76.
[28] Yacoub, Y., Bata, R., & Gautam, M. (1998). The performance and emission characteristics of C1-C5 alcohol-gasoline blends with matched oxygen content in a single cylinder spark ignition engine. Proceedings of the Institution of Mechanical Engineers, Part A: Journal of Power and Energy,212(5), 363-379.