Transactions of the 17th International Conference on
Structural Mechanics in Reactor Technology (SMiRT 17) Prague, Czech Republic, August 17 –22, 2003
Paper # K15-2
Seismic Proving Test of Ultimate Piping Strength (Status of Design Method
Confirmation Test)
Kenichi SUZUKI(1), Y. NAMITA(1), H. ABE(1), I. ICHIHASHI(1), Kohei SUZUKI(2),T.SAKAKIDA(3), T. SATO(4) and H. YOKOTA(5)
(1) Seismic Engineering Center, NUPEC, 4-3-13 Toranomon, Minato-ku,Tokyo, Japan (2) Tokyo Metropolitan University, 1-1 Minami-osawa, Hachioji, Japan
(3) Hitachi, Ltd., 3-1-1 Saiwai-cho, Hitachi, Japan (4) Toshiba Corporation, 8 Shinsugita-cho, Isogo-ku, Yokohama, Japan
(5) Mitsubishi Heavy Industries, Ltd., 1-1-1 Wadasaki-cho, Hyogo-ku, Kobe, Japan
ABSTRACT
The proving test of a large-scale piping system with a piping bore of 200A (8B) was conducted to assure the safety margin of the current and new design codes for piping. Two test models were used, one for the design method confirmation test and one for the ultimate strength test. The design confirmation test model reflected the structural features and vibration characteristics of piping systems. For the ultimate strength test, the piping system was modified by adding one more mass and removing one horizontal support. The original seismic wave to the input seismic wave was selected to be the “S2 ” seismic wave for a PWR building. The time-pitch and the excitation level were then
modified to meet the test conditions. For the design confirmation test, a series of tests was initiated at a level of the current allowable primary stress limit (3Sm) for the “S2” seismic wave(off-resonance), cumulating in an elasto-plastic
response test up to 4.5 times the allowable primary stress limit (on-resonance as an extreme case) with no evidence of piping failure. Pre-test and post-test analyses were performed and the results compare well with the design confirmation test results of elasto-plastic global response and local strain.
KEYWORDS: piping, seismic safety, design margin, elasto-plastic response, ultimate strength, proving test, analysis
1. INTRODUCTION
Seismic safety is one of the major key issues of nuclear power plant safety in Japan, where severe earthquakes frequently occur. Hence, NUPEC have performed a series of seismic proving tests using full-scale or near full-scale models simulating actual systems and structures, as a measure to eliminate anxiety in the general public and to facilitate new nuclear power plant sites, as well as to demonstrate the seismic reliability of operating plants.
For piping, NUPEC conducted seismic proving tests of the main steam and feed water piping systems etc. However, tests were not conducted for piping failure. Piping tests have been reported in several countries [1-4], which focus on failure modes of ratcheting fatigue or collapse, seismic design margins against such failures, and allowable stress rules. These test results indicated that, according to current seismic design codes, nuclear piping possesses large safety margins leading to streamlining of the piping design [5], but it appeared that there still remained some technical issues related to the understanding of piping behavior with plasticity.
Accordingly, NUPEC initiated a new seismic proving test program in fiscal year 1998. The objectives were: i) to clarify the elasto-plastic response and ultimate strength of the nuclear piping system, ii) to ascertain the seismic safety margin of the current design code for piping, and iii) to assess new allowable stress rules.
In previous papers [6-8], the status of a series of preliminary tests for the proving test was reported. In the present paper, the status of the proving test of a large-scale piping system is reported with focus on the design method confirmation test and the pre-test and post-test analyses.
2. TEST PROGRAM AND SCHEDULE
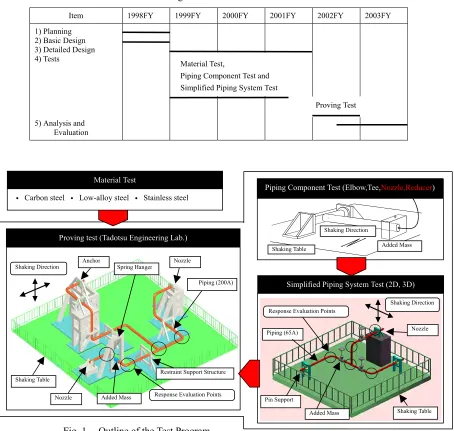
A schedule in fiscal years and a brief outline of the test program are shown in Table 1 and Fig. 1, respectively. In order to resolve extensive technical issues before proceeding on to the seismic proving test, a series of preliminary tests of the materials, piping components and simplified piping systems is intended. Low-cycle ratcheting fatigue tests of typical piping materials and quasi-static loading tests of various piping components were conducted in fiscal year 1999. Dynamic shaking tests of the piping components were carried out in fiscal year 2000. The shaking tests of simplified piping systems in two and three dimensions under off-resonance and on-resonance conditions were conducted from fiscal year 2000 to 2001, specifically aiming at our recent concern, which is piping behavior under highly plastic conditions.
Table 1 Test Program Schedule
Item 1998FY 1999FY 2000FY 2001FY 2002FY 2003FY
1) Planning 2) Basic Design 3) Detailed Design 4) Tests
5) Analysis and Evaluation
Proving Test Material Test,
Piping Component Test and Simplified Piping System Test
Spring Hanger
Response Evaluation Points Added Mass
Added Mass Nozzle
Anchor Nozzle
Shaking Table Pin Support
Added Mass Shaking Table
Shaking Direction • Carbon steel • Low-alloy steel • Stainless steel
Material Test
Piping Component Test (Elbow,Tee,Nozzle,Reducer)
Fig. 1 Outline of the Test Program
Piping (200A) Proving test (Tadotsu Engineering Lab.)
Shaking Direction
Shaking Table
Restraint Support Structure
Nozzle Simplified Piping System Test (2D, 3D)
Response Evaluation Points
Shaking Direction
Piping (65A)
3. PROVING TEST
3.1 Test Model
For the proving test of a large-scale piping system, two test models were used, one for the design method confirmation test and one for the ultimate strength test. The piping bore was 200A(8B), Sch40; and the material was carbon steel (STS410 of JIS).
(1) Design method confirmation test model
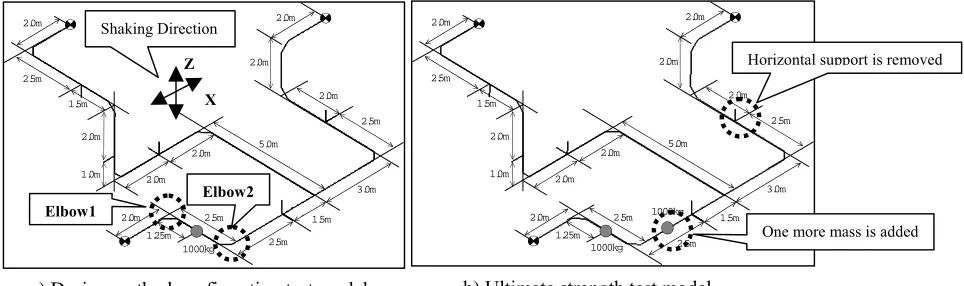
The design method confirmation test model reflected the structural features and vibration characteristics of nuclear power plant piping systems in Japan that are classified “As”. As schematically shown in Fig. 1, the structural features reflected are three-dimensional piping routes, three fixed ends (one anchor and two nozzles), five restraint support structures, one heavy weight (added mass) and ten joints (nine elbows and one tee). Figure 2a) shows the piping route of the test model, having one added mass of 1000kg and total length of 38m. The restraint-type support structures allow the piping to slide in the axial direction, but not in the horizontal and vertical directions (partially, horizontal direction only).
(2) Ultimate strength test model
2.0m
2.5m
1.5m
2.0m
1.0m 2.0m
2.0m
2.0m 2.5m
5.0m
1.25m
2.5m 1.5m
3.0m 2.5m 2.0m 2.0m
2.0m
1000kg
2.0m
2.5m
1.5m
2.0m
1.0m 2.0m
2.0m
2.0m 2.5m
5.0m
1.25m
2.5m 1.5m
3.0m 2.5m 2.0m 2.0m
2.0m
1000kg 1000kg Z
Shaking Direction
Horizontal support is removed
X
Elbow1
Elbow2
One more mass is added
b) Ultimate strength test model a) Design method confirmation test model
Fig. 2 Piping System Configuration for the Proving Test
3.2 Test Procedure (1) Test cases
Table 2 shows the proving test cases. The tests were conducted at room temperature for the design confirmation test model and the ultimate strength test model. The internal pressure was applied so that the hoop stress of the piping was equal to the design stress intensity “Sm”.
ake conditions.
In the design confirmation test, the test parameters are the excitation direction, the excitation level and the excitation frequency. The seismic shaking was repeated by a few runs in cases DM1-1 to DM2-2, but only one run in cases DM4-1 to DM4-2 (2) to avoid fatigue damage accumulation. The ultimate strength test, case US2, was aimed at piping failure by only one run of seismic shaking. Unless piping failure was observed, the seismic shaking was repeated until piping failure, since the preliminary tests indicated that the piping would fail by ratcheting-fatigue even in severe earthqu
(2) Input seismic wave
The original seismic wave to the input seismic wave was selected to be the “S2” seismic wavefor a PWR building.
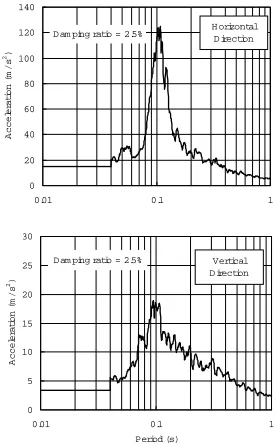
Figure3 shows a flowchart of its selection from four candidate waves and the properties that were compared. We judge that the original seismic wave selected is potentially the most detrimental to the test model. Figure 4 shows the response spectrum of the original seismic wave in the horizontal and vertical directions.
(3) Excitation level
The time scale and acceleration level of the original seismic wave was modified to obtain the piping response levels equivalent to the prescribed maximum design stress intensity of Elbow2 in Table 2. The design stress is to be calculated based on the current seismic design code for piping.
For the design confirmation test, a series of tests is initiated at a level of the current allowable primary stress limit (3Sm) for the “S2” seismic wave(of
e.
f-resonance), cumulating in an elasto-plastic response test up to 4.5 times the allowable primary stress limit (on-resonance as an extreme case). Figure 5 shows an image of the postulated relationships of acceleration and response in all the test cases. The excitation levels in cases DM2-2, DM4-2 (2)
and US-2 are limited according to the maximum capability of the Tadotsu shaking tabl
Table 2 Proving Test Cases
Test Case Excitation Excitation Direction Excitation Level
aximum Design Stress Intensity)
Dominant Frequency of Seismic Wave
Horizontal Elastic -
DM1-1 Sweep
Vertical Elastic -
Horizontal Equivalent to DM2-1, 2 Preliminary Test
DM1-2 Seismic
Vertical Equivalent to DM2-1, 2
Off-resonance
DM2-1 Horizontal +Vertical 3Sm (Equivalent to S2 stress limit)
Allowable Stress
Test DM2-2
Seismic
Horizontal +Vertical 4.5Sm (1.5 times S2 stress limit)
Off-resonance
DM4-1 Horizontal +Vertical 6Sm (2 times S2 stress limit)
DM4-2 (1) Horizontal +Vertical 10.5Sm (3.5 times S2 stress limit)
Design Confirmation Test
Elasto-plastic
DM4-2 (2)
Seismic
Horizontal +Vertical 13.5Sm (4.5 times S2 stresslimit)
On-resonance
Horizontal Elastic -
Preliminary Test US1 Sweep
Vertical Elastic -
Ultimate Strength Test
Ultimate Strength
Test US2 Seismic Horizontal 24-30Sm (8-10 times Slimit) 2 stress On-resonance
Wave (Translated to M
Method
Response Test
0 20 40 60 80 100 120 140
0.01 0.1 1
Period (s)
Ac
c
e
ler
at
ion
(m
/
s
2)
D am ping ratio = 2.5% H orizontal D irection
0 5 10 15 20 25 30
0.01 0.1 1
Period (s)
A
ccel
er
a
ti
on (
m
/s
2)
D am ping ratio = 2.5% Vertical D irection Properties for comparison:
f) Shaking feasibility at T d t
e) Elasto-plastic response Properties for comparison:
b) Equivalent cycles c) Global energy d) Energy spectrum
a) Response spectrum
Selected: • PWR -S2 4 candidates: • PWR -S2
• ABWR -S2 • ABWR -S2 • BWR -S2
2 candidates: • PWR -S2 • ABWR -S2
Fig. 3 Flowchart for Selection of the Original Seismic Wave
DM2-2 DM2-1
DM4-2 (1) DM4-1
• • •
• •
•
US2DM4-2 (2) Modification of Test Model
Resonant Excitation
Ultimate Strength Level (Failure of Elbow 2)
Excitation Level
Piping
Respon
se
L
evel
Fig. 4 Response Spectrum of the Original Seismic Wave
Fig. 5 Postulated Relationships of Excitation and R
3.3 Pre-test Analysis on Design Method Confirmation Test (1) Analysis conditions
Table 3 shows the pre-test analysis conditions for the design confirmation test model. The dominant frequency of the input seismic wave was decided according to the natural frequency that was calculated using the nominal pipe size. The maximum acceleration was decided to produce the prescribed maximum design stress intensity for
Elbow2.
(2) Analysis procedure a) Design stress analysis
e size.
Design stress analyses were performed based on the current seismic design code that requires the spectrum modal analysis using a design-damping ratio of 2.0% and the nominal pip
b) Elasto-plastic response analysis
ordinate system.
9].
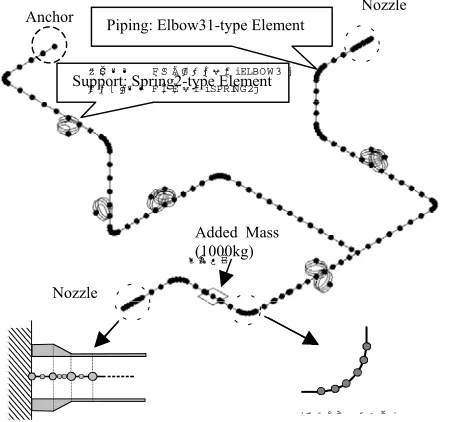
Elasto-plastic response analyses of cases DM2-1 to DM4-2 (2) were conducted using the FEM program, ABAQUS Ver.5.8. Figure 6 shows the FEM model. We modeled the piping with the Elbow31-type element and the restraint support with the Spring2-type element using the algebraic mean of the real pipe size. The Elbow31-type element is applied according to the cylindrical shell theory with polynomial and Fourier interpolation of displacement components in a curvilinear co
Figure 7 shows the pipe material stress-strain relations for the elasto-plastic response analysis. We used the bi-linear stress-strain model, kinematic hardening rule. Bi-linear characteristics were previously determined for the Elbow31-type element by fitting the elasto-plastic response in the simplified piping system test [8,
(3) Analysis results a) Design stress
Table 4 shows the design analysis results of the primary design stress of Elbow2.
e 2.
b) Elasto-plastic response
2. .
Table 5 shows the change of typical elasto-plastic responses in five analysis cases. These results are maximum acceleration, maximum displacement amplitude, maximum strain amplitude and maximum reaction force. Locations of the measurements are shown in Fig. 8. Table 6 shows the analysis results of natural frequency and damping ratio at the linear elastic level. The natural frequency, 6.2Hz for example, slightly exceeds 5.7Hz, as shown in Table 3, that was calculated using the nominal pipe size. Figure 9 shows the acceleration history of A2
in the X-direction and the displacement history of D4 that is related to the deformation of Elbow
The pre-test analysis results are compared with the test results in the next section
Table 3 Pre-test Analysis Conditions
Maximum Acceleration
Test Case Excitation
Horizontal Vertical
Dominant Frequency of Seismic Wave
0.4 m/s2 - -
DM1-1 Sweep
- 0.4 m/s2 -
8.9 m/s2, 14.9 m/s2 - 4.4Hz
Preliminary Test
DM1-2 Seismic
- 2.0 m/s2, 3.4m/s2 5.0Hz
DM2-1 8.9 m/s2 2.0 m/s2
Allowable Stress
DM2-2
Seismic
14.9 m/s2 3.4 m/s2 4.4Hz (Horizontal) 5.0Hz (Vertical)
DM4-1 8.9 m/s2 2.0 m/s2
DM4-2 (1) 15.0 m/s2 3.9 m/s2
Design Method Confirmation
Test
Elasto-plastic
DM4-2 (2)
Seismic
20.0 m/s2 4.6 m/s2
5.7Hz (Horizontal) 6.4Hz (Vertical) Wave
Test
Response Test
Note) Natural frequency is calculated using the Elbow31-type element with respect to the nominal pipe size according to the piping design code, and is used for the spectrum modal analysis.
0 100 200 300 400 500 600
0.0 0.5 1.0 1.5 2.0 2 5
Strain (%)
S
tr
e
ss
(N/
m
m
2)
iƒG ƒ‹ ƒ{ ‚Ì —v ‘f •ª Š„ j 1j
1000kg ƒ
m ƒY ƒ‹
ƒ m ƒY ƒ‹ ƒ
A ƒ“ ƒJ Piping: Elbow31-type Element
Anchor Nozzle
Nozzle
Elbow31-type Element for Elbow •
t ‰Á •¿ —Ê Added Mass (1000kg) ”
z ŠÇ •” •ª F ‘S ‚Ä ƒG ƒ‹ ƒ{ —v ‘f iELBO W 3
ƒ
T ƒ| [ ƒg•” •ª F ‚Î ‚Ë —v ‘f iSPRING2j Support: Spring2-type Element
iƒm ƒY ƒ‹ ‚Ì —v ‘f •ª Š„ j
Elbow31-type Element for Nozzle
Bi-linear model
Muti-linear model
Fig. 7 Stress-strain Relations for Elasto-plastic FEM Analysis
.
Fig. 6 FEM Response Analysis Model for the Design Method Confirmation Test
Primary Design Stress
Test Case Internal
Pressure
Dead load Horizontal Excitation
(H)
Vertical Excitation
(V)
H+V Total
DM2-1 2.31Sm 0.14Sm 2.32Sm 2.92Sm
DM2-2 3.89Sm 0.24Sm 3.90Sm 4.50Sm
DM4-1 5.82Sm 0.19Sm 5.83Sm 6.43Sm
DM4-2(1) 9.86Sm 0.32Sm 9.86Sm 10.46Sm
Design Confirmation
Test
DM4-2(2)
0.52Sm 0.09Sm
13.14Sm 0.43Sm 13.15Sm 13.75Sm
Table 4 Pre-test Analysis Results (Maximum Design Stress Intensity of Elbow2)
Method
Table 5 Results on the Design Method Confirmation Test and Pre-test Analysis
Design Confirmation Test Pre-test Analysis
Location Direction
DM2-1 DM2-2 DM4-1 DM4-2
(1) DM4-2 (2) DM2-1 DM2-2 DM4-1 DM4-2 (1) DM4-2 (2)
X 9.2 15.5 12.7 18.9 27.4 8.9 14.9 8.9 15.0 20.0
Shaking
table Z 2.1 2.9 2.2 3.5 4.6 2.0 3.4 2.0 3.4 4.6
X 19.9 35.1 82.7 97.6 113.1 23.5 36.7 74.8 102.3 117.9
Max. Accel. (m/s2)
A2
Z 4.1 7.1 10.0 16.4 22.9 2.7 4.5 6.5 10.2 12.6
Max. Disp. Amp. (mm)
D4 X 14 25 61 73 86 16 25 51 72 85
Hoop(ID) - - - 0.14 0.23 0.45 0.69 0.91
Elbow1
(Frank) Hoop(OD) 0.09 0.17 0.61 0.7 0.76 0.1 0.16 0.30 0.44 0.53
Hoop(ID) - - - 0.18 0.29 0.67 1.08 1.35
Max. Strain Range (%)
Elbow2
(Frank) Hoop(OD) 0.11 0.19 0.74 0.84 1.03 0.12 0.20 0.44 0.65 0.77
Y 12.2 22.3 51.4 64.9 73.5 15.2 21.9 38.3 57.8 64.6
SA2
Z 2.0 3.0 6.4 9.3 12.1 3.0 4.8 4.7 9.2 12.7
X 10.5 18.0 30.2 38.1 46.8 14.6 23.6 28.7 52.1 59.4
Max. Reaction
SA3
Z 2.6 5.2 16.4 23.3 26.8 4.4 6.6 14.5 23.1 27.6
Force (kN)
Notes) Maximum input accelerations in cases DM4-1, 2 are at least 26% larger in the test than in the pre-test analysis conditions, because shaking tests for input compensation to produce a good match to each target spectrum were not performed to avoid fatigue damage accumulation.
‚ w
‚ x ‚ y
Elbow 1
Elbow 2 A2,D4
SA2 Table 6 Results on Sweep Test and Pre-test Analysis
Design Method Confirmation Test
Pre-test Analysis Item
1st mode (Horizontal)
2nd mode (Vertical)
1st mode (Horizontal)
2nd mode (Vertical) Natural
(Hz)
6.3 8.1 6.21) 7.51)
Damping Ratio (%)
2.1 4.8 2.02) 2.02)
Frequency
Note1) Natural frequency is calculated using the algebraic mean of the real pipe size.
Note2) A design damping ratio of 2.0% is used.
SA3
Fig. 8 Location of Measurements
-100 -50 0 50 100
0 10 20 30 40 50 60
Tim e (s)
A
cce
ler
a
ti
on
(
m/
s
2)
-100 -50 0 50 100
0 10 20 30 40 50 60
Tim e (s)
Ac
c
e
ler
a
ti
on
(
m/
s
2)
-80 -40 0 40 80
0 10 20 30 40 50
Tim e (s)
De
for
m
a
ti
on
(mm
)
-80 -40 0 40 80
0 10 20 30 40 50
Tim e (s)
De
for
m
a
ti
on
(mm)
Pre-test Analysis
60 Test
60 Test
Pre-test Analysis
b) Displacement (D4) a) Acceleration (A2 in X-direction)
Table 7 Design Confirmation Test Results
Resonant Frequency
(Hz)
Damping Ratio (%)
DM1-1 6.3 2.1
DM2-1 6.3. 2.1
DM2-2 6.2 2.3
DM4-1 6.0 2.4
DM4-2 (1) 6.0 2.9
DM4-2 (2) 5.9 3.4
Z
Y X
a) 1st mode: 6.3Hz (X-direction) b) 2nd mode: 8.1Hz (Z-direction)
Fig. 10 Vibration Mode in the Sweep Test
Note) Resonant frequency and damping ratio are calculated by the AR method.
3.4 Test Results on Design Method Confirmation Test (1) Elasto-plastic response
Maximum input acceleration levels in cases DM4-1 to DM4-2 (2) are at least 26% larger in the tests than in the target test conditions that are equivalent to the pre-test analysis conditions shown in Table 3. Shaking tests for input compensation to produce a good match to each target spectrum was not performed in these cases to avoid fatigue damage accumulation. Post-test examination of case DM4-1 revealed that the input seismic wave spectrum on the table differed from the target spectrum and the maximum acceleration on the table exceeded the target. Hence, the input conditions of cases DM4-2 (1) and (2) were modified, but still differed from the target in a frequency over 10Hz, whose frequency is not judged to influence response behavior.
Table 5 shows the change of typical elasto-plastic response in five test cases. Figure 10 shows the vibration modes in the sweep test. In the first mode, the test model is excited exclusively in the X-direction, so that Elbow2, for example, bears in-plane bending moment and displacement. Figure 9 shows the acceleration history of A2 in the X-direction and the displacement history of D4 that is related to the deformation of Elbow2. The strain history of
Elbow2 is shown in Fig. 12. The total strain range data indicate that Elbow1 and Elbow2 behaved elastically in case DM2-2 and showed elasto-plastic behavior in cases DM4-1 to DM4-2 (2).
icity.
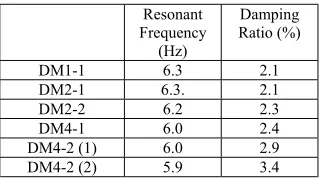
Tables 6 and 7 show the results of natural frequency and damping ratio. As expected, the resonant frequency tends to decrease and the damping ratio tends to increase with an increase in plast
(2) Damage observation
Post-test observation revealed that ratcheting deformation of Elbow1 and Elbow2 was initiated from case DM4-1. No evidence of piping failure through-wall cracking was observed in all tests.
(3) Simulation by pre-test analysis
In Tables 5 and 6, and in Fig. 9, the test results are compared with the pre-test analysis results. The analyses of elasto-plastic response simulate the tests well with the exception of the following listed results.
a. The analysis of case DM4-1 underestimated the test, because the excitation level was essentially higher than the target level.
.
b. The analysis of local strain in cases DM4-1 to DM4-2 (2) underestimated the test. We noted that the present analysis procedure using the Elbow31-type element has less applicability to simulate local strain in the elasto-plastic region
Accordingly, we performed a post-test analysis to simulate the test results with higher accuracy.
3.5 Post-test Analysis on Design Method Confirmation Test
Since the pre-test analysis of case DM4-1 underpredicted the whole test results, a post-test analysis of case DM4-1
was conducted. (1) Analysis procedure
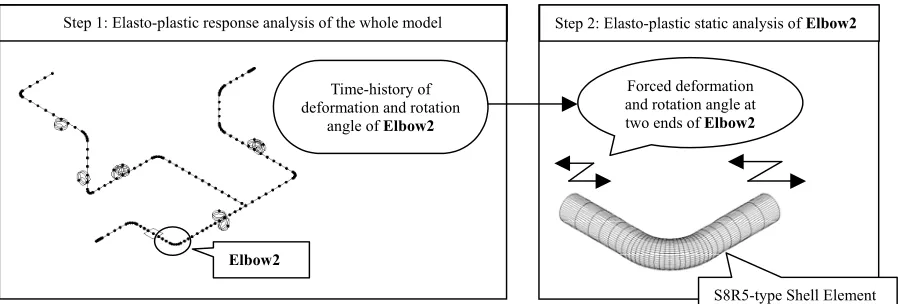
The post-test analysis was carried out in two steps as shown in Fig. 11. This procedure was previously developed in the simplified piping system test. In step 1, the elasto-plastic analysis of the whole model was performed and the displacement responses of each nodal point at two ends of Elbow2 were obtained from the results. Basically, the procedure was the same for the pre-test analysis except that the acceleration history recorded on the shaking table and the actual damping ratio were used. In step 2, the local strain behavior of Elbow2 was calculated by forced displacement analysis. We used the S8R5-type shell element with respect to the real pipe thickness distribution, AF-OW hardening rule [9] and the multi-linear stress-strain model derived from the tensile test of the pipe material shown in Fig. 7.
(2) Analysis results
Fig. 11 FEM Strain Analysis Procedure for Design Method Confirmation Test Elbow2
Time-history of deformation and rotation
angle of Elbow2
Step 1: Elasto-plastic response analysis of the whole model Step 2: Elasto-plastic static analysis of Elbow2
S8R5-type Shell Element Forced deformation
and rotation angle at two ends of Elbow2
Table 8 Results on Post-test Analysis for DM4-1
X
Z Y
Hoop strain at elbow frank DM4-1
Location Direction
Test Post-test Analysis
X 12.7 12.7
Shaking
Table Z 2.2 2.2
X 82.7 80.5
Max. Accel. (m/s2)
A2
Z 10.0 6.5
Max. Disp.
Amp. (mm) D4 X 61 55
Max. Strain Range (%)
Elbow2
(Frank)
Hoop (OD)
0.74 0.84
Y 51.4 45.9
SA2
Z 6.4 6.3
X 30.2 36.8
Max. Reaction Force (kN)
SA3
Z 16.4 18.9
-1.0 0.0 1.0 2.0 3.0
0 10 20 30 40 50 60
Tim e (s)
H
oop
S
tra
in
(%)
-1.0 0.0 1.0 2.0 3.0
0 10 20 30 40 50 60
Tim e (s)
H
oop
St
ra
in
(%
)
Post-test Analysis Test
Fig. 12 Strain Time-history of Elbow2 for DM4-1
Note) The acceleration history on the shaking table and the actual damping ratio are used for the post-test analysis.
4. SUMMARY
To assure the safety margin of current and newly proposed design codes for piping, the proving test of a large-scale piping system was conducted, using the design confirmation test model and the ultimate strength test model. A series of design confirmation tests were cumulated in an elasto-plastic response test up to 4.5 times the allowable primary stress limit for S2with no evidence of piping failure. The pre-test and post-test analyses were performed and the results
compare well with the test results of elasto-plastic global response and local strain. Results related to the ultimate strength test and the newly proposed design code will be reported elsewhere.
ACKNOWLEDGEMENTS
This program is one of the proving tests under the sponsorship of the Ministry of Economy Trade and Industry (METI). A test executive committee, consisting of experienced persons, has been established for conducting surveys, planning, examination and evaluation. The authors would like to take this opportunity to express sincere gratitude to Professor Heki Shibata for his invaluable advice, and to express appreciation for the support from all committee members concerned.
REFRENCES
1. EPRI Report, Piping and Fitting Dynamic Reliability Program (PFDRP), Vol. 1-5 (1989, 1992, 1993). 2. N. Blay, F. Toubul, T. M. Blanchard, F. Le Breton, SMIRT14, Vol. K, pp. 95-102 (1997).
3. S. Kawakami, N. Tanaka, M. Kato, et al., SMIRT 10, Vol. K, pp. 745-750 (1989). 4. K. Yoshino et al., ASME PVP, Vol. 407, pp.131-137 (2000).
5. ASME, Boiler and Pressure Vessel Code, Sec. III, Div. I, Sub section NB(1994 Addenda). 6. K.Suzuki et al., ICONE- 9, Paper No. 155 (2001).
7. Y.Namita et al., ASME PVP, Vol. 428-1, pp.13-19 (2001). 8. K.Suzuki et al., ASME PVP, Vol. 445-1, pp.99-106 (2002).