ABSTRACT
SCHAFF, JENNIFER. Profiling Root Knot Nematode-Tomato Interactions. (Under the direction of David McK Bird.)
Root-knot nematodes (RKN) have a very broad host range, encompassing over 2,000 plant species. Most agricultural crops are parasitized by at least one species of
Meloidogyne, causing billions of dollars in crop yield loss worldwide and chemical
contamination of the environment through judicious use of nematicides. RKN elicit dramatic morphological changes in susceptible plants to establish obligatory feeding sites that consist of metabolically active, multinucleate giant cells. Giant cells are remarkably similar in very different plant species suggesting signals from the nematode interact with fundamental aspects of plant cell biology and differentiation.
I am interested in the concomitant global changes of host and nematode gene
expression during RKN pathogenesis. I initiated a microarray experiment using a unique, defined set of tomato genes known to be expressed in tomato root tissue. Microarrays were interrogated with infected resistant tissue and infected susceptible tissue collected over four time points representing subsequent stages of RKN infection and I generated and applied a sophisticated looped and interwoven looped designed to facilitate comparison of all these tissues. This is the first time that a microarray analysis has been employed to establish host responses to nematodes in a natural host, and is first time transcript abundance
comparisons have been made in the very early time frame following infection and therefore gives the first comprehensive glimpse at gene expression during initiation of giant cells and during the resistant response. I found that gene expression patterns in a susceptible
glycosyltransferase and was chosen for gene silencing experiments. I found that in absence of expression, nematodes are able to establish feeding sites in the plant indicating that this gene is part of the necessary resistance pathway in the plant.
As well as exploring gene regulation during host response to RKN, I examined gene regulation in nematodes during pathogenesis. Nematode transcript analysis using microarrays has yet to be established and one reason may be that it is difficult to dissect nematodes from root tissue, especially during early hours post infection. I demonstrated that transcript and changes in transcripts can be detected using RNA extracted from infected root tissue, alleviating the need to dissect out the nematodes.
In addition to the microarray analyses, I have analyzed, annotated, and profiled the expression of the giant cell library first constructed in 1994. The results reported here validate the gene discovery from this library, and expand our knowledge of both host and nematode genes regulated during a sophisticated parasitic interaction.
The study of plant development and cell biology is of critical importance for the continued improvement of crop species and can lead to broad improvements in plant breeding
Profiling Root Knot Nematode-Tomato
Interactions
by
JENNIFER SCHAFF
A dissertation to the Graduate Faculty of
North Carolina State University in partial
fulfillment of the requirements for the
Degree of Doctor of Philosophy
Plant Pathology
Raleigh
2006
APPROVED BY
David
McK
Bird
Steven
A
Lommel
Chair of Advisory Committee
DEDICATION
This dissertation is dedicated to my husband, Charlie, and my parents, Russ and
Sue, whose love and support encourages me to reach my goals and be my best
BIOGRAPHY
Jennifer Schaff was born and raised in the Pacific Northwest, and graduated with honors from the University of Washington in Seattle in 1996. She took a position as
laboratory technician and manager with Dr. David McK. Bird at North Carolina State
University in 1997, and, in 2001, entered a Ph.D. program with Dr. Bird as major
professor. During this program, she retained her position as lab manager while
performing her doctoral research. She is married to Dr. Charles Opperman, and resides
ACKNOWLEDGEMENTS
I owe a debt of gratitude to my major professor, Dr. David McK. Bird, for sage advice, support, and providing a platform for me to realize my degree. It would not have been
possible without his insight and keen grasp of the system I worked on. I would like to
thank Dr. Dahlia Nielsen, Dr. Greg Gibson, and Dr. Steve Lommel for serving on my
committee, and providing support, input, and their help to get through the difficult times
during this project. I want to thank Dr. Chris Smith for immeasurable help and patience
as I worked through the statistics. I also want to thank Mark Burke, and Dr. Betsy Scholl,
Reenah Schaffer, Jim Gajan, Stella Chang, and all the other people from the Center for
the Biology of Nematode Parasitism. You’ve been a source of fun, shoulders to lean on,
and endless entertainment. I want to say thank you to Bryon Sosinski, Regina Ali, and all
the people from the Genome Research Laboratory. Finally, I want to thank my family for
their support and faith in me, even when I wasn’t quite sure. To Rose, Orson, Buttercup,
TABLE OF CONTENTS
Page
LIST OF TABLES
viLIST OF FIGURES
viiiChapter 1: INTRODUCTION
1Chapter 2: Profiling the giant cell library
Background 13
Results 14
Discussion 18
Materials and Methods 22
Tables 24
Figures 28
Chapter 3: Transcriptome profiling in tomato reveals a role for
glycosyltransferase in
Mi
-mediated nematode resistance
Introduction 30
Results 32
Discussion 42
Materials and Methods 46
Tables 54
Figures 58
Chapter 4: Detecting changes in root-knot nematode
transcripts during pathogenesis on tomato
Introduction 67
Results 68
Discussion 74
Materials and Methods 78
Tables 80
Figures 82
Chapter 5: DISSCUSSION and CONCLUSIONS
84REFERENCES
96LIST OF TABLES
Page
Chapter 2: Profiling the giant cell library
Table 2.1: Annotation of 186 distinct giant cell genes 24
Table 2.2: Color coded matrix (partial) 27
Also included in the appendix as supplemental materials:
Table S2.1 Annotation of all Giant Cell genes 104
Table S2.2: Color coded matrix (complete) 109
Chapter 3: Transcriptome profiling in tomato reveals a role for
glycosyltransferase in Mi-mediated nematode resistance.
Table 3.1: Number of genes categorized according to known
or suspected involvement in feeding site and gall formation 54
Table 3.2: Predicted protein motifs found in tomato array
root genes (partial) 55
Table 3.3: Genes selected for verification of statistical
analysis using RT-PCR 56
Table 3.4: Fold changes of transcript abundance for indicated
genes determined using quantitative PCR 56
Also included in the appendix as supplemental materials:
Table S3.1: Gene IDs and Annotations, Direction Change
of Significant Genes 111
Table S3.2: Keyword to Identify Gene Groups 127
Table S3.3: Predicted protein motifs found in tomato array
root genes 128
Table S3.4: RT-PCR primers for tomato genes used in
quantitative PCR analysis 143
Table S3.5: RT-PCR ∆CTs for genes used in quantitative
Chapter 4: Detecting changes in root-knot nematode
transcripts during pathogenesis on tomato
Table 1: Annotation of nematode genes 80
Table 2: Nematode Gene Groups 81
Also included in the appendix as supplemental materials:
Table S4.1: Annotation of nematode genes 145
Table S4.2: RT-PCR primers for nematode genes used in
quantitative PCR analysis 150
Table S4.3: RT-PCR ∆CTs for genes used in quantitative
LIST OF FIGURES
Page
Chapter 1: INTRODUCTION
Figure 1: Life Cycle of RKN 1
Chapter 2: Profiling the giant cell library
Figure 1: Tomato tissue comparison tree 28
Chapter 3: Transcriptome profiling in tomato reveals a role for
glycosyltransferase in Mi-mediated nematode resistance.
Figure 3.1: Gene Ontology (GO) classification of all tomato genes 58
Figure 3.2: Gene significance results for cultivar and age
comparison in tomatoes 58
Figures 3.3: Gene significance results for roots infected with nematode at the onset of reproduction compared
to uninfected tissue 59
Figure 3.4: Gene expression differences in susceptible tissue
over four time periods post infection 59
Figures 3.5: Cartoon representation of expression changes
of each of the 8 classes of genes represented in figure 3.4 60
Figure 3.6: Gene expression differences in resistant tissue over
four time periods post infection 60
Figure 3.7: Cartoon representation of expression changes of each
of the 6 classes of genes represented in figure 3.6 61
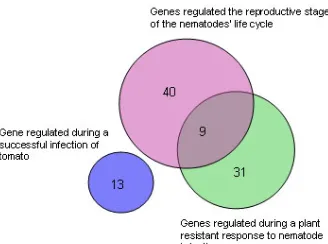
Figure 3.8: Venn diagram comparing sets of regulated genes 61
Figure 3.9: Summery of expression responses of categories of
genes differentially expressed in the nematode plant interaction 62
Supplemental Figures
Figure S3.1: Loop design of cultivar and age comparison 63
Figure S3.2: Experiment design comparing mixed stage infected
to uninfected roots 63
between roots infected with different species of RKN at onset of
reproduction and uninfected roots 64
Figure S3.4: Inter-connected loop design to test differences in gene expression between roots infected with different species
of RKN and uninfected roots 64
Figure S3.5: Lesions and leaf curling symptoms on a Motelle plant
on which VIGS was used 65
Figure S3.6: Tomato plants in growth pouches, ready for infection
by RKN 65
Chapter 4: Detecting Changes in Root-knot Nematode
Transcripts During Pathogenesis on Tomato
Figures 1: Volcano plots reveal nematode genes
regulated during pathogenesis 82
Figure 2: Expression patterns of nematode genes
regulated during pathogenesis 82
Figure 3: Expression pattern of nematode genes
regulated during a resistant response 82
Figure 4: Venn diagram depicting overlapping gene regulation under three conditions assayed during
nematode infection 83
Chapter 1: INTRODUCTION
As a group, plant parasitic nematodes collectively cause over $100 billion in crop losses
on a worldwide scale and the vast majority of this damage is caused by sedentary
endoparasitic forms, particularly Meloidogyne spp. (Sasser and Freckman, 1987; Koenning
et al., 1999). Sedentary endoparasitic nematodes establish elaborate feeding sites within
the host root and these may range from slightly altered cortical cells to vascular cells that
are developmentally altered in their fate and function (Jones, 1981). The feeding sites
induced by the root-knot (Meloidogyne spp.) nematodes are the most complex, consisting of
large, multi-nucleate cells termed giant cells.
Root-knot nematodes have a very broad host range, encompassing over 2,000 plant
species (Sasser, 1980). Most agricultural crops are parasitized by at least one species of
Meloidogyne (Sasser, 1980). The feeding site of the root-knot nematode (RKN) is initiated
after the infective second-stage juvenile (Figure 1a) has penetrated behind the tip of the
host root in the zone of elongation, and migrated (Figure 1b) to the developing vascular
cylinder. It is not clear exactly how the nematode elicits the change in the developing plant
cells (Figure 1c), but it has been hypothesized that feeding sites are induced through
glandular secretions injected via the nematode stylet into several root cells surrounding the
anterior end of the nematode (Christie, 1936; Hussey, 1989). The 6-10 giant cells (Figure
1d) form within or near the developing vascular cylinder and become the permanent,
Clockwise from the top: RKN hatch as second stage juveniles (1a) in the soil. They infect host root tips, usually behind the root cap and migrate (1b) to the developing vascular stele where they initiate their feeding site (1c). Figure 1d is a cross section through a typical feeding site.
Approximately 4 weeks after infection, swollen RKN females (1e) lay eggs in a gelatinous mass on the root surface and the process starts again. Micrographs are a courtesy of Allen Bird (1a, 1d, and 1e); Burt Endo (1b); and Manuel Mundo Ocampo (1c).
obligatory feeding site of RKN. Giant cells undergo repeated nuclear divisions without
cytokinesis. The nuclei are large and highly endoreduplicated, and may contain 14-16 times
more DNA than do normal root tip nuclei (Jones and Northcote, 1972; Jones, 1981; Wiggers
et al., 1990). The giant cells become greatly enlarged, increased numbers of cellular
organelles accumulate, and the cytoplasm becomes very dense and granular. The
metabolically-active giant cells act as nutrient sinks to provide food to the developing
nematode (McClure, 1977; Huang, 1985). One characteristic feature of root-knot nematode
giant cells is the highly invaginated and thickened cell walls, (apparent in Figure 1d) that are
similar to cell walls observed in transfer cells (Jones, 1981). With the commencement of
feeding, the RKN becomes sedentary and are dependent upon the giant cells for its survival
and eventual reproduction (Figure 1e). It has also been demonstrated that the maintenance
and integrity of giant cells depends on continuous stimulation by RKN (Bird, 1962).
RKN not only initiates feeding sites, but also affects global plant processes. Loveys and
Bird (1973) reported that high inoculum levels of M. javanica on tomato caused a decline in
the photosynthesis rate within two days after inoculation. They also established that
root-knot infection influenced not just the roots, but affected the whole plant by demonstrating
that pruning the apical meristem of tomatoes increased the photosynthetic rate of uninfected
plants, but had no effect on infected plants. Water relations are also affected by infection of
RKN. Meon et al., (1978) found that water flow in infected tomato roots decreased with
increasing inoculum, and it is commonly accepted that under drought conditions, infected
plants are unable to take up sufficient water to avoid wilt and damage. Respiration is also
affected by RKN infection, although differences in respiration seem to depend on specific
host/species interactions and age of infection. Myuge (1956) reported that respiration of
RKN galls on cucumber was three times greater than that of uninfected tissue. Owens and
Rubinstein (1966) found that galls from 40-day old tomato plants respired at a lower rate
uninfected tissue. It is clear that the global impact of RKN on the plant has been known for
many years, but how and why basic plant processes are affected still remains mostly
elusive.
Lohar and Bird (2003) provided additional evidence that global gene regulation occurs
during RKN infection. They established that Lotus japonicushar1-1 mutants have a similar
phenotype upon infection of RKN as they do when inoculated with rhizobia; roots
hypernodulate (Woperis et al., 2000) and hyperinfect. Nearly twice as many galls formed on
the har1-1 mutants than did on the wild-type plant. Lotus har1-1 mutants produce an
increased number of shortened, lateral roots in the absence of rhizobia, described as bushy
root system (Wopereis et al., 2000). In addition to hypernodulation, there is inhibition of root
and shoot growth when these mutants are inoculated with a compatible strain of rhizobia.
Importantly, the mutant phenotype is restored when har-1 activity is present in the shoot.
Krussel et al., (2002) and Nishimura et al., (2002) suggest that HAR-1 may interact with a
root derived signal in the shoot, and that the interaction induces a feed back regulation of
nodulation and lateral root formation. This demonstrates that the har1-1 phenotype is shoot
controlled and provides further evidence that RKN infection affects (or is affected by) global
gene regulation in the plant.
Plant gene expression patterns are altered during nematode feeding site initiation (Bird et
al., 1994; Gheysen and Fenoll, 2002; Sijmons, 1994). Up-regulation of nonspecific plant
defense genes are detected only 12 hours post infection (Williamson et al., 1994;
Williamson and Hussey, 1996). Activated defense genes include peroxidases, chitinases,
extensins, and proteinase inhibitors. Callose or lignin may also be deposited as a physical
barrier along the cell wall (Balhadère and Evans, 1995). Many non-specific defense genes
are activated in both resistant and susceptible responses, albeit with differences in levels
and timing (Gheysen and Fenoll, 2002). Among the many genes up-regulated in nematode
and cell wall related genes including those encoding for extensions (Niebel et al., 1993) and
pectinacetylesterases (Vercauteren et al., 2002).
In addition to these classes of genes, phyto-hormones are also an important group of
root development regulators that previous studies have linked in RKN-host plant relations
(Viglierchio and Yu, 1968; Bird, 1974; Jones, 1981). Recent histological evidence using the
auxin-inducible promoter element fused to the GUS gene reveal high concentrations of
auxin in feeding sites and gall tissue immediately surrounding the giant cells compared to
uninfected root tissue (Hutangura et al., 1999; Karczmarek et al., 2004). Histological
evidence using auxin-inducible promoter element::GUS and cytokinin-responsive promoter
ARR5::GUS and ARR5::GFP fusions also indicates that, like in the development of
nematode induced feeding sites, both auxin and cytokinins plays a role in development of
nodules (Mathesius et al., 1998; Lohar et al., 2004).
Based upon the biology of the giant cells, it is easy to see why genes related to cell
cycle control, cell wall formation, and hormone function seem attractive to study as they are
obvious candidates for causing morphological differences observed in giant cells relative to
uninfected root tissue. Other tactics to identify genes differentially expressed have relied on
in situ hybridizations (Goellner et al, 2001, Lohar et al., 2004, Gal et al., 2006) and promoter
trapping strategies (Barthels et al., 1997; Favery etal., 2004). Gheysen and Fenoll (2002)
provide a detailed review of many of these genes, including approximately 50 genes known
to be up-regulated in giant cells and a few that are repressed.
Bird’s laboratory (Bird and Wilson, 1994; Wilson et al., 1994) was the first to provide a
comprehensive study on a large number of genes expressed in giant cells. They made a
subtractive cDNA library that selected transcripts up-regulated in the nematode feeding site
and found that many of these genes are not normally expressed in mature root tissue,
suggesting that the nematode is able to induce alterations in transcriptional control patterns.
family of plant Myb transcription factors. Genetic investigation of this gene, called
PHANTASTICA in snapdragon and rough sheath2 in maize, reveals it is required for normal
meristem function (Timmermans et al., 1999; Tsiantis et al., 1999; Waites et al., 1998) and
typical giant cell formation. Ablation of the expression of Le-Phan in giant cells results in
giant cells that are much smaller than typical giant cells but that are still able to support the
life cycle of the nematode through reproduction (Schaff and Bird, unpublished data). Using
in-situ hybridizations, transcripts from Le-phan have been localized to both meristematic
tissue and giant cells (Koltai and Bird, 2000). Koltai et al. (2000) also detected Le-phan
transcripts in rhizobia induced nodules. This suggests that overlapping regulatory pathways
leads to the formation of giant cells and nodules. Nodules are new meristems initiated by
rhizobia bacteria in the roots of legumes under conditions of nitrogen limitation and
represent a beneficial outcome between the association of rhizobia and the root. These new
meristems differentiate into a complex, multi-celled organ that is comprised of unique tissue
not found in the absence rhizobia.
Collectively, these and the Lotus japonicushar1-1 mutant results suggest that comparing
these beneficial symbioses with the harmful interaction of plant parasitic nematodes on
plants may yield more commonalities between genes and or pathways manipulated by these
organisms during elicitation of their respective novel structures.
Recently, two groups have used microarrays to look at changes in gene expression
induced by RKN infection. Because giant cells have characteristics of transfer cells,
Hammes, et al. (2005) initiated a study to identify transport processes that contribute to the
development and function of nematode induced feeding sites. They compared RKN infected
and healthy root tissue to examine expression of transporter genes at weekly intervals post
infection and determined that multiple transport processes are regulated, some in giant
cells, and others in non-infected areas of the root. Jammes et al., (2005) used giant cell
uninfected roots and picked a time course that also included weekly intervals. They were
able to establish that as many genes are repressed as are up-regulated upon nematode
infection indicating that gene repression might also be essential for proper gall formation.
Analyses of these studies provide useful insights to function and maintenance of giant cells.
The host plant employed in both of these studies was Arabidopsis thaliana, a member
of the Brassica family that is also a biological model system for many aspects of basic plant
biology. Arabidopsis was the first plant to have its genome completely sequenced and is the
subject of biological research worldwide. Because of this, it is the most well-characterized
plant species. Unfortunately, Arabidopsis is a relatively poor host for the root-knot
nematode, and extensive screening has failed to yield an ecotype fully resistant to RKN
(Niebel et al., 1994). We have observed many times that the total brood size from an RKN
infection produces fewer eggs than starting inoculum on Arabidopsis. Weerasinghe et al.,
(2005) reported that Arabidopsis root hairs do not respond to Nod Factor (NF) or Nem
Factor, which are primary factors in host recognition and successful parasitism and they
postulate the reason is the absence of the SYMRK or the DMI3 calcium- and calmodulin-
dependent protein kinase that are necessary for NF signal transduction of (Riely et al.,
2004). Because RKN feeding site and nodule formation induce common host pathways,
including specific transcription regulators, (Koltai and Bird, 2000), early nodulation genes
(Koltai et al., 2001; Favery et al., 2002) and cytokinin responsive pathways (Lohar et al.,
2004), this further suggests that Arabidopsis lacks some of the fundamental plant pathways
that RKN exploits for robust parasitism.
Understanding host resistance has long been a goal for scientists who study RKN–plant
interactions with the objective of reducing crop yield loss. A thorough understanding of
resistance mechanisms and the genes involved in the pathway is necessary in order to
better deploy resistant varieties, maximize their lifetime (before resistance is broken), and
has relied upon principals of integrated pest management; namely crop rotation, chemical
nematicides, and host resistance. Crop rotation is hampered by the broad host range of
root-knot nematodes and may not be economically feasible for many growers. Use of
chemical nematicides is gradually being phased out due to public health and environmental
concerns. Extensive use of nematicides has been linked to ground water contamination,
toxicity to birds and animals, and residues in food (Thomason, 1987). Methyl Bromide
(MeBr) is an odorless, colorless gas that has been used with great success as a soil
fumigant and soil sterilant to control RKN. However, because MeBr depletes the
stratospheric ozone layer (Watson et al., 1992), the amount of MeBr produced and imported
in the U.S. was incrementally reduced until the phase-out took effect on January, 2005.
MeBr is just one of many nematicidal compounds that have been banned over the past 30
years.
Host resistance is the most environmentally and economically sound method to control
RKN (Cook and Evans, 1987). Unfortunately, genetic resistance to plant-parasitic
nematodes is not available for most cultivated host species. Relatively few sources of
natural resistance have been identified in most crops. In those hosts where resistance is
available, it has proved to be extremely valuable and effective. For example, the introduction
of the Heteroderaglycines-resistant cultivar 'Forrest' was reported to save soybean growers
in the southern United States over $400 million during a 5 year period (Bradley and Duffy,
1982). One of the most limiting aspects of currently available host resistance is the highly
specific nature of the interaction. For example, resistance in tobacco is conferred by a single
gene (rk), resulting in a hypersensitive response at feeding site initiation when infected by
races 1 or 3 of Meloidogyne incognita (Sasser, 1980; Slana and Stavely, 1981) but is not
effective against other races of M. incognita or against any other Meloidogyne species.
Tomato plants carrying the Mi gene are resistant to M. arenaria, M. incognita, and M.
of an interspecific hybridization between Lycopersiconesculentum and L. peruvianum
(Watts, 1947). In both of these cases, a hypersensitive response accompanies resistance
(Kiraly, 1980). In other crop species, resistance to RKN is generally limited to a single
species (Triantaphyllou, 1987). The lack of broad spectrum resistance to the major plant
parasitic nematode species has complicated the development of integrated management
strategies that do not rely upon chemicals.
Other clues to developing RKN resistant cultivars can be found by examining the
mechanisms RKN uses to elicit the changes in host cells. RKN have hollow, protrusible
stylets that are connected to three esophageal gland cells and there is some evidence that
these gland cells express products that are secreted into the plant apoplast through the
stylet. Some gene products that are secreted in Meloidogyne spp. are cellulases, pectate
lyases, and polyglacturonases, and are theorized to function in cell-wall degradation. Other
endoparasitic nematode species have been reported to secrete similar enzymes for
maceration of host tissue (Daubert and Rohde, 1971). Additional secretion products from
RKN, such as chorismate mutase and thioredoxin peroxidase, may function by altering
auxin balance (affecting the formation of giant cells) and the breakdown of host defenses
respectively. One interesting point is that no nematode secretion has yet to be demonstrated
to be secreted or injected into the symplastic tissue of the host. The secretions appear to be
limited to the extracellular spaces, and no definitive roles for nematode secretions in feeding
site induction or maintenance have yet been demonstrated. Williamson and Gleason (2003)
provide a review of these and other nematode secretions.
Analysis of RKN gene expression during infection is not nearly as developed as the
analysis of plant gene expression. Examination of EST libraries from M. incognita (McCarter
et al., 2003) and a comparison ESTs between RKN and free living nematodes (Mitreva et
al., 2005) are the only analyses to date that attempt to use nematode transcripts to
profile through the use of microarrays may provide very valuable information as to what
genes are used when RKN initiates feeding sites and what genes are differentially
expressed as the nematode’s life cycle progresses. Because I performed a comprehensive
analysis of gene expression in susceptible and resistant tomato cultivars infected by two
species of root-knot nematode, M. incognita and M. hapla, I was able to examine nematode
transcriptional profiles during the infection process using the same materials. I examined
both the first 72 hours of the infection cycle and also at reproductive maturity of the
nematode.
I initiated a microarray experiment using a unique, defined set of tomato genes known to
be expressed in tomato root tissue and a small, arbitrarily chosen set of nematode genes to
address global differentiation in gene expression in both tomato and nematode during RKN
compatible and resistant interactions. Transcript abundance was compared at three time
points over the first 72 hours after RKN inoculation and at the reproductive stage of RKN in
susceptible and resistant plants. Two near-isogenic varieties of tomato plants were utilized
to determine difference in gene expression between RKN-infected resistant and susceptible
hosts. Motelle and Moneymaker differ, for practical purposes, only in that Motelle contains a
small introgressed region of DNA containing the Mi gene which confers resistance to M.
incognita, but not M. hapla. Moneymaker is susceptible to both species of nematodes.
Virulence of M. hapla on tomatoes carrying the Mi gene could be due to lack of or
modification to the nematode gene product whose presence signals the Mi gene.
Conversely, virulence could be due to a gene product gain of function enabling the
nematode to circumvent the host resistance response. In either case, the approach M. hapla
uses to initiate feeding sites the same between the two species may or may not be the same
as M. ingcognita. While I don’t predict the difference in feeding site initiation to be large
to being able to infect a resistant plant, might yield a different profile in gene expression in
both nematode and tomato during infection.
This is the first time that a microarray analysis has been employed to establish host
responses to nematodes in a natural host. It is also the first time transcript expression
comparisons have been made in the very early time frame following infection and therefore
gives the first comprehensive glimpse at gene expression during initiation of giant cells and
during the resistant response. This is also the first time that microarrays have been used to
probe the differences in gene expression in the nematode during RKN infection. The goal of
this experiment was to determine if nematode transcripts could be detected if infected root
material is used (as opposed to dissecting the nematode out of the root first). It was not only
established that nematode expressed genes could be detected, but differential gene
expression between early time points could be detected as well.
In this dissertation, I report on the application of looped designs (Churchill, 2002) to
assay regulated genes on microarrays. These experiments were designed to maximize
gene expression data from many different tissues while minimizing time and resources to
look at the global changes in gene expression between susceptible and resistant reactions
to root-knot nematodes. In addition to the microarray analyses, I have analyzed, annotated,
and profiled the expression of the giant cell library first constructed in 1994 (Wilson and Bird,
1994). The results reported here validate the gene discovery from this library, and expand
our knowledge of both host and nematode genes regulated during a sophisticated parasitic
interaction.
A thorough understanding of control of gene expression in the nematode feeding site
is very important for designing and testing genetically engineered resistance, enhancing
existing resistance, and for the development of new resistant strategies (Bird, 1996; Bird
and Koltai, 2000). Giant cells are remarkably similar in very different plant species and this
and differentiation. The study of plant development and cell biology is of critical importance
for the continued improvement of crop species. In addition, a basic understanding of plant
development can lead to broad improvements in plant breeding programs, yield
improvement, and general stress management. These are all critical areas given that food
production is significantly lagging behind population growth in many developing areas of the
Chapter 2: Profiling the Giant Cell Transcriptome*
Jennifer E. Schaff and David Mck. Bird
BACKGROUND
Determining transcriptional profile differences between giant cells and healthy root cells
has been a goal of nematologists and plant biologists for many years. From a nematologist’s
perspective, defining genes necessary to initiate and maintain these giant cells could
provide potential candidates for gene silencing studies aimed at preventing the nematode
from starting the cellular changes needed for feeding site formation or stopping the
development of the giant cells. Elucidating a transcript profile of these aberrant tissues is
also attractive to plant biologists who can use the information to infer how these genetic
changes relate to tissue development and design experiments to test those theories.
To attain an expression profile of giant cells, Wilson et al., (1994) created a subtractive
cDNA library that captured transcripts up-regulated in giant cells compared to uninfected
tomato root tissue. Over 280 cDNA transcripts were cloned and sequenced and initial
annotation of 58 of these genes revealed only 4 that were very similar to other genes in the
NCBI (National Center for Biotechnology Information) database at the time (Bird and Wilson,
1994). As online sequence analysis tools became more readily available and databases
grew, clustering and annotation efforts by Bird’s laboratory revealed a total of 186 distinct
genes from the 280 clones. Yet with all the information now available, nearly one third of
these genes are still not similar to any known genes in these databases.
In this chapter, I describe the annotation of the giant cell library and how I used The
Institute for Genomic Research (TIGR) Lycopersicum esculentum Gene Index (LeGI) to
profile the expression of these genes. TIGR databases are a collection of indexes of
expressed sequence transcript (EST) libraries from various plant and animal species. In the
tomato gene index, (release 7.1), LeGI has accumulated 131,988 ESTs from multiple
libraries and clustered them into Tentative Consensus sequences (TCs) that represent
and illustrates which clones from which tissue libraries contributed to the final gene
sequence. Genes that do not fit into clusters are called singletons.
By BLASTing and comparing each of the giant cell sequences to TCs and singletons in
the LeGI tomato database and I was able to assign many giant cell transcripts to genes
(TCs). Whole gene sequences were then used in subsequent analysis which aided in
annotation. Giant cell genes were further analyzed by looking at other tissues each gene
was known to be expressed in and an expression profile was built that can be sorted by
expression in different tissues. For example, we can quickly sort the profile to identify genes
known to be expressed in giant cells and in tissue infected with Pseudomonas syringae, and
rapidly ascertain what other tissues this gene is known to be expressed in. Determining
expression profiles of giant cell genes may lead to a greater understanding of the roles
these genes play in giant cell formation and maintenance.
RESULTS
Half of giant cell transcripts have no known function.
To determine the identity and verify prior annotation of the 186 giant cell library genes
previously identified as being up-regulated in giant cells, each gene was BLASTed against
the Lycopersicum esculentum Gene Index (LeGI) and NCBI databases. Nearly one third of
the transcripts found in the subtractive library have unknown function and are not similar to
any genes or proteins, nor any other genomic sequences found in the databases (Table
2.1). Thirty of the giant cell genes have similar, very similar, or orthologous (based on
translated amino acid comparisons, see below) identity to other genes or sequences in the
databases that are unknown, hypothetical or are just simply annotated as ‘expressed.’ In all,
nearly half of the genes found by subtractive cloning to be up-regulated in giant cells have
Approximately 25% of the genes have high similarity (over 90% identical at the amino
acid level) to tomato genes or to genes from other species and are categorized respectively
as tomato or orthologous genes in Table 2.1. Giant cell gene DB#216 (Genbank accession
number (GB) L24030) is over 99% identical to the tomato gene ELI3, known to be involved
in a defense response in parsley, and is therefore considered to be ELI3. Several genes
related to water channel proteins, including a gene homologous to the tobacco gene RB7
(Bird and Wilson, 1994), and a cellulose synthase related gene are also found in the giant
cell library. These and other annotations for the 186 genes are reported in Table 2.1.
Annotations for all 280 clones picked for the library can be found in supplementary material
Table S2.1.
Another 25% of the genes are annotated as being similar or very similar to other genes
found in the databases. Genes categorized as very similar are over 70% identical (on the
amino acid level) but are less than 90% identical to tomato or other species gene
sequences. Genes categorized as similar have over 50% amino acids in common over long
sequence matches, or have short, nearly exact matches to other genes. Genes in these
categories include a putative collagenase, a peroxidase, and a cyclin-specific ubiquitin
carrier protein. Also noteworthy from this category is giant cell gene DB#364 (GB AI637345)
that is very similar to genes in a resistance gene cluster in Solanum tuberosum, (van der
Vossen, 2000).
Expression profiles of giant cell genes reveal many are expressed in other tissues
In order to ascertain if genes up-regulated in giant cells are expressed in other tissues,
each of the giant cell genes was queried against LeGI. Nearly 29% of genes did not match
any tentative consensus sequences (TC) and are considered to be singletons. The
remaining 71% of the genes matched to a TC, with some containing as few as one other
EST (e.g., DB#157 in TC122466) to as many as 477 other ESTs, as was the case for the
Table S2.2 (full table in supplementary material) list the giant cell gene (and the
corresponding Genbank accession number) that match a LeGI TC.
Expression profiling reveals giant cell genes are the most transcriptionally similar to
meristems
To establish if there is transcriptional conservation between giant cells and other plant
tissue, expression profiles of giant cell genes were further analyzed. Each giant cell gene
that matched to a TC was scored for presence or absence (as 0 or 1) in 18 of the TIGR
tomato libraries. The series of 0s and 1s for each gene were then strung together, resulting
in a chain, or string, of data. A neighbor-joining technique and pairwise distance estimates
were applied to the data and used to cluster the giant cell and the other 18 libraries. Results
from this analysis suggest that, based on transcriptional profiles, giant cell tissue most
closely resembles meristematic tissue (Figure 2.1).
Color-coded expression profile allows easy identification of gene groups
To further investigate expression profiles of the giant cell genes, each giant cell TC was
examined to determine how abundantly this gene was expressed in other tomato tissues.
For each giant cell gene that belonged to a TC, the number of ESTs from each of the other
18 tomato libraries making up that TC were counted and conveyed as a percentage of that
library. Data were partitioned into 7 categories, based on abundance of EST expression in a
particular tissue library, and then color coded for visualization. A portion of this table is
presented herein (Table 2.2) and a full, sortable table is included in the supplementary
material, Table S2.2. For example, giant cell gene DB#107, a gene very similar to a tobacco
peroxidase, clusters with the LeGI gene sequence TC124803. ESTs from callus tissue,
nutrient deficient roots, and other tissues also make up this consensus gene sequence.
Over 0.3% of all callus ESTs make up this gene sequence which places it in category 7, and
Visualization of transcript abundance in the expression profile also allows for fast
identification of genes that are ubiquitously expressed throughout plant tissue and how
profuse the transcripts are. For example, transcripts from DB#274 (ubiquitin carrier protein)
and DB#141 (see above) have been found in nearly every plant tissue, but transcripts from
DB#141 are much more abundant (Table 2.2, S2.2). Conversely, this expression profile also
allows for easy identification of genes that appear to be rarely expressed, such as DB#147
(a eukaryotic translation initiation factor).
The color coded expression profile can also be sorted by tissues of interest. For instance,
DB#312 (a WRKY transcription factor) is expressed in tissue susceptible to and infected with
Pseudomonas syringae, but is not expressed in tissue resistant to and infected with the
same pathogen. Sorting of this profile also reveals a number of genes that are known to be
expressed in a P. syringae resistant response, but not in the susceptible one, such as
DB#155 (a gene with unknown function). These genes are interesting because they are
expressed in successful disease state of one pathogen and expressed in the resistant state
of another (Table 2.2, S2.2).
Finally, this profile can also be used to track the changes of gene expression in tissue as
it matures. DB#297 (another gene with unknown function) is expressed in ovary tissue, and
all fruit tissue, from the developing/immature fruit through the breaker fruit stage. This gene
shows a peak of expression during the developing and mature green fruit stage, then
expression tapers off as the fruit ripens.
Nearly one third of giant cell genes are novel
Approximately 24% of the genes do not match to any annotated genes or sequences in
either of the databases, nor did they fit into any cluster. Forty-four genes with unknown
function did not fit into any TCs, and 4 genes in each of the annotation categories similar
and very similar also did not match to any TC. All of the genes that were annotated as being
DISSCUSSION
Giant cells are a unique plant cell type, not found in the absence of nematodes. Investigating how gene expression differs between giant cells and healthy root cells by
comparing transcripts and transcript profiles can lead to important insights both in the
biology of how these feeding sites are created and maintained, and how the changes in
expression of these genes can cause such dramatic alterations to the morphology and
physiology of the cells.
Annotation of giant cell transcripts is supported in the literature
Transcripts in the subtractive cDNA library are, by means of constructing the library,
up-regulated in giant cells. Because this library was constructed from dissected giant cells, it
gives one of the first clear glimpses of plant gene expression during RKN pathogenesis.
Sequences obtained from the up-regulated transcripts were queried against NCBI in order to
annotate them and potentially identify their functions during normal plant development. I was
able to describe 142 distinct genes based on sequence and translated sequence similarity
and homology to genes found in databases. There are genes in the giant cell library that
represent nearly every category of genes that are known or suspected to be involved in the
giant cell establishment or maintenance, based on previously reported work and theoretical
predictions (Bird, 1996; Gheyson and Fenoll 2002; Williamson and Gleason, 2003)
Categories in which there are representatives in the giant cell library include genes related
to cell cycle regulation (DB#169 is similar to a cyclin-specific ubiquitin carrier protein in A.
thaliana), cell wall synthesis (DB#385 is orthologous to a cellulose synthase related gene in
Arabidopsis thaliana), and transporters (DB#346 is LeOPT1, a gene involved in membrane
and transformation function).
It has been shown that general, nonspecific plant defense genes are up-regulated
approximately 12 hours after RKN infection (Williamson and Hussey, 1996; Williamson et
(Schmelzer et al., 1989) is also up-regulated in the developing giant cell. DB#364 is very
similar to genes in a potato resistance gene cluster (van der Vossen, 2000). Significantly,
however, the full defense response does not occur suggesting either active suppression or
lack of the proper signal from the nematode. In other words, although some defense genes
are up-regulated during a compatible response, the susceptible host lacks the key
recognition component(s) to enable a full defense response and manifestation of resistance.
At least three water channel genes were found in the subtractive giant cell library,
including a gene orthologous to Nicotiana tabacum RB7. Water channel proteins and RB7 in
particular have been implicated in giant cells before (Opperman et al., 1994). Osmotic
regulation is especially critical to cells as metabolically active as giant cells and it is logical to
find genes associated with water channels highly expressed. Giant cells are physiologically
isolated from the rest of the root by loss of plasmodesmatal connections and exist as islands
for the nematode to feed from, without communication with their neighboring cells. Because
the central vacuole is also diminished in giant cells, osmotic exchange is especially critical to
avoid plasmolysis and toxicity. Water import is critical to solubilize ionic compounds and to
dilute metabolic waste products. It is unlikely that giant cells could be maintained without a
higher rate of exchange.
The presence of transcripts in the giant cell expression profile encoding tomato cystatin
came as a surprise. Urwin et al., (1997) proposed that an oryza cystatin gene be used in
genetic plant transformations aimed at repressing reproduction in feeding nematodes. They
suggested that ingestion of transgenically-expressed cystatin prevents nematodes from
digesting proteins, and reported that nematodes feeding from transgenic Arabidopsis
constitutively expressing a modified rice cystatin (Oc-1∆86) are malnourished, develop
slowly, and produce fewer eggs. They detected Oc-1∆86 from ground up females with an
anti- Oc-1∆86 polyclonal antibody and they revealed repressed expression of cysteine
suppressed growth in the nematode. (Atkinson et al., 2003; Urwin et al., 1996). However,
over expression of this gene in plant tissue might have some effect on other plant molecules
necessary for proper nematode feeding, therefore suggesting that it may not be in the
ingestion of cystatin that suppresses growth and brood size, but other factors associated
with metabolites in the plant. It seems that an altered (transgenically over-expressed)
abundance of cystatin proteins may adversely affect the nematode life cycle, but it is
apparent, by the fact it is up-regulated in giant cells, that at normally expressed levels this
gene must not negatively affect reproduction of RKN.
Our finding that giant cells resemble meristematic tissue more than any of the other 18
tissues in the LeGI database is consistent with a model that proposed giant cells are
established through the recruitment of pathways in the host that are normally utilized during
plant development (Bird, 1996). Various lines of evidence point to some of those pathways
as being in common with those required for meristem induction/function. Indeed, giant cells
have been described as being reminiscent of active meristematic cells (Huang, 1985). Like
meristem cells, giant cells are metabolically very active and have an abundance of golgi
apparatus, mitochondria, ribosomes and endoplasmic reticulum. These data are also
supported by in-situ RT-PCR experiments in which a number of genes have been confirmed
to be expressed both in giant cells and various meristems (Koltai et al., 2001). Included in
this list is Le-phan (Thiery et al., 1999) which is a member of the myb-family of transcription
regulators, and was originally identified in the giant cell library as DB#280 (Table 2.1).
Because the giant cells appear to be closely similar to meristems, it is an intriguing
possibility that the tissue is held in a juvenile state and may be suspended in a proliferative
developmental cycle rather than a maturation one. In other words, the cells may be stuck in
a repeating cycle of early differentiation without development, controlled by the nematode.
This may also explain why the nematode tends to form giant cells in undifferentiated tissue
been made. In essence, the nematode preferentially uses undifferentiated cells (much like
stem cells in animals) because they are pluripotent and are thus amenable to manipulation.
In addition to influencing genes with known function in meristems, it is clear that RKN
induce novel sets of genes that could include pathways yet to be identified and
characterized in plant development or other plant processes. Fifty-two (28%) of the giant
cells genes do not match to any other cluster in LeGI and are considered novel genes or
singletons. Of these 52 genes, 44 are not similar (based on sequence analysis) to anything
else in the NCBI databases and are therefore described as having unknown function. In all,
nearly 25% of these genes do not match to a sequence cluster or to any other sequence in
NCBI. Because parasitic organisms that initiate genetic changes in their host plants have to
work with existing machinery, it is likely that these novel sets of genes are needed at some
point somewhere else in the plant during the normal life cycle. The key to unlocking this
mystery is finding when these genes are expressed in the absence of nematodes. Further
investigation of existing sequence may reveal protein motifs or gene ontology (GO)
annotations that could explain the nature and function of these genes. In situ hybridizations
may also reveal a temporal or spatial expression pattern hitherto observed. It is clear from
these studies, though, that much remains to be discovered regarding normal plant
developmental pathways.
Although subject to sampling bias, the abundance of ESTs in a TC is an approximation
of that gene’s transcript level in the tissue used to make that library. To better visualize
differences between libraries, we extracted and color-coded abundance information into a
spread sheet (Table 2.2). A sortable version of this table is included in supplementary
material, Table S2.2. The ability to electronically sort this data can provide insight into how
sets of genes are expressed in different tissues. The results reported herein may provide
whole, these data provide a wealth of information to anyone interested in plant development
and response to pathogen attack.
MATERIALS AND METHODS
Sequencing the Giant Cell Library
Clones in the giant cell subtractive library were initially sequenced by hand (Bird and
Wilson, 1994) and submitted to GenBank prior to establishment of dbEST. These
submissions have accession numbers L23860, L24001-69, L24101, L24107-11, and
L26982-83. For clones in which there remained some ambiguity, plasmids were
re-sequenced using automated technology and sequences submitted to dbEST with accession
numbers AI637265- 392 and BM153839-85.
Giant Cell Annotation
Giant cell sequences were BLASTed against the TIGR tomato database (v7.1) and NCBI
databases using both BLASTn and BLASTx against the NR database. Giant cell genes with
blast hits that were nearly identical (over 95% identity) to known tomato genes were labeled
as that tomato gene. GIANT CELL genes with nearly exact matches (over 90% identical
amino acids) to genes in other species were called ‘orthologous’. GIANT CELL genes with
high similarity (over 70% identical amino acids) to other known genes, tomato or other
species were classified as being very similar and genes with broad similarity (at least 50%
identical amino acids) or short, nearly exact matches to known genes in the databases were
categorized as just ‘similar’. GIANT CELL genes that were not similar to anything in the
databases were labeled as unknown.
Color coded expression matrix
Sequences of novel genes were BLASTed against the TIGR LeGI database, and in cases
in which TIGR had incorporated a giant cell EST into the LeGI database (based on its
visually confirmed for accuracy. Giant cell sequences not already clustered into a LeGI TC,
such as those submitted to the NCBI NR database, were BLASTed against the LeGI
database and top sequence alignments visually inspected. Nearly every query resulted in an
excellent match to a TC (which was then linked to that EST) or resulted in none or very poor
matches to database TCs. Giant cell genes that did not match or were poorly matched to a
TC labed as ‘no cluster’ (nc) in Table 2.1.
For each TC associated with a giant cell, the number of contributing ESTs from each
other EST library were counted and tallied as a percentage of that library. To enhance easy
visualization, data was color coded for each gene based on percent abundance from each
library as follows: if for a particular gene, ESTs representing that gene consisted of more
than 0.030% of total ESTs from that tissue library, the cell was color coded red. ESTs
representing 0.025-0.029% = orange, 0.020-0.024% = yellow, 0.015-0.019% = green,
0.010-0.014% = blue, 0.005-0.009% = purple, 0.001-0.004% = grey and less than 0.001% = no
color.
Comparison of tomato tissue using EST abundance
Data in colored cells of the matrix were transformed into numerical data by assigning a
seven digit string of 0s and 1s based on the percent abundance of gene in each tissue type.
For example, a red cell, representing a tissue with a gene in high abundance in a particular
tissue, was assigned a 1111111, while grey cell, representing a tissue with a gene in low
abundance, was assigned 0000001, so that the final result was a table that reflected the
color coded data with a strings of numbers. These numbers were strung together for each
tissue type. Phylip (Falsenstein, 1993) was used to apply a neighbor-joining technique
(Saitou and Nei, 1987) and pairwise distance estimates were used to cluster the libraries.
LITERATURE CITED
TABLES
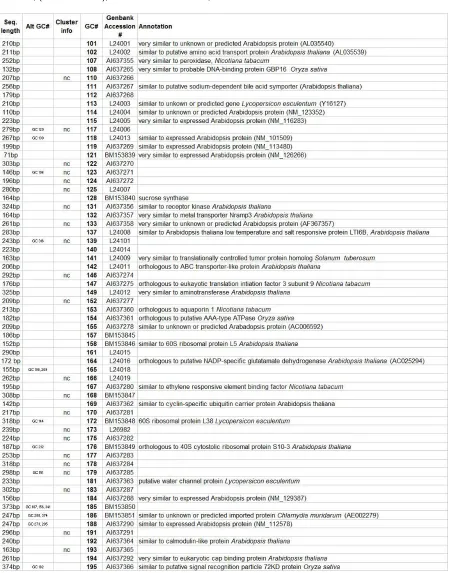
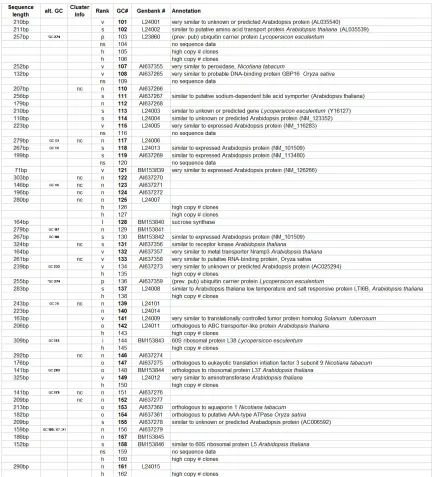
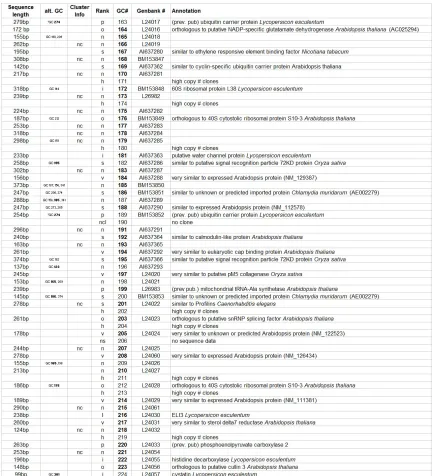
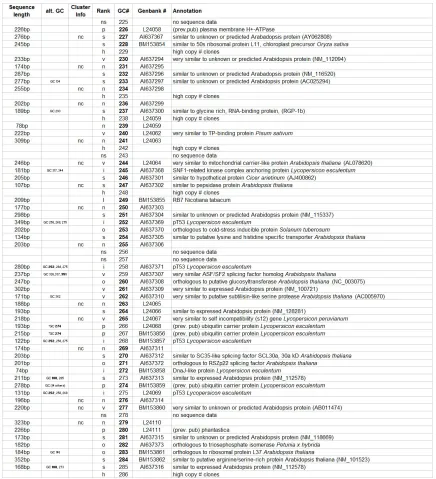
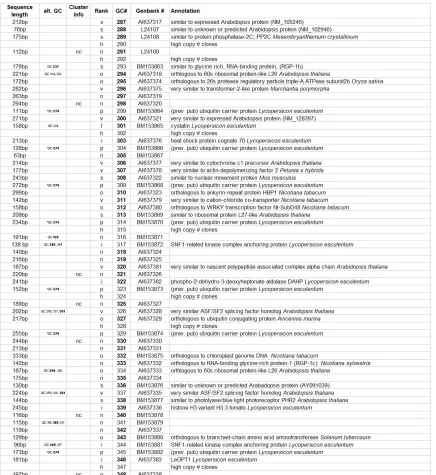
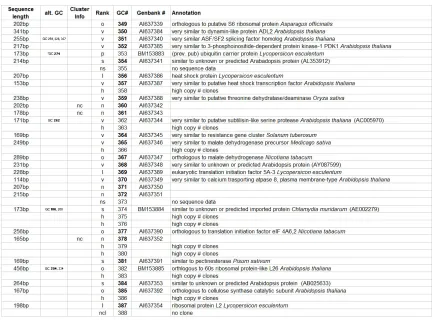
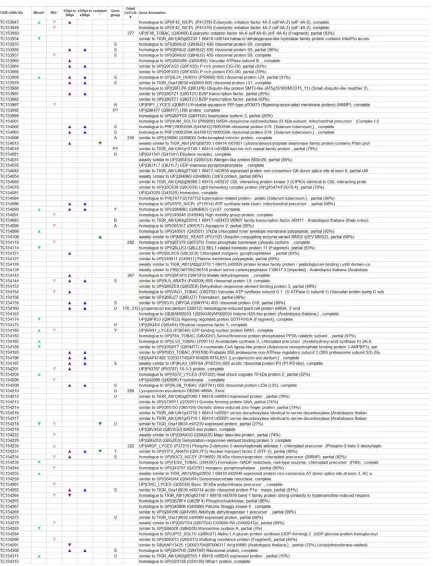
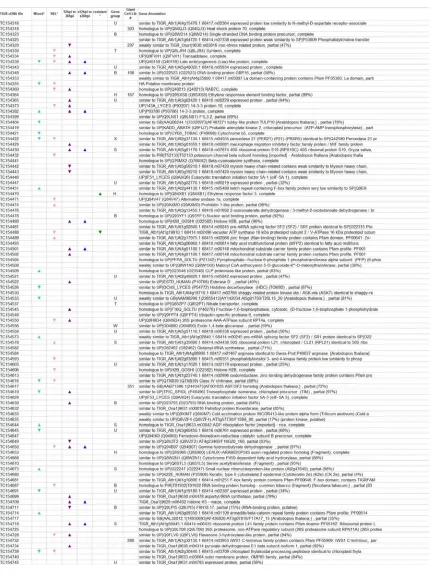
Table 1: Annotation of 186 distinct giant cell genes. Seq. length = clone sequence length; alt GC# = other GC#s that are the same gene, Cluster info = nc, no TIGR cluster determined for gene. Rank: I = Identical, o = Ortholoug, vs = very similar, s = similar, n = no known function. GC # = giant cell
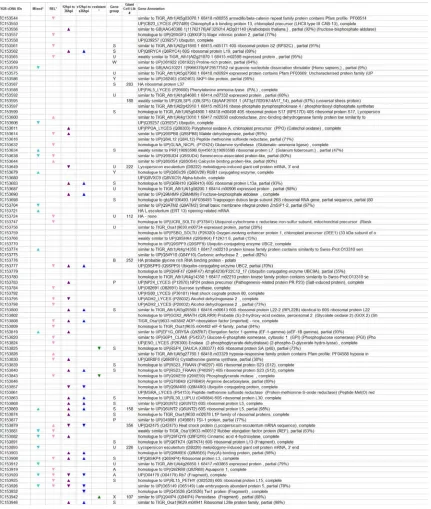
Table 2.2: Color coded matrix (a subset of Table S2.2). Matrix reveals expression profile of giant cell genes in other tomato tissues. TIGR gene clusters for each giant cell gene were examined for transcript abundance in other libraries. ESTs from other libraries were tallied and expressed as a percentage of that library, then color coded for easy visualization. For example, the TIGR cluster in which giant cell gene 249 is a part of also contains a number of transcripts from a callus (cal) library. This table has been sorted to identify genes that are regulated in common between the giant cell library and libraries made from susceptible and resistant tomato material infected with
Psuedomonas syringae. GC# = number of giant cell clone and the corresponding Genbank Accession number. cg = crown gall; ndr = nutrient deficient roots; rfs = roots at fruit set; rpa = roots, plant at pre-anthesis; sus = tomato tissue susceptible to and challenged with
Pseudomonas syringae; res = tomato tissue resistant to and challenged with P. syringae; cal = callus; sc-u = suspension culture, untreated; ov = ovary tissue; d/ig = developing, immature green fruit; mg = mature green fruit; frr = red ripe fruit; bf = breaker fruit; mix = mixed elicitor; s/m = shoot and meristem tissue; erad = etiolated radical; gs = germinating seedlings; gc = giant cells
SUPPLEMENTAL TABLES
These tables can be found in the appendix.
Table S2.1: Annotation of all giant cell genes.
Table S2.2: Table S2.2: Color coded matrix. Matrix reveals expression profile of giant cell genes in other tomato tissues. TIGR gene clusters for each giant cell gene were examined for transcript abundance in other libraries. ESTs from other libraries were tallied and expressed as a
FIGURES
Chapter 3: Comprehensive transcriptome profiling in tomato
reveals a role for glycosyltransferase in
Mi
-mediated nematode
resistance.*
Jennifer E. Schaff, Dahlia M. Nielsen, Chris P. Smith, Elizabeth H. Scholl, and David Mck. Bird
INTRODUCTION
Root-knot-nematodes (RKN: Meloidogyne spp) are obligate parasites of essentially all
vascular plants and negatively impact production of most crops (Sasser, 1980). Central to the
parasitic interaction is the ability of the nematode to reprogram root parenchyma cells to
differentiate into highly specialized feeding cells called giant cells (GC). Infective RKN juveniles
(J2) hatch in the soil, mechanically penetrate the root in the zone of elongation and migrate
inter-cellularly to the stele. Migration is accompanied by secretion of cell wall modifying
enzymes from the nematode stylet (Bird et al., 1975; Wyss et al., 1992; Smant et al., 1998) and
it has long been hypothesized that the primary inductive signal for GC formation also involves
stylet secretions (Christie, 1936). Numerous candidate molecules have been proposed (Davis
and Mitchum, 2005), and recent evidence points to a role for a molecule with functional
similarities to rhizobial Nod factor as the initial RKN–plant signal (Weerasinghe et al., 2005).
Each individual J2 induces up to ten metabolically active GC, which become strong nutrient
sinks (Jones and Northcote, 1972; Bird, 1975; McClure, 1977) and serve as the sole food
source for the developing nematode. Depending on the RKN species, cortical tissue
surrounding the GC exhibits hyperplasia and hypertrophy, leading to the stereotypic root-knot
galls. Resistance to RKN has been identified in a number of plant species, and, in some cases,
the responsible loci identified. The best understood of these is the tomato Mi gene (Watts, 1947;
Milligan et al., 1998; Williamson and Kumar, 2006), which conditions resistance to M. incognita
and M. javanica (but not to M. hapla) and has been widely bred into commercial tomato varieties
(Gilbert and McGuire, 1956).
Various approaches, including construction of subtractive cDNA libraries from individual GC
(Wilson et al., 1994), promoter trapping strategies (Sijmons et al., 1994; Barthels et al, 1997;
Favery et al., 2004) and in situ hybridizations (Lohar et al., 2004; Gal et al., 2006), have
examined gene expression patterns during nematode feeding site initiation. Collectively, these
Almeida-Engler et al., 1999), cell wall synthesis (Niebel et al., 1993; Goellner et al., 2001; Vercauteren et
al., 2002) and transcription regulation (Bird and Wilson, 1994) are up-regulated in GCs.
Gheysen and Fenoll (2002) provide a detailed review of the approximately 50 genes known to
be up-regulated and a few that are repressed. One emerging picture is that GC share many
features with rhizobial nodules, including co-expression of specific transcription regulators
(Koltai and Bird, 2000), early nodulation genes (Bird, 1996; Koltai et al., 2001; Favery et al.,
2002) and cytokinin responsive genes (Lohar et al., 2004); genetic data reinforce these
similarities (Bird, 2004; Weerasinghe et al., 2005). Numerous putative defense genes also are
up-regulated during RKN infection, including peroxidases, chitinases, extensins and proteinase
inhibitors, perhaps as a global response to pathogen invasion. Callose or lignin may also be
deposited as a physical barrier along the cell wall (Balhadère and Evans, 1995).
Recently, two laboratories used microarrays to examine changes in Arabidopsis gene
expression responsive to RKN infection. Based on the hypothesis that GCs are transfer cells
(Jones and Northcote, 1972), Hammes et al. (2005) examined expression of transporter genes
in RKN-infected and healthy root tissue at weekly intervals and established that multiple
transport processes are regulated, some in GCs, and others in un-infected areas of the root.
Another study (Jammes et al., 2005) interrogated GC-enriched root tissue, establishing that as
many genes are repressed as are up-regulated upon nematode infection. They further
substantiated that successful RKN infection is associated with suppression of a number of plant
defenses.
Although there is a strong correlation between water uptake and RKN inoculum (Meon et al.,
1978), suggesting that much of the yield loss caused by RKN can be attributed to compromised
root function, it is clear that RKN infection also modulates whole plant physiology, including
photosynthesis depression (Loveys and Bird, 1973; Wallace, 1974) and alteration of respiration
rates both in root and shoot (Myuge, 1956; Owens and Rubinstein, 1966). Various lines of
et al., 1998; Hutangura et al., 1999; Karczmarek et al., 2004; Lohar et al., 2004) as part of the
regulation of root architecture. Thus, rather than focus on gene expression in GC per se, we
designed experiments to interrogate genes representative of the broader tomato root
transcriptome during compatible and incompatible interactions with RKN. Time points were
chosen to capture the host gene response to key aspects of the RKN lifecycle in susceptible
and resistant tomato iso-lines (Solanum lycopersicum (Linnaeus 1753) cv Moneymaker and cv
Motelle respectively) infected with either M. hapla or M. incognita.
Based on a mixed model analysis (Wolfinger, 2001), we found that in the absence of RKN
only one gene, encoding a glycosyltransferase, was found to be differentially regulated between
the Moneymaker and Motelle transcriptomes. However, RKN infection of the susceptible host
elicits expression changes in large numbers of genes, and the expression of these genes
fluctuates substantially over the first 72 hours post infection. Suites of genes exhibit coordinated
expression in distinct patterns. We identified 58 genes that are significantly regulated during the
unsuccessful attempt by RKN to infect resistant plants, including strong up-regulation of the
glycosyltransferase gene. Experimental down regulation of this gene via virus induced gene
silencing restores susceptibility to M. incognita in Motelle, indicating that this function is
necessary for Mi-mediated resistance. Glycosyltransferases have been implicated in
carbohydrate biosynthesis and associated in plant stress and defense responses (Dixon, 2001;
Qi et al., 2005; Vogt and Jones, 2000) and cell wall synthesis (Egelund et al., 1994; Lao et al.,
2004); this is the first report of a role for a glycosyltransferase in nematode resistance.
RESULTS
cDNA Microarray Construction and Annotation
At the time we initiated this study, the most comprehensive source of tomato gene sequences
(TC) sequences (corresponding to gene predictions) by The Institute for Genomic Research
(TIGR: Rockville, MD). Because RKN is a root pathogen we selected ESTs obtained from root
cDNA libraries for array construction. A complete list of the genes used, along with their identity,
is given in Table S3.1. For nomenclature and annotation uniformity, if a sequence had a match to
a TC, that information was retained. Each clone without a match to a TC (e.g., a singleton) was
named according to its GenBank accession number and individually hand annotated. For the
small number of sequences for which some ambiguity remained, the clone name was retained.
To further categorize the genes, we queried the TIGR and GeneBank annotation files with a set
of key words (Table S3.2) related to various biological functions we hypothesize might be
germane to the RKN–plant interaction (Table 3.1). For example, all genes associated with
hormone or hormone regulation were grouped into a category called ‘Hormone,’ and each gene
that fell into this category was then tagged with the letter ‘H.’ Second, the Gene Ontology (GO:
http://www.geneontology.org) identifier for each was traced to the identifier category immediately
below the head ontology category in the hierarchy and tallied (Fig. 1). Protein motifs were
identified by HMM and Interproscan (Zdobnov and Apweiler, 2001) queries (supplementary
Table S3.3). Motif names were manually curated to find groups of genes with functions
corresponding to the list in Table 3.I and correlated with genes that showed differential
expression in the various array experiments (vide infra). Key findings are summarized in Table
3.2.
Resistant and Compatible Tomato Roots Have Near Equivalent Transcriptomes in the
Absence of RKN
‘Moneymaker’ and ‘Motelle’ differ for practical purposes by the presence of Mi in the latter.
Because other genetic differences between the cultivars may lead to different transcription
profiles, possibly confounding analysis of gene expression changes in response to RKN, we
compared the transcriptome of each of the cultivars in the absence of nematodes. Similarly,