Development of a Robust llybrid Estimator using Partial Least Squares Regression
and Arfifrcial Neural Networks
Arshad Ahmadr
Lim Wan Piang'
' IAboratory of Prccess Control, Departnent of Chenical Engineefing, Faculu of Chemical and NaturuI Resources Eneineering, Universiti Teknologi Malatsia, 81310 Skudai, Joho.
Malaysi-Tel: +60-7-5 53.56 I 0, Far: +60-7-558- I 463, E-nail: [email protected])
' Laboratory of Process Control, Depatnent of Chemical Enqineein|, Facult-l of Chenical a d Natural Resources ' Engineering, Uniyetiti Teknologi Mal1ysia, I 13 I0 Skudti, Johor, Malaysia
TeI: +60-7 -55 3-5858, E-nnil: [email protected]
Abstract
Measurement difrculry is one of the process contrcl issues atising frcm the conpleity and the lack of on-lirc neasurenent devices. One of the ake at e solutions to deal with this problem is infercnlial estimation where secondary variables, such as temperature ancl pressure are used to prcdict the unmeasurcd pinary variables that arc nahlt product qualities. mis paper presents the estination of ptoduct conposhions for a fatry acid fructioMtion colunn using a hybnd kchnique. The proposed technique combines paftial least squares r.srcssion (PIS) utd artifcial neural netwotks (ANN) in an estination paradiqm to provide better estinntion prcpenies. The aim js to take odvantaSe of ANN capability to captwe the ntn-linear rclationships as well as the statistical strength of PIS method. The rcsults of prccess estination usine both PI.s and htbrid nethoh arc presented- The signifcant imprcvement obtained by the htbrid strciegt re|ealed its capabilitt as a potentially riable estimator for prodtlct properties in chenical industry.
Keywords:
Inferential Estimation, Partial l€ast Squares Regression, Artificial Neural Networks, Hybrid Model, Robushess
Introduction
The world (end o[ chemical produclion is now moving lowards tull capacity operation with zero accidents, zero emissions and high profitability. Under this stringent environment, many plants have been forced to revamp their exhting control system. However, Foblems that are related to process dynamic and measuremeni remain largely unsolved, even when advanced control system is in place. Process dynamic issues aie often related to the non"linearity of chemical processes while problems arisiflg from measurement are mainly due to difficulty in implementing on-lin€ measurements. For example, an online gas
780
PraceedinBs al Inkmational ConJeenc. Oa Chenical ahd Bioprccess Ensineerins 2/' 2y AuR6t 2003 , Univenni Molaysia Sab.h, Kata Kinabah
chromatograph, a cornmon instrumentation for the mearurement of product composilions, is not suitable fo. orline application in many cases. This is due to the low sampling rate and occasional result inconsistency. Furthermore, it is not economic ftom the viewpoint of operational and maintenance cost. Due ro rhese difficulries, inferential esaimation has been recommended as one of the altemative solution.
Inferenrial estimation is a strategy ihat employs lhe measuement of secondary Focess outputs such a3 temperatures and pressures, to infer the unmeasurable disturbances on primary process outputs, such as producl compositions l. For example, intermediare tray temperaures are usually being used to predict product compositions in a distillation column. Hence, the main role of the estimator is to predict the pdnary variables using selected secondary vadables. The estimated values are $en fed into the controller for control purloses. For practical implementation, th€ estimator should provide reliable predjction of the unmeasured.
Backgound of Inferential Estimation
Since the development of infercntial conrol in 19?0s, various apprgaches to construct the process €stimator have been widely studied. The fundamental method is ro use lhe inforrnation of the process, such as mass and energy balances, to construct the estimaror. Although this is a reliable and dircct approach, the developmenls of such models aft laborious and knowtedge intensive. For $ese rcasons, researchen have been formulating altemative methods. Most of these methods use rhe input-ourput data and some basic knowledge of the process to develop the process estimator, such as Kalman filtering, sratistical methods and black box modelling methods.
Application of statistical methods in chemical process modelling and control is not new. These methods include linear rcgression (LR), multiple linear re$essions (MLR), principal component regession (PCR), principal componenr analysis (PCA) and partial least square regression (PLS). MLR is among the most widely applied methods in chemical industry for estimation. Recendy, the PLS nethod is also
gaining popularity in this field comparcd with more classical MLR and PCR due to its robustness [2] In process estimalion, the use of PLS was pione€red by Mejdell and Skogestad 13,41. Over the years, they had develoPed the comDosition esdhator usitg PCR and PLS models for a b;na;y disrillation colunin Theestimators, which were based on steady-state data and muitiple lempefature measuremenls, performed well in vadous conditions such as muiti-component mixtures, pressure variations, and nonlinearity. Dealing with the problems of mnlinearity and noise in distillation column, they Foposed the use of 'additional faclors, weighting functions, and logarithmic
Some other researchen had also investigated thd application of PLS in Drocess estimation and con$ol. Budman and co-workers [5] addfessed the development of a robust inferential estimaior for a packed-bed reactor by using PLS model. This estimator was then comparing wjth another estjmator developed by using Kalman filter technique. Results showed that PLS estimator was sjgnificantly more accurate for estimating the actual concentration in a wide range of operating conditions. Another example is the work by Kresta and co-workers [6]. Their estimator, which was designed to estimate the distillatior compositions, had shown good predicdon when dealing with large numbers of hjghly correlated measured variables without over"fitting. They had also proved that the model was more robust io missing data and sensor failures.
The PLS model had been inferior due to its dependency on steady state data and insufficiency when dealing with non-linear system {51. EfTorts to improve this technique in oder !o deat with both dynamc and non-linear Fo€ess had been explored. Dayal & Maccregor [7l Foposed recusive exponentially weighted PLS algorithm to imFove parameter estimation. This newly developed algorithm was tested on a muitivariable CSTR and an industrial mineral floating circuil. In the estimation of distillation compositions, Kano and co-workers [8] canied out a comprehensive study of dynamic PLS to improve the accuracy ofestimation by using simulated tirn€ series data. They concluded that the esiimation of top and bottom column quality based on reflux flow mte, reboiler duty, pressure and multiple tray tempemhrres was much better than th€ usual tray tempemture control system.
Arc$er approach to extend the PLS model in dealing with dynamic and nonlinear system is by hybridising the model with other modelling pamdigm such as artificial neu|al network (ANN). The use of ANN wi6in the PLS rnodelling paradigm and was first recommended by Qin & McAvoy t9l, The capability of ANN model in dealine with non-linear system had inspired the merging of these methodr. Since the rcsults of the NNPLS model were encouraging, some other researchers had also worked on this field to improve the model capabilities, Baffi and co-workers 001 had proposed two extensions models. These were the nodified NNPLS and Iadjal basis function network PLS (RBFPLS). Boih of ihese model employed enor-based input weights updaling procedure !o improve the prediction capability.
ISBN:983-2643-15-5
Pnc.edius ol l.tetwtiual Cdfcrence On Chefticat and Biauoc*s Encineerins 27' - 2y Ausu$ 2AB , anive^ni Malorsia sdbah, rab Kinabalu
Consequendy, Abebiyi & Cotipio [1 l] had also carried out similar investigarion to NNPI-S model. They proposed a dynamic NNPLS (DNNPLS) in which the static neural network models in the inner relationship were replaced by dynamic neuml network models. This approach had been tesled with the data hom a highly ron-linear fluidised catalytic cracking unit and an isothemal r€actor. Results showed that the prediction was as good as a MIMO neural network and it was betier than PLS-ARMA model.
Partial Least Squares Regression
Partial least squares regession is one of the multivariate analysis methods. It is a linear system identification method that projects the input-output data down into a latent space, extracts a number of principal factors with aD orthogonal s&ucture, while capnrring most of the variance in the original data [2]. Derails description of the PLS st$cture can be
The schematic diagam of the PLS model is illustrated in Figurc l. [t consists of two outer relations and an inner relation. The outer rclations are the matrixes of independenr and dependent variabl€s, which can be represented by X and Y, respectively. The inpul X is projected into the latent space by the input-loading facaor, P to obtain the input scores, T. Similarly, the output scores, U is obtained by projecting the output Y inlo lateni space through the outputloading factor, Q. These relations are in matdx form and are written in Equation (l) and (2).
Outer relations: X = TPr + E/ (1)
Y = U Q r + F r
!$s!-&s!
h ' r ' & o i ' a r o h |
Fisure t Schenatic ofthe PIS Model t I I l
The matrices Er and F.r are residuals of X and Y, rcspernvely X and Y arc linked with a linear regression called inner relation to capture the relationship between the inputs and output latent scores. The notation of the inner relation is written in Equation (3).
lnner r€lation: U = TB (3)
The Focedwe of determining the scores and loadings factor is caried out sequentially from the flrst factor to the J'lh factor. Scores and loading rectors for each faclor is calculated from the prcvious residual mairices as shown in Equation (4) and (5), where initially E0 = X and F0 = Y.
(2)
F o r X ,
For Y,
rrJ= r{{tt) + rr
Fr=Frt -r.If
&=&.,-urQi'
(5)
Proceedin.s ol lntematiahat ConJerence On chennal o.d Bioprcce$ En,inerthg 27tu -2q Aug& 2AB, Unive^ni Mokttsio sabah, Kohki&bat;
control of product composirjons is achiered by controlJing tempemture at selected location. However, this control scheme canlot funcrion very welt due to distu$ances in the feed composition. This has qeared some difficulries in the composition contol and at times, off-specificarion products have been produced. In rhis Fojecr, the focus is on the developmenr of a robust inferenriat eslimaror for the light cu1
Light cut column is a packed disrillation colurnn consisting of thiee sections, which are srripping, recriflng and condensing section. This colurm is operaltd under vacuum condition induced by steam ejector. The schernatic diagram of this colurDn is depicted in Figure 3. The feedstock of light cut column is the bottom product from pre-cut column wjth fatty acids ranging from C-10 to C-l8. The intet temperature rs around 220PC at pressufe aiound 6.84 kpa. Disrillare product fmm this colunn is C-12 with around 98 qo, and rhe bottom producrs. which are mainty C,l4 to C- I 8 are then fed !o the next column.
(4\
Caiculation of ihe inner and outer relations is performed unlil th€ lasi factor, /or when residual matrices are below certain threshold.
Hybrid PLS-ANN Model
The hybnd PLS-ANN model is construcred based on tbe NNPLS nodel I9l. As mentioned before, this rechnique incorporated f€edforward oerworks into the PLS modelling, where FFN is used to capture the nonlineariiy in the model while the statisrjcal strength ofPLS is mainrained. The schematic diagram of a NNPLS nodel is depicr,ed in Figure 2. As rnentioned above, a convenrional PLS model consists of outer and inner relations, where both of these relations are represented in linear form. In NNPLS model, the PLS outer relations are kept linear to transform the original data into scorc factors (U and T). On the other hand, neural networks are accomplished in the irner relation as written in Equation (6):
(6)
whe.e r{(, stands for lhe nonlinear relation represented by a neural network. Here, the training dak is rhe score factors generated from the outer relations.
FiEurc 2 A Schenatic lusttution of NNPIS Model [9]
Problem Definition
The aim of this paper is ro develop a robust inferentjal estimator by usjng hybrid PLS-ANN model based on on-line measuements of process variables, such as flow raies and temperatures, For pmclical implementation, the estimator should able to provide accurate prediction, and the model must be robust enough ro delal witb distwbances and changing of operating conditions.
Process Description
The case study considered here is rhe light cut column ofa local fatty acids fractionation plant. At plesent, indirect
782
Figu/e 3 UEht Cut Cotunn in the Fatt, Acids Frucrionation Plant
Dynamic PIatrt Simulation
The dynamic simulation was carried out usins IrySys.planr simulalor. Based on lhe process flo* diagrai provided by a local
'ndusFy. $e lighL cur column model was sel. Here, seven contml loops were activated, These are shown in Figue 3. Simulatior was carried our in both steady state and dynamic modes. Results of the dynamic simulation were compared to the actual data collected from the planr DCS system. MoniLoring and runing of lhe conrol loop \Las cs.rned oul unLil the simulaLion resulrs were in close agreement with the actual data.
Sensitivity Analysis
Since the estimation model was data based, selection of
q
L
t
6
F,
t l
d
#
t
x
aDDroDriale inpul and oulpuL variables is imponant Thus' .insiLiuiry anaiysis ofboth open and closed loop syslem was carried our ro investigare the dynarnic behaviour of process var;ables such as llos rales. liquid level temperarures Drcssure, and producr composidons This was done by imoosine sleps changes Lo vatious processrs inpuL such as r"riroerarures and now mre\' The effects on the process outputs such as Fay temperatures and product compositions were ihen examjned. These responses were used as gurdes Io select appropriate input and output variables that are suitable for model develoPment
A n e x a m D l e o f l h e s e n s i l i v i l ) a n a i v s i s r e s u h s i s s h o w n i n Fisure 4: Here, a 5% increase in the feed tempersure was iniroduced. Results show lhat the-C-I2 mole fraction is droDD€d from about 0.98 to 0935 It means that the feed rempirature has significanl effect on the C-12 mole ftaction. Basio on the rcsults of sensitivity analysis, four input orocess variables had been selected, namely the feed temperature, the top column temperatue, the reflux flow mte and the recycle flow mte. Since tray temperatures had been pmven as the secondary variables that are commonly used in inferential estimation [3,8], four tray temperatures had also been chosen. These variables were then used as inpuls for the inferential.estimator to Fedict the composition of C- 12 falty acid,
Model Development
In,this section, develobment of the infercntial estimator rbased. on both PLS and hybrid PLS'ANN model are 'descnbed. The perfomB ces of these esdmatoa! 8re evaluated.on. the basis of mean squared efior of.ptediction .( 4SE) and the explained prediction variance (EPV) The ' calculadons ofMSE and EPV are show! in Equation ? and 8,
respecnvely:
Fernl.n'rxntns fCl
Pnceediass oJ lnkmatio8l Conf.Eace On Chenicll and Biaptuces Eqinee ne 27 - 2q AusBt 2003 . Unir.fiti Malatsia Sabah, Kota Kinaboh
asn=
j'Lr,; -it I'
Hefe,.x is the measurement of the producfcomposition, i is its estimaajon value, tis the mean value of measurements, and /y' is the number of measurement,
PLS Estimator
The strength of PLS model is its capability to deal with a large set of correlated data. For tie unity of the data, the selected input variables should be mean-centred €trd variance scal€d through Equation 9 and 10, rcspectivety.
(e)
( t0)
, = z '
' I
d
1 2
l | S i , . - ; 1 2 | N Z ' \ ' t ' l
Here,.z is an input vadable, Z is.the niean value ofdie input set, z, is a mean centred value , z, is the mean centi€d and variance scaled value, and,{ is the number of inputs in a data set.
('7)
(8)
i
J €
E
r
'"1
o.!.1
o.e.l
I
:t
l r l
i ' t
9 l
l , * l
F
*^r
* * l
i * l
: l
J y j
? ' r
! 6 l
i *
l :
9 "
9 e
5
E".,
o @ t
a
Fjgure 4 Dynanic Response of 57o Increas€ in .the Feed Temp€rature
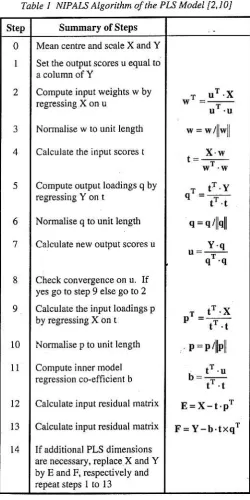
The development of the inferen[ial model was carried in the MATLAB environment. The NIPALS algorithm of PLS, which is shown in Table 1 , was transfened to the platform of MATLAB using its programming ianguage. The model was first trained using a training daaa in o.der to obtain the associate score factors. The numbers of latent variable were set at 20. After the training, the score factors were kept, and tbey were further used to cross validate different sets of operating data. These resuLts arc shown in Figure 5.
Table t NIPAIS Alsonhm olthe PIs Model I2J0l
In order to evaluate the Derformance of the infereotial estimator, the model was tested on three sets of data. They were made up of differen! opsating conditions:
Pruuedines of lntewtional Cohfeence On Chenical and Biopmes Eui@erinq 27' - 2q' Augui 2AB . U,iversili Molafsia Sabah, Kora Kinabatu
. Daaa A - Nomlal operating condilions . Data B - Intermediate fluctuations . Data C - Severe fluctuarions
The pur?ose of the evaluation was to investigate the accuracy and robustness of the model. The actual values and the prediction results of these data are plotted in Figure 6, 7 and 8.
Figure 5 Training Results by Using PIS and Htbrid PI,s-ANN Models
Formulation of Hybfid PLS-ANN Model
As mentioned earlier, tne PfS model is a lineaf identification method. In order to improve the ability of the nodel to deal with non-linear system, a hybrid model, called bybrid PLS-ANN model were formulated. A feed forward network with one hidden layer was incor?orated inlo the PLS model. Hence, it replaced the linear inner model and includes the nonlinear feature in the PLS modet. Similar to the PLS model, $e hybdd model was built in the MATLAB environment using both the Neural Network Toolbox ,nd ihe MATLAB programming language.
The network was a single input single output (SISO) network, wbere the inputs were the matnx of score factofi, T, and the outputs were the matrix of score facto$, U. Before the network training, it is important to determine the 'best' network topology to avoid the problems of either over'fitling or under- fitting. Hence, the optimal number of hidden neurons should be decided. In this work, we used trial and enor approach, and the number of hidden neurons was
The training algorithm of this network was Levenberg-Marquardt method. For network tmining, cross validation was implemented as the stopping criteria. The data set was split into a training set and a testing set. The trained model was validated with tbe testing set s€quentially. The lraining was tesninated when the prediction enor of the lesting dipped into a minimum and started to increase. Figure 5 shows the rraining results of the hybdd PLS-ANN model.
Similar with the PLS estimator, the bybrid estirnator was tested on three sets of data, rvhich were Data A. B and C to evaluate its performance. The predicted C-12 compositions
,!
i ' "
3 . "
E.lrrurloi or cr2 More F6dro. (rralnlng Dab)
Step Srmmary of Steps
0
I
2
3
4
5
8
9 6 ,7
1 0
l l
t2
l l
Mean centre and scale X and Y Set the ouiput scores u equal to
Compute input weights w by regressing X on u
Nonnalise w lo unit length
Calculate the input scores t
Compute output loadings q by regressing Y on I
Normalise q to unit lenglh
Calculate new output scores u
Ch€ck convergence on u. If yes go to step 9 else go to 2 Calculate the inpul loadings p by regressing X on t
i.{ormalise p to unit length
Compute inner model regression co-effi c;ent b
Calculate input residual matrix
Calculate input residual matrix
lf additional PLS dimensions are necessary, replace X and Y by E and F, respectively and repeat steps I to 13
r u r . x
X w
- t T Y
t _ . t
q = q / l l q
Y . q - q r ' q
' t r . X
t ' . t
p =p4hll
, t T , u - t T t
E = X - t . p r
F = Y - b t x q r
of these data arc also plotted in Figurc 6, 7 and 8' Subsequently, the periormance of both PLS and hybrid model wa! comparcd with the actual values
[email protected] oJ lht.ndiorul Co4l.ren.. On Cheninl and Biopruc.s Eneii.prine 27 2y Aueu! 200J , Unit.ttiti Motntsb Sabah, Kota Ki4abatu
Eslimatlon ol C-l2 Mole Fractlon (Cross-valldatlon - Data A)
I
=
ri
s
=5
0,93
0,88 0.86
0.62 0.4
0 200 400 600 a00 1000 1200 1,too Tlm€(MlnuleE)
Fisurc 6 Esrit&tion Results of Data A by Using PIS and Hybrid PIS-ANN Moclels
Estlmatlon ot C.l2 Mole Fractlon (Cross-valldatlon - Daia B)
0,93 0.96
o.92 0,9 0,aa 0,46
0.82 0.8
0 500 1000 l50o 2000 2500 Tt 16 (Mtnut$)
Figure 7 Estimation Results of Dota B bt Asinq PIS aid Hybid PI.S-ANN Models Edlmtlon ol o'12 ilole Fraotlon ([email protected] dalton - Data c)
5 . *
= o s
FiAure 8 Es,iftation Results af Data C by Usins PIs aad Hybid PLS-ANN Modek
Discussions
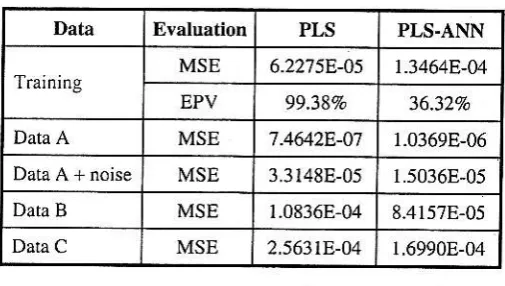
Tbe mean square enors of the training and validation data for borh PLS and hybrid estimarorwere summarised in Table 2. For rhe rraining dara. the optimum number of larent variablesthat can best train the daia was 20. However, only 5 tatent variables wereneeded to train thehybrid model.Irwas because the MSE for the cross validation rest was nol decreased and the EPV for the output data was not remarkable increased using more than 5 larent variables. As a resuh, the training MSE of PLS model was lower with high percentage ofEPV.
TabLe 2 Conpatison ofMSE and EPv for PLS and Pl"S-ANN Model.
When the Pl-S model was rested on dara with diffe.ent operaling condirions, the predicrion results were good and acceptable. Refening to Figure 6, 7 and 8, the predicted compositions were close to the acrual value for Dara A. For DataB and DaraC, thepredicred resulrs were not so accurare, but they were still following the |rend of the actual values. Thus. we can say that when the fluctualion in the process was mcreased, fie MSE was getting higher as we .
These predicted results car be improved by using tbe hybrjd PLS-ANN estimator. Sirnilar with ih€ PLS modet, rhis model was trained and then tesred on various sets of dara. Allhough the raining MSE of the hybrid model was higher Ihan the PLS model. it can perform berter when cross validation was implemented. Resulrs showed that rhe cross validation MSE of the hybrid model were lower in all cases. However. tbis model faced the similar limitations as in rhe caseofthe PLS model. The resulting MSEincreases with the rncrease in process fluctuarions.
We have also srudied the influence of measurement noise to both ofthese estimators. l0% noise was inrroduced to three contol variables, which were the top column temperature, reflux and recycle flow rate. The MSE of botir esumarurs were still acceptable and rhe prediction values were following lhe trend of the actual values. Thus, we can conclud€ that rh€se esrimarors have the ability ro deal with
Based on the results. we have proven that rhe PLS inferenlial esiinator was able ro give good predidion using rhe online
'786
Ptuuediqt of Inktutiovl ConfeE .e On Chehiat an| Bjaptucess Ehgiheerina 27' - 2q AusN 2Oo3 , Uni,e\iti Maltrsia Sabah, Kotd Kiaabat;
measured Focess variables. Moreover, ihe peformance can be improved usilrg the hybrid PLS-ANN nodel. Apar! from the statistical melhods, ariificial neurai nerworks are also lhe alternative solution to inferenrial esrimaror. A conventional three layer feed forward nerworks can be used ro deveiop the model. lt is still able to give proper predicrion with acceptable enors. However, when rhe model is resled with a large set of corelated dara, it will provide poor predicrion. This is due to the limilation ofthe network slructure, where the dala are not auro-correlated. Neverthetess, rhe timiration can be overcome using differenr rctwork structure. Recunent networks, whjch support the returnable of some dala is suspecred to give better resutts.
Since the structure and development of inferential estimarors arestill immature, this field is srill opened for research. Thus, futu.e works can be done using d;fferent model structure. Besides rhat, addirional devices. such as fiiter and bias can be added to th€ existing model !o improve its accuracy and
Conclusion
In this paper. the inferenrial esrimaror for the product composjtion of a fa$y acid fractionation colunm was buitr using PLS model. The online measured process variabLes such as tray tempefaru.es, reflux flow rate, recycle flow rate, teed tempemture and top column temperature w€re used to construct the eslimaror. This esrimaror had been performing well in various operaring conditions. Moreover. ir was able to give good pred;clion under nois, condilions.
The robustness and accuracy of de PLS esrimator can be improved by introducing nonlinear fearue irro the modet. This paper incorporated ANN into the pLS modet to capture the nonlinearity that is always exists in chemical processes. The prediclion resulrs proved rhar $e performance tra. better compared with the PLS model.
The hybrid PI-S,ANN estimator is therefore concluded ro be applicable !o chemical processes. However, rhe understanding of the firsr principle model and ihe dynamic behavjour of rhe process should nor be elimjnat€d during the development of inferential esrimator. The tacking of rhe process information may cause to obrain an unreliable
Acknowledgments
This project is funded by lhe Ministry of Science, Technology and the Environment rhrough National Science Foundation Scholarships and IRPA research grant. Our heartiest appreciations are for everybody who has dircctly or indirecdy contribute 10 the success of rhis projecr.
Data Evaluation PLS PLS.ANN
T.aining M S E 6.22758-05 13464E-M
EPV 99.38Vo 36.32%
Data A MSE 7.4642E-07 1.0369E-06
MSE 3.3148E-051.50368-05
Data B M S E 1.0836E-04 8.41578-05
Dala C MSE 2.56318-04 1.69908-04
References
f l l J o s e o h . B , a n d B l o s i l o w C B I 9 ? 8 l n f e r e n r i a l ''
Co nirol o f Proceses Atcht Joumal 24\3r4a5'508 l 2 l c e l a d i , P . . a n d K o w a l s k i B R l 9 R 6 P a d i a l
LeAr-Squares Regression: A Turoial Ahalvtica Chimica Acta 185|l'1"1
f l l M e i d e l l , T . . a n d S k o g e s c d S l 9 9 l a E s t i m a t j o n o f DiriUation compos;tions from Multiple TemPerature Measurements Using Partial-Leasl_Squarcs Regression' Industial En|ineerins Chemical Research 3Ol 2543-2555.
l 4 l N 4 e i d e l l , T . . a n d S k o g e s r e d . S l g g l b C o m p o s i l i o n e s t i m a r o r i n a P i l o F P l a n l D i s L i l l a t i o n C o l u m n U s i n g Multiple Temperatures. lndustial Engineering C he nical Re s earc h 30t25 55 -2564
I5l Budman, H.M.. Webb. C., Holcomb, T.R.' and Morari' M. 1992. Robust Inferential Coolrol for a Packed-Bed R:e^ctoL lndus al Esgineeine Chemical Research 3r:1665-1679.
t6l Kresla. J.V., Marlin. T.E.. and Maccregor, J.F. 1994 Development of tnferential Process Models Using PLS Conputers & Chenical Engineerine IAQ\I591 -6t 1 '
Pn@edinss ol lnt.rnationol Codele4! On Chedical and BiaProces EiSi"eerkg 27t -2E Ausui2oa|, unieersiti MalLlsiasobah Kotu KinabaLu
[7] Dayal, 8.S., and Maccregor, J.F. 1996. Recursive Exponentially Weighted PLS and Its Applications to Adaptive Control and Prediction. Jaunal of Process Contrc 7 (3'):169"179.
[8] Kano, M., Miyazaki, K., Hasebe. S , afld Hashimoto, I 2000. Inferential Control System of Destillation Compositions Using Dynamic Partiai Least Squares Re$ession. Journal of Process Contro 10:15'l'166.
t9l Qin, S.J., and McAvoy, T.J 1992. Nonlinear PLS modellirg Using Neural Networks. conp te^ and C he n ic al E ns ine e r i n s 16(4) :31 9 -39 t.
tlol Baffi. G., Martin, E.B., and Moris, AJ. 1999 Nonlinear Projection to Latent Structures Revisited (the Network PLS Algofithm). Comp terc and Che mi c al En e ine e r ing 23. 1293 - 1301.
llll Adebiyi, o.A., and Conipio, A.B 2003 Dynamic Neural Networks Panial L€ast Squares (DNNPLS) Id€n.ification of Multivariable Processes CanPrrelr and ChemicaL En|inee ng 27 tl43-155.
[t2] wold, H. 1985. Fartial Least Squares. In Encyclopedia of Statistical Sciences. vol 6. 584"591. New Yorkl w i t e y .