Using Computer
Simulation to Reduce
Supply Chain Cycle
Time
by
Donna Retzlaff-Roberts
Ernest L. Nichols, Jr.
The University of Memphis
Executive Summary
Few topics in the business literature have received greater attention in recent years than supply chain management. Organizations are recognizing that success is significantly influenced by the ability to effectively manage the flow of materials and infor-mation between internal functional areas, across interorganizational boundaries, and with suppliers and customers. As organizations focus on these in-ternal and exin-ternal supply chains, a recurring ques-tion is, “How can materials be moved through the supply chain in a more timely manner?”
Computer-based simulation modeling offers an ef-fective analytical tool for organizations that are at-tempting to improve cycle time performance in a supply chain environment. Given the complex na-ture of many supply chains, simulation modeling is one of the few approaches that can capture the dy-namic nature of the system in a realistic and useful manner. Simulation modeling provides its users with the opportunity to determine the effects of specific changes under consideration for one part of the sup-ply chain on other individual supsup-ply chain “links” and on overall supply chain performance.
Simulation modeling is presented here as a valu-able tool that should be part of the analytical “tool box” for organizations that have adopted, or are con-sidering, an integrated supply chain management paradigm. Three research projects that utilized simulation models to identify opportunities for cycle time reduction in different supply chain environ-ments are presented as examples. These examples demonstrate the range of issues that can be analyzed through the use of simulation modeling. The first two projects are covered briefly, and the third is presented in greater detail to illustrate the process of undertaking a supply chain simulation study. Several critical success factors to be considered when undertaking a simulation modeling project are also presented.
Introduction
Use of computer simulation can be very beneficial in reducing the cycle time of business processes by allowing for evaluation of “what-if...” scenarios without the risk of experimenting on the actual sys-tem or process. Simulation conducted correctly can provide a reliable prediction of results.
In the past, use of computer simulation was a slow and tedious process and, hence, was considered a tool of last resort. A simulation expert with full command of a simulation language was required, and lengthy files of code had to be written and de-bugged. Simulation was in use as early as the 1950s with general purpose languages such as FORTRAN. Specialized simulation languages appeared in the 1960s. Understanding and finding ways to improve complex systems was the impetus then, and it still is today.
Using computer simulation today is much less oner-ous than in the past due to enhanced user friendli-ness of software. Many simulation packages include animation so that the process can be viewed in ac-tion, allowing those with no previous knowledge of simulation to observe and understand the modeling process. Animation makes it possible to quickly and easily determine if the model is behaving as
intended or not. Greater user friendliness has also significantly reduced the cycle time of model de-velopment. Many simulation packages are currently available ranging from highly flexible general pur-pose packages to highly specialized packages. As a general rule, more flexible
packages require a more knowledgeable modeler. A review of many of the packages currently available may be found in Swain (1995).
Reduction of supply chain cycle time has been achieved in various types of busi-nesses by using computer simulation. To illustrate the variety of possible applica-tions this article describes several examples: (1) an in-ternational supply chain, (2)
a retail inventory, and (3) a freight carrier. The first two examples are covered briefly while the third is covered in greater detail to explain how a supply chain simulation study might be conducted. Simu-lation techniques used follow standard simuSimu-lation practice such as may be found in Law and Kelton (1982). These simulations were conducted using ARENA, a general purpose simulation package.
International Supply Chain
Example
An international company with manufacturing fa-cilities in Europe was experiencing a lengthy cycle time in fulfilling U.S. customer orders. Customers placed orders with the company’s U.S. division, which would then relay the orders to the European division. Various physical and administrative pro-cesses were necessary to prepare an order, which was then shipped to the U.S. division, and from there on to the customer.
As in many organizations, personnel from different functional areas are involved in various parts of the
process, resulting in a variety of perspectives. How-ever, the “big picture” of the entire supply chain is not necessarily apparent to those involved. By bring-ing together key players from various parts of the organization to map the entire supply chain, some enlightenment typically oc-curs as the right hand dis-covers what the left is do-ing. Mapping the supply chain involves creating a process flow chart and gathering data on the time required for each step in the process, including the aver-age or typical time required to complete a specific task and the range (the minimum and maximum times). Process mapping for this study revealed the most sig-nificant delays were caused by consolidation of freight and a lengthy U.S. cus-toms clearance process. Therefore, alternatives to be considered involved creating a U.S. inventory in anticipation of U.S. demand and express shipping directly to the U.S. customer from Europe. Both scenarios would use express air freight. The U.S. inventory approach has the advantage of the fastest fulfillment time (assuming inventory is available), but would increase worldwide inventory. The di-rect shipment approach would not increase inven-tory, but would not improve fulfillment time as sig-nificantly. Computer simulation allowed a clearer understanding of the implications of each strategy, allowing for more informed decision making. Fur-ther information on this study may be found in Nichols, Retzlaff-Roberts, and Frolick (1996).
Retail Inventory Example
Moving from commercial customers to retailing, a different kind of supply chain is involved. A study was conducted for an organization that both manu-factures and retails upscale men’s shoes. The orga-nization retails its products in company-owned
Given the complex
nature of many supply
chains, simulation
modeling is one of the
few approaches that can
capture the dynamic
nature of the system in a
realistic and useful
manner.
stores nationwide and has a complex inventory due to the wide variety of products resulting in an enor-mous number of stock keeping units (SKUs). For example, a specific style of shoe in a particular color can lead to up to 100 SKUs when all the combina-tions of size and width are considered. However, the sales volume from each store is not sufficient to warrant keeping all SKUs in stock. Attempting to do so would lead to an enormous amount of inven-tory, much of which would not be sold in any given year. Analysis of the sales data revealed that the Pareto Principle applied, meaning approximately 20 percent of the SKUs accounted for 80 percent of the sales.
Retailers routinely capture revenue data but are not as likely to capture operations data within the store. For example, the number of times a stocked versus a non-stocked SKU was selected was unknown. A non-stocked SKU refers to one that is intentionally not carried by the store due to limited demand (e.g., size 16, EE width), whereas a stocked SKU is one the store carries in inventory that can at times be out of stock. If the customer chooses an SKU that is not in the store for either of the previous reasons, a special order is offered. Data was not available on what portion of special orders were due to stock-outs versus non-stocked SKUs. This information was missing because the offer of a special order was often rejected resulting in a lost sale, and no data was collected on the desired SKU. Lacking data of this type makes it more difficult to model a process. However, sufficient data was available to allow gradual fine tuning of the simulation model, result-ing in good estimates of the unknown data. Such a procedure is part of the model validation process discussed in greater detail later in this article. In this instance, modeling the current process revealed previously unknown information, thus providing a better understanding of the process and paving the way for better decision making. These decisions include how many SKUs to stock, which SKUs to stock at a particular store, and what stock-up-to level should be used for each SKU. A wide spectrum of “what-if” scenarios was subsequently explored us-ing the simulation model. Further information on
this study may be found in Retzlaff-Roberts, Nichols, and Wetherbe (1995) and Morgan and Lucas (1997).
Freight Carrier Example
The preceding examples help demonstrate the breadth of possible simulation applications. The freight carrier study discussed in this section will be used as the primary example to show in greater detail the process by which a supply chain simula-tion study might be conducted.
Current Situation
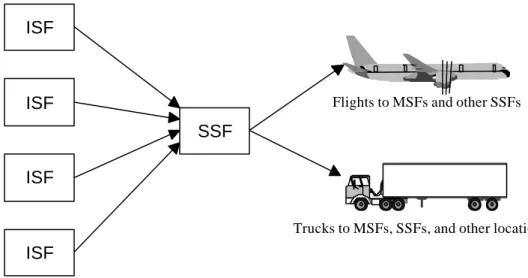
A freight carrier was seeking to reduce the cycle time of its package sorting operations. Packages are collected from customers and taken to initial sort facilities (ISFs) where preliminary sorting is done. Then the packages are transported from the ISFs to the secondary sort facility (SSF). In the region stud-ied, there are a number of ISFs and one SSF, as shown in Figure 1. After sorting is completed at the SSF, the packages are transported by air or truck at a variety of times (some leave immediately after sort-ing and some the next day) to a variety of destina-tions, as illustrated in Figure 1. Upon arrival at the immediate destination, the packages undergo fur-ther sorting, and subsequently, furfur-ther transporta-tion before final delivery. The amount of additransporta-tional handling and transportation is dependent upon the final destination. For many packages the immedi-ate destination is a major sort facility (MSF), but others may go directly to another SSF or even to an ISF if the final destination is within the region. However, the scope of this study does not include activity after departing the SSF. The impact on the chain downstream of the SSF can be evaluated by determining what time a truck or aircraft left the SSF, and how many of each of the various types of packages the vehicle carried.
Packages are sorted at the SSF based on their im-mediate destination and the customer-specified gency of delivery. Express packages, the most ur-gent, must be delivered the next day and are
trans-ported by air. Standard packages are less urgent and generally transported by truck. Packages with a final destination within the region, whether ex-press or standard, also are transported by truck. As the number of major sorting facilities has in-creased, the number of immediate destinations has increased, which in turn increases the complexity of the sort required. However, the time window available for completing the sort has not increased making it sometimes difficult to complete the sort in a timely manner. As in any supply chain, the time required for each step affects the following step, as well as those further down the chain. Thus, a delay at any point affects all portions of the chain that follow. Time is most limited for the express packages with final destinations outside the region which leave the SSF by air. As is widely known, commercial aircraft typically fly at a speed to mize fuel efficiency, which is usually not the maxi-mum speed. When aircraft depart late, time can be made up en route by flying faster, but this can be expensive due to the increased fuel consumption.
Ensuring that flights depart in a timely fashion is preferable.
Some of the MSF destinations have more than one flight due to a significant volume of express pack-ages. Multiple flights to a destination allow early flights to depart the SSF prior to completion of the SSF sort, resulting in arrival of some volume to the MSF earlier. The last flight to the MSF does not depart until after the SSF sort is completed. For ease of movement, packages are sorted into containers of various sizes. These containers can quickly be put onto a truck or aircraft. As previ-ously mentioned, some preliminary sorting is done at the ISFs. Some of this sorting is done into con-tainers to reduce the required sorting at the SSF. A “pure” container is one that requires no further sort-ing at the SSF provided it is full. For example, a container of express packages all bound for the same MSF is a pure container and can be put directly onto an aircraft. If it is not full, then it can either be “topped off” at the SSF, or unloaded and sent through the entire sort process at the SSF. The latter course
ISF
ISF
ISF
ISF
SSF
Flights to MSFs and other SSFs
Trucks to MSFs, SSFs, and other locations
of action is undesirable because it completely dis-cards the effort expended at the ISF to sort into a pure container.
Trucks deliver the packages from the ISFs to the SSF. Some trucks carry containers of sorted vol-ume while others carry unsorted bulk volvol-ume. The number of trucks traveling from an ISF to the SSF depends on package volume and varies widely among ISFs. Urban ISFs tend to be high volume and may have as many as twenty or more trucks delivering to the SSF, whereas rural ISFs tend to be low volume and may have only one vehicle deliver-ing to the SSF each day. Each truck arrives at the SSF according to a schedule. Trucks that carry con-tainers have a loading plan which has been tailored to the volume the ISF has been experiencing. Trucks carrying express packages have earlier arrival times at the SSF, while other trucks arrive later. Container size varies and is specified in the load plan. Smaller containers have a better chance of being sufficiently full when the truck departs the ISF. For example, a particular truck’s load plan might specify one con-tainer with a capacity of 400 of a particular type of package, or it might specify two containers with a capacity of 200 packages each. The total capacity is the same in either case. Suppose that on a given day, 240 packages of that type had been sorted by the truck’s departure time. The single container would be far from full, and could not be placed di-rectly on an aircraft, thus requiring a resort of the entire 240 pieces. However, utilization of the two 200 package capacity containers would result in one full container which could be loaded directly onto an aircraft.
The Simulation Model
At the SSF, there are numerous package types that must be sorted out, or “split” from one another. These package types or “splits” arise from the vari-ous combinations of immediate destination (for ex-ample, a particular MSF) and product type (express, standard, international, etc.). For model simplicity the number of splits was aggregated down to 18. Aggregating within immediate destination did not
impair model accuracy. The volume of each of these 18 splits is random each day for each ISF, and as a result, the quantity loaded onto each truck deliver-ing to the SSF varies each day. Data was collected to attempt to capture the distribution of each split as accurately as possible. Each truck delivering to the SSF can have up to all 18 of the different splits on board. However, those for which a load plan is specified generally carry far fewer splits. For ex-ample, a truck carrying containers might have only three or four splits depending upon the load plan. Data was also collected on the rate at which pack-ages pass through the SSF sort operation, the rate at which they are loaded into containers, and the time necessary to load containers onto aircraft. The first portion of the model determines the volume of each split on each truck for a given day. This involves random values from appropriate probability distri-butions, the specified load plan, and other decision rules used for loading the trucks. The second por-tion of the model simulates in real time the arrival of each truck to the SSF, and for each of the 18 splits tracks:
•
The volume of packages currently waiting to be sorted,•
The volume of sorted packages currently wait-ing to be loaded into containers,•
The current volume of sorted containerized pack-ages, and•
The rate at which sorting and loading into con-tainers is occurring.The simulation was capable of generating time plots of the above information, as well as cumulative val-ues which are helpful in understanding how the sys-tem is functioning.
The final section of the simulation generates a re-port with a wide variety of summary statistics that are helpful in understanding system performance. A major performance measure is volume on each flight. For multiple flight MSF destinations, it is important to have as much volume as possible on
the earlier flights. The total volume on each flight at its departure time is reported based on the con-tainerized volume available to be loaded onto the aircraft prior to departure. Other examples of sum-mary statistics include the volume of packages sorted into pure containers at the ISFs, and of these, a break-down of shipments which did and did not require resorting at the SSF. This shows both the benefit of time spent sorting at the ISFs and the amount of rework resulting from insufficiently full pure con-tainers.
What-If Scenarios
After model validation using feedback from man-agers and checking against available data, potential system changes were analyzed. In addition to model validation, observing simulation results from the cur-rent system is important for other reasons. It often provides new insight into how the system is
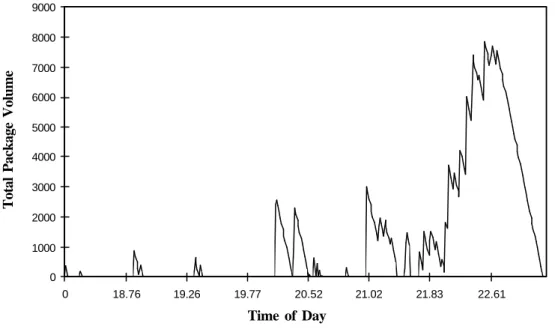
behav-ing, which can help indicate where changes would be beneficial. For example, Figure 2 shows the time plot of the total volume at the SSF waiting to be sorted. The line rises vertically when a truck ar-rives at the SSF indicating the package volume that has arrived, and declines gradually based on the rate of sorting. When the line reaches the horizontal axis, there are no packages waiting to be sorted which indicates unutilized sort capacity. As can be seen in Figure 2, truck arrivals are not spread evenly; they tend to be in batches between periods of used capacity. Late in the process, there is no un-used capacity and a large backlog develops. This backlog could be reduced and some of the earlier available capacity utilized if arrivals were distrib-uted more evenly and a few arrivals were moved earlier. By moving the arrival time of less than ten percent of the trucks a few minutes earlier, nearly five percent more volume was available to put on the first flights destined for MSFs, and the sort was completed earlier.
Figure 2: Total Package Volume at SSF Waiting to be Sorted
0 1000 2000 3000 4000 5000 6000 7000 8000 9000 0 18.76 19.26 19.77 20.52 21.02 21.83 22.61 Time of Day
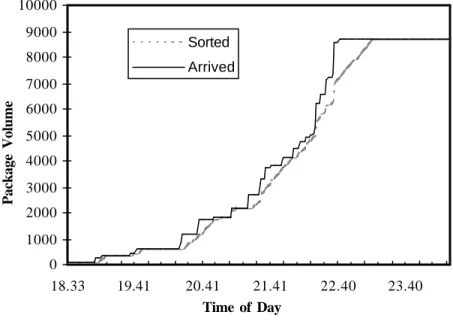
Figure 3 shows the cumulative rather than the cur-rent amounts for a particular split. The solid line (the arrival line) shows the cumulative amount of package volume that has arrived at the SSF, and the dashed line (the sorted line) shows the cumulative amount of sorted containerized package volume. The vertical distance between the two lines at any point in time shows the volume waiting and in pro-cess. When there appears to be only one line, they are directly on top of one another, indicating that the system has “caught up,” and there is nothing (at least of this split) waiting to be sorted. The slope of each line indicates the rate at which each volume is accumulating. The arrival line takes large vertical jumps as entire truckloads arrive, while the sorted line increases gradually based on the sort rate. At times the sorted line also takes large vertical jumps, indicating the arrival of pure containers that are suf-ficiently full and do not require sorting. As dis-cussed earlier, pure containers that are not full can
be either topped off or unloaded and sent through the entire sort process. Figure 3 is based on the assumption of resorting containers that are not full, so there are more pure containers arriving than are reflected by the vertical jumps of the containerized line. When partially full containers are topped off instead, rework is mitigated, and the sort is com-pleted in a more timely manner due to the reduced package volume that must pass through the SSF sort. For example, results indicate that when containers which are at least 70 percent full are topped off rather than resorted, at least 50 percent of the volume from the last flight (for multiple flight MSFs) was able to depart on a flight that was 45 minutes earlier. Results confirm the importance of balancing the sorting into containers at the ISFs. Too much sort-ing into containers at the ISFs causes rework at the SSF due to many containers with too little in them. Too little sorting at the ISFs leaves too much
sort-Figure 3: Cumulative Volumes for an Example Split at the SSF
0 1000 2000 3000 4000 5000 6000 7000 8000 9000 10000 18.33 19.41 20.41 21.41 22.40 23.40 Sorted Arrived Time of Day Package Volume
ing for the SSF. Careful planning for each ISF is important in order to determine which splits to sort into containers and what size those containers should be.
Success Factors
There are a number of factors that contribute to a successful supply chain simulation study, as well as a number of potential pitfalls that should be avoided. As discussed earlier, studying a supply chain in-volves bringing a
cross-functional, often inter-organizational group to-gether, that may not inter-face routinely. Typically, the first meeting involves enlist-ing everyone’s input in map-ping the current process. Development of this process map in itself often provides valuable insights that may be counter to the group’s initial understanding of the pro-cess. In order to bring such a group together,
manage-ment support is essential and remains essential throughout the study to insure:
•
Timely cooperation of key personnel,•
Access to necessary data,•
Designation of an empowered project champion within the organization, and•
A tone of open-mindedness.Following the initial meeting, conversations are of-ten needed with various people to gain detailed in-sights and collect data. Cooperation of personnel is critical to timely project completion, but it can be problematic. Most people are very busy handling their regular responsibilities. A request to do some-thing additional from outside the organization will
not necessarily be a top priority without ongoing management support.
Frequently, the request is to provide data which can be problematic even with full cooperation. Some potential pitfalls include lack of recorded data on some vital process steps or data in a different form than is needed. The latter was the case in the retail supply chain discussed earlier. Another potential pitfall may be multiple sources of conflicting data within the organization. Obtaining the right data in a timely manner is usually the greatest cause of de-lay in a supply chain simulation study. One way to help overcome this problem is for management to designate an empowered champion within the organization.
Management support is also important for setting a tone of open-mindedness. A po-tential pitfall occurs if per-sonnel regard the study with skepticism or even resis-tance. For example, if an individual perceives the study is being done because upper management feels that he or she is not per-forming adequately, then resistance is likely. When studying the current process, we have found that in-dividuals sometimes describe how the process should work, rather than how it does work. This is more likely when people feel defensive about cur-rent process performance. Open-mindedness is also important for receptiveness to alternative ways of completing a process. Overcoming a “but we’ve always done it this way” mentality sometimes can be a significant issue.
Open-mindedness is also important for identifying “what-if” scenarios to consider. There may be a great solution, but no one has thought of it yet. Bringing the cross-functional team together for a brainstorming session can result in people building on other’s creativity. Good ideas can come from any part of the organization, as well as customers,
In all cases,
management was able
to gain significant
insights into the
alternatives being
evaluated prior to
making any operational
suppliers, or anyone else affected by the process. Often those with the most “hands on” contact, are a good source of ideas.
Some success factors related to building and using the simulation model include:
•
Validating the model both with data and “gut feel” of key personnel,•
Running simulation long enough to capture the full range of variability, and•
Finding the right balance of model simplicity and usefulness.Model validation refers to ensuring that the model is behaving sufficiently like the system it is imitat-ing. The reason for modeling the current system first is to insure that the model is accurate before proceeding to study potential changes. Frequently, the model goes through an iterative process of modi-fications and validation checks. If an inaccurate model is used to analyze changes to the system, poor decisions may result.
A simulation must be run long enough to capture the full range of variability. For example, in a retail store simulation, simulating one day would be in-adequate for observing system behavior. The one day studied might be a typical day or an unusually busy or slow day. Observing the full spectrum of variability is important to understanding the pro-cess.
Business processes and supply chains can be com-plicated. Building a useful model in a timely man-ner requires using judgment and maintaining close cooperation between the model builder and key per-sonnel within the organization.
Conclusion
The use of computer simulation models for the analysis of integrated supply chains has been ad-dressed in this article. The three examples provided
demonstrate the value of the simulation modeling approach in a variety of industry and supply chain environments. In each case, the simulation model helped managers identify opportunities for signifi-cant cycle time improvement in their specific sup-ply chain. The simulation models also provided the means to compare the level of improvement associ-ated with different alternatives being considered to improve overall supply chain performance. In all cases, management was able to gain significant in-sights into the alternatives being evaluated prior to making any operational changes.
Several critical success factors should be formally addressed when conducting a simulation modeling project. The importance of timely cooperation of key personnel, access to required data, an empow-ered project “champion,” and an open and creative organizational “mind set” cannot be overstated. Developing the capabilities to conduct simulation modeling projects has the potential to be a very valu-able organizational resource. The value of this ca-pability increases for an organization that has adopted the integrated supply chain management strategy, a strategy that offers significant benefits while having the potential to increase the complex-ity of the decisions faced by management. Simula-tion modeling has been demonstrated to be an ef-fective decision support tool for addressing com-plex system problems such as those presented in an integrated supply chain.
References
ARENA Users’ Guide, Systems Modeling Corporation, Sewickley, PA, 1994. Law, A. M. and W. D. Kelton, Simulation
Modeling and Analysis, McGraw-Hill Inc., New York, NY, 1982.
Nichols, E. L., D. Retzlaff-Roberts, and M. N. Frolick, “Reducing Order Fulfillment Cycle Time in an International Supply Chain,” Cycle Time Research, (2:1), 1996, pp. 13-28.
Retzlaff-Roberts, D., E. L. Nichols Jr., and J.C. Wetherbe, “Complete, Pareto, and No tory: Alternative Strategies for Retail Inven-tory,” Cycle Time Research, (1:1), 1995, pp. 41-61.
Swain, J. D., “Simulation Survey: Tools for Process Understanding and Improvement,” OR/MS Today, August, 1995, pp.64-79.