Development and initial application of a blade design methodology for
overspeed power-regulated tidal turbines
Katie Gracie-Orr*, Thomas M. Nevalainen, Cameron M. Johnstone
Energy Systems Research Unit, Dept. of Mechanical and Aerospace Engineering, University of Strathclyde, Glasgow,Scotland, G1 1XJ
Robynne E. Murray, Darrel A. Doman, Michael J. Pegg
Dept. of Mechanical Engineering, Dalhousie University, PO Box 15000, Halifax, Nova Scotia, Canada, B3H 4R2
Abstract
The range and variability of flow velocities in which horizontal axis tidal stream turbines operate introduces the requirement for a power regulation method in the system. overspeed power regulation (ospr) has the potential to improve the structural robustness and decrease the complexity associated with active pitch power regulation methods, while removing the difficulties of operating in stalled flow. This paper presents the development of a methodology for the design of blades to be used in such systems. The method requires a site depth, maximum flow velocity and rated power or flow speed as input parameters. The pitch setting, twist and chord distribution were set as input parameters, variable through the use of alteration functions. Rotor performance has been broken down into ospr performance metrics which consider coefficients of power and thrust, and cavitation inception. Three visual-numerical tools have been developed: theospr performance metrics were used in conjunction with a one-at-a-time sensitivity analysis approach to develop a design space; cavitation inception analyses gave plots of converging cavitation and pressure terms for each blade section; the local angle of attack and torque distribution across the blade designs were plotted at key turbine operation states. Alterations to pitch setting and twist distribution are shown to have most impact upon this design requirement; coupled with such alterations, targeted changes to the chord distribution have been shown to increase the maximum efficiency. The prevention of cavitation has been highlighted as a driver for speed-limiting design alterations. While facilitating blade design, the methodology also produces experiential knowledge which can be stored, and shared in graphical format.
Keywords: Tidal turbine, blade design, overspeed, power regulation, design methodology, sensitivity analysis, blade element momentum theory
1. Introduction
Cost reduction, in order to become economically competitive with other sources of renewable energy, is essential for the development of the tidal energy industry. It is therefore desirable to remove as many of the vulnerabilities, complexities and systems which add cost to tidal turbine technologies. One aspect of tidal turbine systems in which this may be achievable is the power regulation system. This paper outlines a 5
methodology developed for the design of blades for horizontal axis tidal stream turbines (hatsts) in which osprwill be the means of power control, with the goal of cost reduction over alternative power regulation methods.
∗Corresponding author
0 200 400 600 800
P
(kW
)
I II III Parked
U∞ (m s−1)
Parked
Cut-in Rated Cut-out
[image:2.595.169.436.110.247.2]Pr
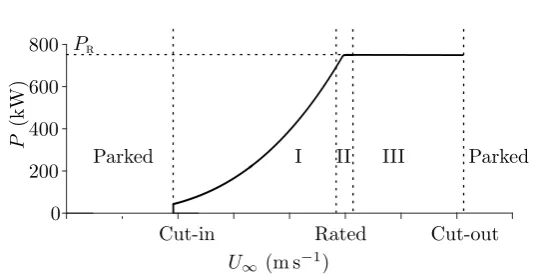
Figure 1: Operational regions forhatsts in terms of inflow velocity and power.
1.1. Power Regulation
The periodic variability of tidal flow velocities gives rise to an according periodic variability in the power available in the flow. hatstsystems achieve rated power,Pr, when the tidal flow reaches the rated flow speed,U∞r. For the greater part of the tidal cycle, flow velocities are less than or equal toU∞r, and turbines are generally operated in such a way as to maintain the rotor efficiency,Cp at the optimum value,Cpo. Cpis a function of the ratio between the speed of the tip speed ratio,λ, defined as:
λ= ΩR
U∞
. (1)
Cp is maintained at the optimum value through means of maximum power point tracking (mppt), in which 10
operation mode the turbine control keepsλat the optimum value,λo. The variability of tidal flow velocity means that higher values of power thanPr are frequently available, but for only a small percentage of the time. It is therefore more economically efficient to optimise the turbine system to capturePr at a value less than the maximum flow velocity,U∞max, and to spill orregulate the excess power when the available power exceeds the rated value. In this manner, the turbine system is operated at its most efficient for a greater 15
proportion of time and the generator, drive train components and rotor can be protected from electrical and structural over-loading.
This is summarised in Fig. 1. In region I the flow velocity increases from the cut-in speed,U∞cut-in, to the rated speed,U∞r, the turbine is operated inmppt and the power captured increases with the cube of the velocity. In region II, at a flow velocity slightly lower thanU∞r, the power captured nearsPr and the 20
system transitions from operation inmpptto power regulation operation. In region III, ideally, Pr will be maintained throughout, up to a cut-out speed. To achieve this,Cp must be reduced in line with the increase inU∞.
mpptand power regulation can be achieved with four main configurations: fixed speed (fs) operation of a turbine with fixed pitch (fp) blades,fsoperation of a turbine with variable pitch (vp) blades, variable 25
speed (vs) operation of a turbine withfpblades, andvsoperation of a turbine withvp blades. The latter two are the most common for hatstdesigns to date, and can each be combined with either permanent magnet synchronous generators (pmsgs) or doubly-fed induction generators (dfigs), decoupled from the grid through appropriate power electronics to allowvsoperation and power conditioning.
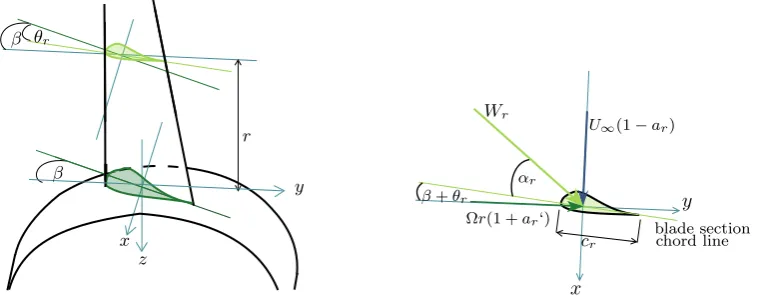
Invs vp turbines, active alterations are made to the blade pitch setting angle,β, (see Fig. 2) during 30
operation, allowing eitherpitch to stall orpitch to feather power control methods [1]. Invs fpturbines, the electromagnetic torque,Qem, in the generator which counters the mechanical torque produced at the rotor,
Qmech, is controlled to vary the rotational velocity, Ω, of the shaft and rotor. Normally, this control over Ω is used to put the blades into stall, lending the termspeed-assisted stall control. As Fig. 2 indicates, alterations toβ and Ω result in changes in the relative velocity,Wr, and the angle at which this encounters the blade 35
β
r θr
β
y
z x
U∞(1−ar)
Ωr(1 +ar‘) Wr
αr
β+θr
cr
blade section chord line
y
[image:3.595.111.492.149.297.2]x
Figure 2:Left: Orthogonal view diagram of rotor, blade at top dead centre position, coordinate system and angle definitions.β
is measured from rotor plane and has a positive value here;θris measured from the blade root chord line and is negative here.
Right: Plan view diagram of 2D flow vectors for a blade section, also showing definition of chord.
and tangential induction factors,aanda0, the vector relationship is given by
Wr=
p
((1−ar)U∞)2+ ((1 +a0r)Ωr)2 (2)
Fig. 2 and Eq. (2) illustrate that power regulation methods can manipulateβ and Ω, to controlWrand
α. The power and thrust developed at the rotor depend on the lift and drag forces developed by each blade section; these vary with Wr andαr. Thus, control ofWrandαr allows control of mechanical power and 40
thrust.
The pitching capability ofvp systems is generally achieved via an electronic controller with a hydraulic system, and sometimes with an electronic motor system [2]. vpblades allow rapid, blade-specific and, often, very sensitive adaptations to the flow conditions and thus facilitate increased energy capture, smoother power flow and reduced structural loading compared tofpblade systems. vp blades can also develop high starting 45
torques which can increase the annual energy capture, and can bring the rotor to a slower speed before application of the parking break [3]. However, pitching the blades into stall introduces challenges such as stall delay, reduced damping in separated flow, and hysteresis of reattachment. On the other hand, while pitching to feather maintains fully attached flow, comparably large pitch excursions are required, introducing a time-lag. This can have consequences on power and structural loads. Active pitch mechanisms add 50
mechanical and structural complexity to the system, decreasing the robustness and increasing the turbine’s vulnerability [1]. vpblade connections to the hub must include bearings which are required to withstand the entire blade root bending moments and forces resulting from the blade’s interaction with the flow, while maintaining the pitching ability of the connection [4].
Infpblade systems, on the other hand, the bolt or stud-type connections between the blade root and 55
hub are required simply to hold the blades in place, giving a more structurally robust system. However,fp blades cannot adapt to individually-experienced flow conditions and, even invs operation, rotors withfp blades generally have a reduced energy capture and increased structural and fatigue loading characteristic than a rotor withvpblades [2] - the challenges associated with separated flow also apply to speed-assisted stall regulation. A further disadvantage is the overcapacity required within the generator to produce the 60
electromechanical torque that regulates rotor speed [5]. This unavoidable aspect ofvsstall regulated machines adds capital and mass to the turbine, increasing its cost. Because the blades are fixed in position, high loads can be experienced in parked mode past the cut-out velocity, requiring either a stronger mooring system or a nacelle-yaw capability.
In [6], Whitby and Ugalde-Loo compared the performance of a vs vp(pitch to feather) and a vs fp
turbine and control system, modelled in GH Tidal Bladed. They found that thevs vp pitch to feather system was more stable in power regulation and had lower loads across the entire operation, particularly in deep stall. Thevs vpalso had a higher energy capture. This is due to the reduction in flow states for which afp rotor can maximise efficiency compared to avpalternative.
Though there are disadvantages to consider, the robustness of fp blades is a significant advantage, 70
particularly for the tidal industry in which access limitation can augment down-time. In the wind industry, as reported in an evaluation of an extensive 10 year study of 350 MW worth of wind turbines [7], failures in the pitching mechanisms - considering pitch drives, bolted joints and bearings but not the blades themselves - were the driving factor for the 85% higher rotor failure rate of pitch regulated turbines than passive stall
regulated ones. 75
1.2. The Overspeed Method
The advantages of avoiding stall and having fpblades can be combined by regulating power withvs fp turbine which goes into overspeed, rather than stall, whenU∞r is exceeded. In such anosprturbine system,
Qemis reduced during power regulation, allowing Ω to increase, effecting an increase in the magnitude ofW, and a decrease inα. This technique, too, can be used to reduceCpin a predictable way. Detailed discussion 80
and design of the electromagnetic control aspects of turbines operated with speed control are out-with the scope of this paper. However, there is much literature on the topic of speed control, including the control schemes discussed in [6] and [8]. It would seem that apmsgregulated by pulse-width-modulation would be a reasonable solution. Within such a control scheme the requiredQem could be found from a look-up table according to the measuredQmechand Ω at each flow state. In [9], Winter suggests that Ω can be read from 85
an encoder and discusses the stability of such a control scheme.
As reported in [10], practical experiments withQem control in a wind tunnel showed that the method is physically possible, and highlighted some engineering challenges which need to be overcome if OSPR is to become practicable for tidal turbines. The operation of turbine rotors at high values of Ω results in high values of terminal voltage, and cavitation also becomes an issue of concern. Some turbine blades have Ct
90
characteristics in the higherλregion which would lead to very high thrust forces - this would also need to be addressed. Furthermore, centrifugal forces, which are proportional to the square of the Ω, become greater. With higher Ω values, such as in wind turbine operation, these forces can provide ”centrifugal relief” to the axial thrust force experienced by the blades [3] but, if causing large enough tensile stress in the radial direction, could also be a cause of, or contribution to, blade failure.
95
High voltages in a turbine require thicker electrical insulation, which adds size and mass, increasing deployment costs. High structural loads require stronger, more expensive station-keeping designs; likewise, high blade loads require more or stronger materials. As discussed in [11], cavitation on a blade degrades performance and can also cause extensive structural damage to the point of component destruction. Designing super-cavitating blades for turbines could, in theory, be an option; however, materials which can cope 100
with the energy release from imploding cavities are costly. None of these options contribute to cost reduction. Addressing these engineering challenges with cost-effective solutions is essential before OSPR can be successfully used in a turbine system.
Research in the field of blade designs and design methodologies for overspeed control has been undertaken and presented in such papers as [9, 12, 13, 14, 15] which discuss and work to mitigate some of the issues 105
discussed. A primary focus for blade development in these projects has been controlling the thrust forces as the tidal velocity increases. Though there has been discussion of the requirement for reduced maximum values of Ω [14], cavitation inception has not been discussed.
1.3. Aim of the design methodology
As concluded in [10], and demonstrated in [16], it would appear that these challenges may be overcome 110
with a more rapid drop in efficiency as Ω increases, avoiding rotational velocities of such values as to introduce cavitation and voltage problems.
research is to look into how the highlighted engineering challenges can be satisfactorily overcome with the 115
use of a blade design methodology specifically developed for this purpose. The goals of this methodology are to facilitate the design of blades which maintain high values of optimumCp, while resolving the discussed challenges by reducing the maximum rotor velocity. To achieve this, the methodology considers the criteria of importance in blade design noted in [17] - hydrodynamic, geometrical, structural and deployment site parameters - and also takes into account the proposed operating methodology. The inclusion of the control 120
method in the blade design methodology has been explicitly considered in work undertaken by National Renewable Energy Laboratory (nrel), reported in [18].
In general, it is possible to consider any blade design alteration, and/or to couple these with any other design alterations. There are two extremes of possible blade design methodologies - incremental and algorithmic. This methodology was developed with the aim to: remove much of the time and expertise 125
required in the incremental-alterations option; break down and open-up for viewing the “black-box” of the optimisation algorithm option; and produce information which provides some of the experiential knowledge gained by - and often limited to - the engineer and computer, respectively, in the alternative options. Alterations made by eye, randomly or incrementally would be exceedingly time-consuming, and a successful blade design may be long in the coming, unless the engineer has expertise or experience. On the other hand, 130
it is possible to write optimisation algorithms which consider a wide range of blade shapes and optimise based on a set of objectives and constraints. An advantage of this option is that, once the algorithm and implementation programme have been developed, the time required to produce a blade design can be significantly reduced.
In the former case, the engineer uses experience to by-pass many of the options an algorithm would trial, 135
based on an understanding of constraints and the relationships between inputs and outputs; however by the same necessary process of selection, the engineer may not consider possible options which could inform or improve the blade design. Furthermore, while either of these options can result in successful blades, it may not be standard for either process to output information on the impact of alterations to the blade design parameters. This, importantly, is experiential knowledge which would be useful in general for engineers 140
working on turbines, and in particular for the development or fine-tuning of both the blade in design, and those of future turbine installations.
The methodology herein described, then, will have some of the advantages of each of the two extreme alternative approaches, and some of the disadvantages. It can be seen, therefore, as a balance between the two, with the further advantage of outputting useful information which can be stored and shared. The 145
methodology has been specifically developed for the design of blades for use inosprtidal turbines, yet with alternative metrics could be easily applied in the design offpblades for use with a different power regulation method. This paper describes the development of this methodology.
2. Methodology
2.1. Outline of the design methodology
150
The basis of the design methodology is to:
• define design requirements and boundary conditions based on site characteristics and turbine configura-tion
• establish base case performance with an existing blade design, using a verified numerical design tool
• modify the design of the blades in a series of alterations to the geometrical parameters, applied with 155
function-based alterations
• simulate the performance of each new rotor design
• assess the impact made upon the suitability of the rotor for use inosprusing visual-numerical tools, building up a picture of the influence of each geometrical parameter
At this point in the development, the methodology is focused primarily on the hydrodynamic aspects of rotor design, and analysis of the structural properties of blade designs is limited to consideration of the
Ct-λ curve. Tidal sites, at this stage, are considered to have a range of inflow velocities, from cut-in to cut-out, and it is assumed that the turbine will be parked and/or yawed above these flow speeds; the effect of turbulence and the velocity and depth-altering effects of waves are not yet incorporated into the methodology. 165
No control system is implemented at this blade design stage, and therefore perfect transition from region I to III (Fig. 1) is assumed.
2.2. Performance Prediction Tools
As reported in [19], a Blade Element Momentum Theory (bemt) tool has been developed and verified against several sets of empirical data, including data obtained in tow tank tests previously undertaken within 170
this project; the greater detail of these tests was presented in [20]. This tool is considered to be valid for use in the design of tidal turbine blades and was used as such in this research.
Accuratebemtpredictions require appropriate aerofoil data - coefficients of lift, Cl, and drag, Cd, as they vary with the angle of attack,αr, of the fluid onto the aerofoil - as an input. Aerofoil performance is highly sensitive to the Reynolds number,Re, free-stream turbulence and the Mach number. The velocities involved mean that the latter is not an issue for tidal turbines. In the case of an aerofoil, the definition for
Reis given as
Re= ρW c
µ , (3)
where ρandµare the density and dynamic viscosity of the working fluid, and c is the chord length. As will be discussed, theRe appropriate for the full scale rotor analyses undertaken in this work were in the range of 1x10⁷. In the absence of physical test data at theseRe, the design code
XFoil, developed to give
175
computationally efficient and reasonable predictions of aerofoil performance, was used to obtainnrel s814 data at the appropriateRe. As reported by Drela in [21],XFoiluses several empirically-based corrections to predict aerofoil performance which, as the developers note in [21], are reasonable data until just after stall. As discussed in [19], thebemtcode used in this project includes a Viterna-Corrigan correction for more accurate modelling of post-stall behaviour. Previous examples of the use ofXFoilfor the prediction of aerofoil data 180
for tidal turbine applications exist extensively in, for example, the projects reported in [22, 23, 24, 25]. The choice of the criticalNcrit value for the eN method, used by XFoilto predict transition, was based on the recognition that tidal turbine rotors operate in a highly turbulent environment. As discussed in [26], to represent this large free-stream disturbance inXFoil, lower values of N can be set. According to the XFoilUser Primer [27], settingNcrit to a value of 1 or less tells the programme to bypass transition. The 185
sensitivity of theCl andCdpredictions toNcrit in the range betweenNcrit= 1 andNcrit= 2 was found to be very low; anNcrit value of 2 was therefore selected as a best-fit value, setting transition to occur quickly due to large values of free-stream disturbances.
Thebemtcode can be set to predict performance at any integer number ofλvalues spanning theCp-λ
curve from the extremelhsto the runaway point. Densely populated curves allowed accurate interpolation 190
of intermediate points with a linear method.
2.3. Design Operation and Requirements
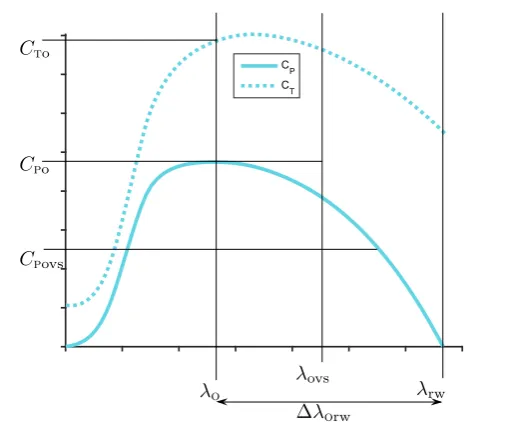
The relationship between the flow vectors and theCpand coefficient of thrust,Ct for a rotor design is commonly presented with performance curves such as those in Fig. 3. These characteristic curves describe rotor performance over the range of flow conditions between the fully-stalled condition on the farlhs, where 195
λ→0, to the fully feathered condition, also termed the runaway point, on the farrhs, whereλ=λrw.
2.3.1. Operation in Overspeed
Previous work [10] discussed the operation methodology forosprin terms of the flow regime and the required drop inCp(to cap power at the rated value) and thus the required Ω, as U∞increases fromU∞r to
The extent to whichCp must be reduced is also dependant on the rated wattage of the turbine. The following definitions are based on the commonly used terms forλ,Cp andCt, defined in, for example, [11] and [3]. The definition of the maximum efficiency,Cpo, is
Cpo=
Pr
1
2ρπR2U∞3r
(4)
and the efficiency required atU∞max, when the power regulation system is at its maximum operation point,
CPovs, is defined as 205
CPovs=
Pr
1 2ρπR
2U3
∞max
(5)
This operation point is herein termed the overspeed point. The Ω at each of these operation points can be defined in a rearrangement of Eq. (1):
Ωo=
λoR
U∞r
(6)
and
Ωovs=
λovsR
U∞max
(7)
A full description of the performance of a rotor operating in ospr also requires quantification of the thrust performance at the two key operating points. These are defined as:
Cto=
Tr
1 2ρπR
2U2
∞r
(8)
and
CTovs=
Tovs 1 2ρπR
2U2
∞max
(9)
The methodology requires the value ofPr(or alternativelyU∞r) as an input. Tovsandλovsare dependent on the blade shape and the input set design variable,U∞max. The values ofTr andλoare blade design variables, outputs of the methodology.
210
The operation range was defined as the range of flow conditions within which optimum point tacking -normal turbine operation - and power-regulation operation would exist. The local flow conditions across the entire operation range were then determinable from Eq. (1), noting that in the range 0≤U∞≤U∞r, the operation would be held at the optimum point,λo, and in the range U∞r≤U∞≤U∞max, the operation would move from the optimum to the overspeed point,λo toλovs.
215
2.4. Blade design parameters
2.4.1. Base Case Blade
It was necessary to define a base case blade design from which to make geometrical alterations, and from the performance of which to measure improvements. An existing blade design ofnrel s814 aerofoil section was chosen; thenrel s814 was designed to have a high maximum lift, has the structural advantage 220
of being relatively thick, and its insensitivity to surface roughness lends it to use in the biologically diverse and potentially sediment-carrying marine environment [28]. The base case blade geometry is detailed in Table 1, in which the blade length and chord geometries are expressed as a fraction of the total blade length,
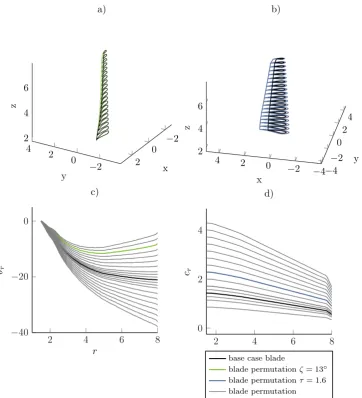
Lb, giving a non-dimensionalised, scalable blade design, independent of hub size. Illustrations of the base case blade design are included in Fig. 4a) and b); Fig. 4 c) and d) include the base case twist and chord 225
Cto
Cpovs
Cpo
∆λorw
[image:8.595.170.425.145.356.2]λo λovs λrw
Figure 3:bemtprediction of performance curves of base case, full-scale rotor, showing position of significant operating points and metrics of performance for overspeed power regulation
Table 1: Geometry of base case blade design
r/Lb(−) cr/Lb(−) θr(◦)
0 0.22 0
0.1 0.21 -4.9
0.2 0.21 -10.6
0.3 0.19 -14.2
0.4 0.18 -16.7
0.5 0.17 -18.3
0.6 0.16 -19.2
0.7 0.14 -19.9
0.8 0.13 -20.4
0.9 0.12 -20.8
1 0.09 -21.1
[image:8.595.104.491.484.692.2]Table 2: The blade design parameters, manner and range of alterations made in the Stage One design changes
Parameter Alteration
Manner Range
β Setting angle altered −7◦≤δβ≤13◦
θr
Proportionally linear alterations applied from zero at
root toζat tip −17
◦≤ ζ≤17◦
cr Multiplied by scaling factorτ 0.1≤τ≤3
Stage Two Alterations
cr
Proportionally linear addition to chord length, from zero at root to T·ctipat tip
0.3≤T≤1.3
cr
Parabolic addition to chord length, from zero at root toψ·croot at tip to zero at tip, with T = 0.5
0.2≤ψ≤1.8
Stage Three Alterations
θr Proportionally linear alterations applied from zero at
root toζat tip −1
◦≤ ζ≤17◦
2.4.2. Blade Design Parameter Alterations
The major aspects of blade design which were set as variable parameters in the development of this methodology were the blade pitch,β, the twist distribution,θrand the chord distribution,cr. The definitions of these parameters are indicated in Fig. 2.
230
Each parameter was altered with functions as described in Table 2, giving series of blade designs, each with discrete alterations made, first over the range and in the manner described in the Stage One alterations section of Table 2. Following analysis of these blade designs, a second set of targeted function-based alterations were made to the chord distribution, as detailed in the Stage two alterations section of Table 2.
Fig. 4 illustrates the types of design changes made, giving an example of one blade iteration with a 235
proportionally linear twist alteration and one with the chord scaled up.
2.5. Overspeed Power Regulation Performance Metrics
Fig. 3 shows thebemtprediction of the Cp andCt performance of the base case rotor. This was used to identify the characteristics of rotor performance which were advantageous for operation inospr, and those which were detrimental. Important features of this figure are:
240
• The optimum operating point where λ is such that the maximum efficiency, Cpo, occurs. At this operating point,λis defined asλo andCt asCto.
• The runaway point, where efficiency drops to zero andCPrw,CTrwandλrw occur.
• And, between these two, some position whereCPovs and thereforeCTovs,λovsand Ωovs occur.
As Eq. (5) indicates, the value ofCPovs, and thus ofλovs,CTovs and Ωovs, depend on the site and turbine 245
configuration.
As discussed, a steeply negative gradient on therhsof theCp-λ, to give the required drop inCp with a reduced increase inλ, was the key design requirement. Improvements in this characteristic would result in rotor performance curves of an increasingly appropriate shape forospr, avoiding high rotational velocities. The metric used to measure this - and therefore the primary metric - was ∆λo rw. A second metric was 250
−4 −2
0 2
4
−4 −2 0 2 4 2 4 6
y
x
z
b)
−2 0 2 4
−2 0 2 2
4 6
y x
z
a)
2 4 6 8
0 2 4
r cr
d)
base case blade
blade permutationζ= 13◦ blade permutationτ= 1.6 blade permutation
2 4 6 8
−40
−20 0
r θr
[image:10.595.120.483.200.599.2]c)
state. Both these metrics were required as the former gave insufficient information to ascertain whether cavitation would occur, but the latter gave no clear indication of the effect of a blade parameter change on theshape of the performance curve. As the value ofCpo is so influential on the annual energy output from a turbine, it was of benefit in this blade design process to gain an appreciation of blade design alterations 255
which cause changes in the maximum efficiency the rotor could achieve. Cpo was therefore set as the third metric, improvements in which were measured as positive changes from the base case. Ctowas set as the fourth metric, providing information on the effect of blade design changes on the thrust characteristics. This is a useful metric asCt may be a limiting criterion; increases from the base case value in this metric were therefore defined as negative effects.
260
This reasoning gave a set of four performance metrics to be used in this design methodology:
• ∆λo rw
• Ωovs
• Cpo
• Cto. 265
A general formula was used to calculate change in each metric,M, between the base case blade design value,Mbc, and that of each discrete design iteration,Mj. This formula took the form
M = Mbc−Mj
Mbc
(10)
for all cases except forCpo, for which it had the form
M = Mj−Mbc
Mbc
. (11)
These fractional values were then expressed as percentages. The impact of blade design alterations could then be measured as the percentage change in the defined metrics. Setting the equations so as to define a positive change as an improvement, and negative change as indicating detrimental effects facilitated the sensitivity analysis impact assessment described in Section 2.8.1.
2.6. Cavitation
270
2.6.1. Method of cavitation analysis
Cavitation, as discussed in [11], is likely to occur in a fluid in which minute nuclei - groups of molecules of gas or vapour - encounter a reduction in pressure of the surrounding fluid which allows their growth into fully-formed cavities. Though it is a simplification to state that this occurs when the local fluid pressure,pl, on a blade reaches the vapour pressure of the fluid,pv, comparison between these two values is seen to be a 275
fair measure of the likelihood of cavitation inception, should the flow environment continue in this state. This method of cavitation inception analysis has been previously used in, for example, the projects reported in [23, 24, 29], in each of which verification by comparison to experiments presented in the former has shown the method to be appropriate. Furthermore, this was the approach taken in blade design projects presented in [30]. This was therefore the method adopted in the present research.
280
As in [11], the local pressure distribution across a 2D aerofoil can be expressed with the coefficient of local pressure, defined as
Cpres=
pl−por 1 2ρW
2 r
(12)
of which the minimum negative value - that is, the coefficient of the maximum suction pressure - is termed
A dimensionless cavitation number for a blade section at radiusrcan be defined, again as in [11], [31] and [24], as:
σr=
por−pv 1 2ρWr2
(13)
where 1 2ρW
2
r is the dynamic pressure, and the absolute hydrostatic pressure,por, is defined as
por=patm+ρghr (14)
The hydrostatic pressure will be at its smallest value when a blade is in the top dead-centre position, meaning that if cavitation occurs on a rotor, it will occur first on a blade at this position.
285
As Eqs. (12) and (13) show, if the minimum negativeplron a blade section is equal topv, thenσr will be equal to the minimum negative value ofCpresr. Therefore, an inception cavitation number can be defined as
σir=−Cpres minr (15)
Assessment of cavitation inception on the blade designs therefore required comparison ofσrandσir, for each blade element, at each operation point. TheCpres, mindata required for this analysis was output from the aforementionedXFoilanalyses, as a function ofα.
2.7. Full scale base case
2.7.1. Boundary Conditions
290
From the non-dimesionalised base case blade design, a full scale base case was required to be developed. Because this design methodology considers the turbine operation technique a meaningful cavitation analysis would require, as indicated by the foregoing discussion, information on:
• the site velocity profile
• the turbine hub depth 295
• the turbine rating
• blade length and hub radius,Rh
To define these boundary conditions, a full-scale turbine scenario was created in which a turbine with a radius,R, of 8 m was sited in a flow field of maximum flow speed of just over 6 knots, at a shaft depth of 20 m. A rated flow speed of 1.28 knots was set, allowing the optimum efficiency of the turbine to be determined 300
from Eq. (4), and giving chordRein the range of 1x10⁷. The value used forp
v was 1374.1Mpa, taken from [32] for seawater at 12◦C. The remaining operating conditions were determined as previously discussed. The blade length was determined based onRandRh. Rhwas set as 2 m which may seem rather large, but initial developments of the methodology at the prototype scale indicated that large blade root chords would be required to meet the design requirements and there had to therefore be room on the hub for large blade root 305
sections. The blade root pitch setting was optimised forCp for these conditions, giving the best case scenario for the base case blade.
A further simplifying condition assumed for the development stage of this work was that the flow onto the turbine was at all times un-yawed and that free-stream disturbances would have no effect on the flow velocities or angles.
310
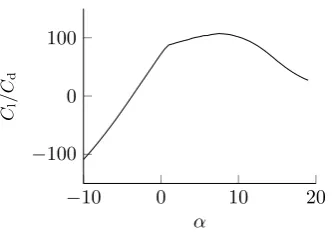
2.7.2. Aerofoil Data
Defining the flow regime and turbine configuration, as discussed in Section 2.2, allowed calculation of the appropriateRe from Eq. (3) so that relevant aerofoil data could be obtained. Fig. 5 shows the aerofoil data input to thebemttool. As the figure shows, the optimumαfor this aerofoil at thisRe is 7.5◦; blade sections operating at thisαwill develop the greatest lift to drag force ratio.
−10 0 10 20 −100
0 100
α
Cl
/C
[image:13.595.216.383.107.223.2]d
Figure 5: Plot ofCl/CdwithαatRe= 1·107
2.8. Visual and Numerical Performance Analysis Tools
Several component tools were developed in the design of this methodology, which provide visual feedback based on numerical outputs from the analysis of each blade design alteration.
2.8.1. Design Space Analysis
Though the alterations to the blade design were initiated simultaneously with the alteration functions, 320
each blade design alteration entailed a discrete change from the base case, allowing a sensitivity analysis to be undertaken with the One-at-a-Time (oaat) method [33]. The impact of each blade design alteration on the suitability of the rotor for use inosprwas then measured using theosprperformance metrics. Initial assessments of the influence of each parameter informed the alteration range which was reasonable for each parameter - these decisions were based primarily upon acceptable levels ofCp andCt, but also on the basic 325
practicality of the blade design - e.g., designs with overlapping root chords were deemed impracticable. A design space analysis method was developed to provide numerical-visual feedback of the impact on each performance metric. A design sub-space was required for each blade design parameter altered, in which the percentage change in the metrics was marked on a series of stackedy axes. The alteration range, as listed in Table 2, was set along a common xaxis. Plotting the impact of one-at-a-time changes alongxaxes allowed 330
the impact of individual parameter alterations to be studied, while at the same time intra-parameter trends and gradients over the alteration range were immediately obvious. Three design sub-spaces were created for the first stage blade design analyses - one for each parameter changed. These three spaces were stacked horizontally on a set of common y axes, giving the overall design space, allowing further comparisons to be drawn on an inter-parameter level. The inclusion of a conditional statement resulted in a variation in the 335
marker type , indicating whether cavitation was predicted in each instance. The design space of the first stage alterations is shown in Fig. 6.
2.8.2. Cavitation Analysis
The values of σir andσr for each blade element were calculated and compared numerically for each blade design. As their definitions in Eqs. (13) and (15) indicate, these values were a function ofλ; asλ
340
increased, for each blade element,σrdecreased towards the value ofσir. Plotting these two cavitation-related numbers againstλ, for elements all along the blade, gave a more detailed visual tool to assess the occurrence, location(s) and extent of cavitation on the blade across the entire operating range. σir was plotted for every element, giving a dense band of cavitation envelopes, beneath each strand of which cavitation would occur on the relevant blade section. Theσr curves for the tip and root elements were plotted, along with those for 345
the elements at increments of 10% of the blade length. For each blade iteration, comparison of these plots indicated whether the design alterations induced more or less cavitation along the blade.
2.8.3. Plots ofαr anddQr againstr
−40 −20 0 20
%
CP
o
−40 0 40
%
CT
o
−7 −3 0 3 7 11 −50
0 50
δβ(◦)
%
Ωo
vs
permutation, cavitating permutation, cavitation-free base case value
−200 40 80
%
∆
λo
rw
a) b) c)
−15−10 −5 0 5 10 15
ζ(◦)
1 1.5 2 2.5 3
[image:14.595.76.520.105.415.2]τ
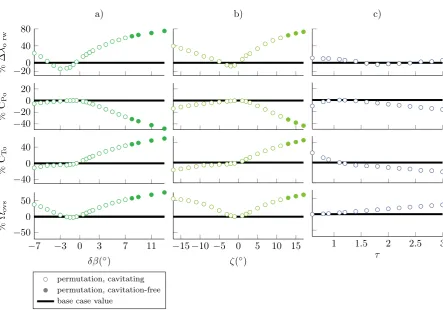
Figure 6: Design Space analysis, showing the results of the sensitivity analysis ofosprperformance metrics to first stage blade design parameter alterations to: a) the pitch setting, where +veδβchanges indicate a root pitch which sets the root leading edge closer to the tidal flow vector; b) the twist distribution, where +veζvalues indicate a blade with less twist along the span; and c) the chord distribution, whereτvalues greater than 1 indicate a blade with larger chord and cross-sectional area values.
αr and the torque developed by each blade section,dQr. This was achieved using plots of the distribution ofαr anddQr across the blade, at the optimum and overspeed operating points. Analysis of these plots allowed important or influential sections of a blade design to be identified.
2.9. Stage Two Design Alterations
Analysis of the results from the Stage One design alterations showed that a Stage Two design process, 355
using the same methodology, would be required to make alterations with which the requirement for further improvements in any performance metrics could be worked towards. Information from analyses of the first stage parameter alterations was fed forwards to this second stage, allowing for insightful design alterations.
3. Results and Discussion
3.1. Stage One
360
3.1.1. Design Space Results
The design space results from the first stage of blade design parameter alterations are presented in Fig. 6. For reference, Fig. 4 illustrates examples of the kind of design alterations made to produce these results. These plots showed that there were only seven blade permutations which eradicated cavitation, four resulting from alterations toβ, and three from alterations to θr. Each of these blade designs had significantly reduced 365
The sensitivity analysis showed that the primary metric, ∆λo rw, was least sensitive to the applied cr alterations. For the same degree of alteration, the sensitivity of ∆λo rw was greater to the alterations applied toβ than to those applied toθr, having a greater rate of change in the former. As Fig. 2 shows, positive additions or alterations, respectively, to the twist or pitch reduced the angle between the tidal flow and the 370
chord line at more blade stations, pointing the leading edge of the aerofoil section towards the incoming flow; in both cases this gave a positive impact on ∆λo rw. The finding that blade designs with alterations of positiveζ andδβvalues resulted in a more rapid feathering of the blades asU∞ increased was therefore to
be expected. However, it was possibleto achieve slightly greater impact on this performance metric by large alterations toθr than by the largest alterations applied toβ. Alterations of more than 13◦toβ resulted in a 375
blade with such poor efficiency that no power regulation was required at all; giving a limit to the possible positive alterations toβ.
These two parameter alterations were also seen to have the greatest impact upon the second metric, Ωovs. Predicted cavitation inception was accordingly eradicated by alterations ofδβ before alterations of
ζ by the same degree. Reflecting on the resultingαr for each blade section from these alterations, this is 380
not surprising.The improvements in the first two metrics made by alterations toβ andθcame at the great expense of reductions inCpo. The impact of altering β was greatest, with the consequence that the first cavitation-free blade permutations - withβ = 8◦ andζ= 13◦ - had a similarCpo, changed by -31.8◦ and -32.6◦respectively from the base case. As heα−rplots indicated that this decrease inCpo occurred due to the resultingαfor each blade station moving away from the optimum value, at which lift force per drag 385
force is maximised.
A significant, but reduced impact was made in this metric by scaling alterations made to the chord length. This impact was due to the increase in the lifting surface associated with an increase in chord length, and, as the plots of αanddQshowed, an increase in the values of αoccurring over the blade, each of which increased the torque produced.
390
The performance metricCto was most sensitive to changes inβ, its sensitivity having, again, a steeper gradient in response toδβalterations than eitherζ or scaled-cr alterations. Alterations toβ made in the positive sense reducedCto, whereas those made in the negative sense had a detrimental effect on this metric. This was due to increases in αr along the blade, resulting in an overall greater contribution to force in the axial direction (along thexaxis). That the metricCtowas sensitive, though to a lesser degree, to the scaling 395
alterations incr was, as for the impact onCpo, due to the increase in the lifting surface producing greater lift and drag forces, resulting in a greater or lesser contribution to force in the axial direction for vales ofτ
smaller or greater than 1, respectively.
3.1.2. Cavitation Results
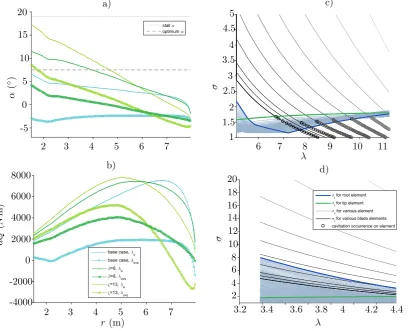
Fig. 7 c) shows the cavitation analysis plot for the full-scale base case design. The vertical decrease inσr 400
in the region 0≤U∞≤U∞maxcan be seen in this figure, occurring atλo≈5; no cavitation was predicted in this operation range. Cavitation was, however, predicted to begin occurring at the tip of the blade, at roughlyλ= 6.1. The plot showed that cavitation incidence occurred at lower blade positions asλincreased. An interesting results from the plot is that afterλof 7.5, the tip of the blade was no longer the position with highestσir, its value being exceeded by those of elements in the region of the root. However, because the 405
σr values of the upper elements were very low, and those of the lower elements were comparatively high, cavitation continued to be more of an issue for the former than for the latter.
Cavitation was a consistent flow behaviour on most of the rotors in the first stage of design changes. As previously noted, seven blade designs were successful in mitigating cavitation inception: those with parameter changes ofδβ≥8◦ andζ≥13◦. The cavitation plot of the latter blade permutation is shown in Fig. 7 d). 410
However, as indicated in the design space, these alterations also resulted in a significant drop inCpo and increase inCto, neither of which are useful rotor performance characteristics.
Through comparisons between this method and experiments it was found, in [23], that the use of XFoil to generate theCpres data was a reliable method for preliminary design stages. It is important to note, though, that it was also found that this over-predicted cavitation on the upper surface of the aerofoil; this method is 415
a) c)
d)
b) λ
λ r(m)
α
(
◦ )
dQ
(N
m)
σ
σ
2 3 4 5 6 7
2 3 4 5 6 7 6 7 8 9 10 11
3.2 3.4 3.6 3.8 4 4.2 4.4
20
15
10
5
0
-5
8000
6000
0 4000
2000
-2000
-4000
20 18 16 14 12 10 8 6 4 2 5
4.5
4
3.5
3
2.5
2
1.5
[image:16.595.91.504.237.568.2]1
3.1.3. αr anddQr Plot Results
Plots of localαanddQfor the base case blade, along with those of the non-cavitating blades with design alterationsβ = 8◦ andζ= 13◦, are shown in Fig. 7 a) and b). The plots ofαrin Fig. 7a) showed that, atλo, the mid sections of the altered blade designs were operating closer to the optimumαof 7.5. This gave rise to 420
the increase indQseen for the mid-sections of these blades in Fig. 7b). The plots also showed that, due to the slower Ω at the optimum operating point, the root to mid sections of the altered blades were operating at much higher values ofα, yet had not exceeded the stall angle, which (in the steady flow assumed) would ensure an equally stable working flow environment on these altered blade designs as on the base case blade.
Although the cavitation analysis for the blade of ζ= 13◦design showed that no cavitation was predicted, 425
the highly negativeαtip shown in Fig. 7a) was indicative of how close the blade tip was to cavitating - a result reflected, as shown in Fig. 7d), in the proximity of the relevantσr andσircurves in this blade design’s cavitation plot atλovs.
3.2. Further stages of design alterations
Feedback from the Stage One design alteration process indicated that scaling up the size of all the aerofoils 430
by the same factor had a similar scaling-type effect on theα,dQover the blade. Considering the effect on thedistributionof these parameters had by distribution alterations to the twist, the Stage Two alterations detailed in the relevant rows of Fig. 4 were made to the distribution ofcr. Proportionally linear increases were made to the chord length, increasing the chord toT, a proportion of the original chord tip length. To make use of theαrvalues close to optimum on the blade mid-sections, thecrdistribution was altered with a 435
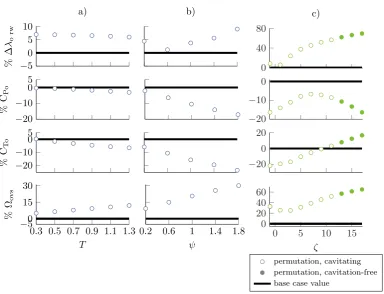
parabolic added-chord function which peaked at values ofψ, a proportion of the original root chord length. It was possible in this way to have greater control overαacross the blade, and thus to effect an altered distribution ofdQ. This resulted in a similar impact in the metrics with - as integration of thecrdistribution terms showed - a similar overall increase in the blade area but, significantly, a reduced increase in the blade root chord length, leaving more room between blade roots. The design space result of this are presented in 440
Fig. 8 a) and b).
In a series of Stage Three Alterations, blades with the chord distribution altered with T = 0.5 andψ= 1.4 were coupled with alterations toθr of a range ofζvalues. As Fig. 8 c) shows, predicted cavitation inception ceased whenζreached 13◦ as before, but, as Fig. 9 indicates,Cpo was 42.4%, rather than the 32.0% of the Stage One blade. Such combined alterations as these were therefore found to be successful in continuing to 445
allow cavitation-free regulation of power by overspeed while reducing the negative impact onCpo.
Fig. 9 shows the power and thrust performance of key blade designs as progressive improvements were made with regards to suitability forospr. Comparison between the curves show that the indications of altered rotor performance given by the analysis tools had indeed been achieved. The operation of the rotor was been shifted towards lowerλvalues, with a more rapid drop-off inCpon therhs. And the drop inCpo 450
from the base case to the blade ofζ= 13◦ design was somewhat mitigated by alterations to thecr. The value of Cto was also affected, in a similar manner toCpo, suggesting that design alterations which improve
Cpo will also increaseCto- an effect which may become a limiting criterion.
4. Conclusion
A blade design methodology for overspeed power regulated tidal turbine rotors has been developed, which 455
considers the operation site and power regulation methodology within the design requirement-based boundary conditions. Blade design parameter alterations have been made and assessed using three visual-numerical analysis tools: a design space analysis based on overspeed performance metrics; a full-blade cavitation analysis over the entire operation range expressed with plots of converging cavitation and pressure curves; and plots of local angle of attack and torque distribution across the blades.
460
−20 −10 0 5
%
CP
o
−20 −10 0 5
%
CT
o
0.3 0.5 0.7 0.9 1.1 1.3 −50
15 30
T
%
Ωo
vs
−5 0 5 10
%
∆
λo
rw
a) b)
0.2 0.6 1 1.4 1.8
ψ
−20
−10 0 0 40 80
c)
−20 0 20
0 5 10 15 0
20 40 60
ζ
[image:18.595.108.493.130.424.2]permutation, cavitating permutation, cavitation-free base case value
Figure 8: Design Space analyses of: a) and b) targeted alterations tocr; c) combined alterations tocr andθr.
0 2 4 6 8 10 12
0 0.2 0.4
λ
CP
a)
0 2 4 6 8 10 12
0 0.2 0.4 0.6 0.8
λ
CT
b)
base case ζ= 13◦
β= 8◦ T = 0.5,ψ=1.4 ,ζ= 13◦
[image:18.595.98.502.494.682.2]efficiency. While changes to the cross-sectional area of the blade via scaling and distributional alterations to 465
the chord length have a lesser effect on the performance, these changes can be coupled with alterations to twist distribution to bring the optimum efficiency back towards acceptable levels without detrimental impact on the cavitation behaviour. Such coupled changes also affect the maximum coefficient of thrust and the effect this has on the turbine will need to be taken into account.
Cavitation analyses of the base case and altered blade designs have indicated that cavitation inception is 470
an issue which should be considered, and which, depending on the aerofoil section and boundary conditions -site velocity profile and depth and turbine configuration - and may be a main driver for speed-limiting design alterations to blades for use in OPSR.
4.0.1. Insight Gained from Analysis Tools
Analysis of the first stage of design alterations showed that several of the discrete parameter alterations 475
may bring about improvements in theospr performance metrics. The results from the tools used also suggested that localised parameter alterations coupled with initial discrete alterations may mitigate some of the detrimental effects from the initial alterations. For example, it was identified on inspection ofαr−r plots such as those in Fig. 7 that blade tips often had significantly lowerαr than the lower blade elements, resulting in the greater proximity, or cross-over of theσrandσircurves for the tip elements, and leading to 480
near or post-cavitation inception conditions. This finding suggested that localisedθr alterations could be made to bringαr to a less negative value at the blade tips. Use of the design methodology would enable the possible ramifications of such design changes to be analysed and compensated for with further insightful design alterations.
4.1. Future Work
485
The methodology will be applied to a blade design case study with specific design requirements setting the boundary conditions.
Verification exercises will be undertaken with tank tests of a prototype-scale blade, to confirm that altered blade designs perform as expected.
The methodology does not yet contain a structural integrity analysis. Further development of the 490
methodology will take account of this, most likely with quasi-static structural integrity analyses. Nor has the effect of aerofoil shape been addressed; in future implementations of the methodology this will be investigated.
Inclusion of free-stream disturbance in the deployment environment would allow deeper analysis of the potential of this method of power regulation.
Acknowledgment
495
Grateful acknowledgements go to the wider Strathclyde and Dalhousie teams for valuable insight and help. This work has been funded by EPSRC through SuperGen Phase3, UKCMER. Further funding from UKSI, OERA and SDI has allowed the on-going collaboration between our two research groups. We would like to thank all of our funding bodies for their support.
References
500
[1] F. D. Bianchi, H. De Battista, R. J. Mantz, Wind turbine control systems. Principles, modelling and gain scheduling design., Vol. 26, Springer-Verlag London Limited, 2007.
URLhttp://dx.doi.org/10.1007/1-84628-493-7{_}2
[2] T. Ackermann, L. S¨oder, An overview of wind energy-status 2002, Renewable and Sustainable Energy Reviews 6 (1-2) (2002) 67–128.doi:10.1016/S1364-0321(02)00008-4.
505
[3] T. Burton, D. Sharpe, N. Jenkins, E. Bossanyi, Wind energy handbook, John Wiley & Sons Ltd., Chichester, 2001. URLhttp://books.google.com/books?hl=en{&}lr={&}id=dip2LwCRCscC{&}oi=fnd{&}pg=PT14{&}dq=Wind+Energy+Hand+ Book{&}ots=IbCMSqEsHb{&}sig={_}{_}fGWH60ILZ-30hDixeqjp7bVmU
[4] J. F. Manwell, J. G. McGowna, A. L. Rogers, Wind Energy Explained, John Wiley & Sons Ltd., Chichester, 2009. [5] R. Pena, J. Clare, G. Asher, Doubly fed induction generator uising back-to-back PWM converters and its application to
510
[6] B. Whitby, C. E. Ugalde-Loo, Performance of pitch and stall regulated tidal stream turbines, IEEE Transactions on Sustainable Energy 5 (1) (2014) 64–72. doi:10.1109/TSTE.2013.2272653.
[7] E. Echavarria, B. Hahn, G. J. W. van Bussel, T. Tomiyama, Reliability of Wind Turbine Technology Through Time, Journal of Solar Energy Engineering 130 (3) (2008) 031005.doi:10.1115/1.2936235.
515
[8] Z. Zhou, W. Knapp, J. MacEnri, H. C. Sorensen, E. Friis Madsen, I. Masters, P. Igic, Permanent magnet generator control and electrical system configuration for Wave Dragon MW wave energy take-off system, 2008 IEEE International Symposium on Industrial Electronics (2008) 1580–1585doi:10.1109/ISIE.2008.4677255.
URLhttp://ieeexplore.ieee.org/lpdocs/epic03/wrapper.htm?arnumber=4677255
[9] A. Winter, Speed Regulated Operation for Tidal Turbines with Fixed Pitch Rotors, in: OCEANS 2011, Waikoloa, 2011, pp.
520
1–8.
[10] K. Gracie, R. E. Murray, C. M. Johnstone, D. A. Doman, M. J. Pegg, Fixed-Pitch Blades for Passive-Feather Power Regulation of Second-Tier Site Tidal Turbines, in: EWTEC, Aalborg, 2013.
[11] J. S. Carlton, Marine propellers and propulsion, second edi Edition, Elsevier Ltd., Oxford, 2007.
[12] C. Freeman, J. A. Teixeira, F. Trarieux, R. Ayre, Design of a gravity stabilised fixed pitch tidal turbine of 400kW, 8th
525
European Wave and Tidal Energy Conference, Uppsala, Sweden, 2009 (2009) 376–383.
[13] A. Winter, T. Tryfonas, A constrained optimisation process for the design of tidal turbine blades with experimental validation (3).
[14] F. Biskup, M. Arnold, P. Daus, R. Arlitt, M. Hohberg, Effects of Rotor Blade Tip Modifications on a Tidal In-Stream Energy Converter – Voith HyTideR, in: EWTEC, Aalborg, 2013.
530
[15] R. Starzmann, N. Hirsch, M. Baldus, S. Scholl, A stepwise approach towards the development and full-scale testing of a marine hydrokinetic turbine (2013) 1–6.
[16] K. Gracie, T. Nevalainen, C. Johnstone, R. Murray, D. Doman, M. Pegg, Impact analysis of blade shape on performance of tidal turbine for passive feather power regulation. Poster presentation, in: International Conference on Ocean Energy, Halifax, 2014.
535
[17] W. Batten, a.S. Bahaj, a.F. Molland, J. Chaplin, Hydrodynamics of marine current turbines, Renewable Energy 31 (2) (2006) 249–256.doi:10.1016/j.renene.2005.08.020.
URLhttp://linkinghub.elsevier.com/retrieve/pii/S0960148105002314
[18] M. J. Lawson, Y. Li, D. C. Sale, Development and verification of a computational fluid dynamics model of a horizontal-axis tidal current turbine, Proceedings of the ASME 2011 30th International Conference on Ocean, Offshore and Arctic
540
Engineering (October).
[19] D. A. Doman, R. E. Murray, M. J. Pegg, K. Gracie, C. M. Johnstone, T. Nevalainen, Dynamic testing of a 1/20th scale tidal turbine, in: AWTEC, Tokyo, 2014.
[20] D. A. Doman, R. E. Murray, M. J. Pegg, K. Gracie, C. M. Johnstone, T. Nevalainen, Tow-tank testing of a 1/20th scale horizontal axis tidal turbine with uncertainty analysis, International Journal of Marine Energy 11 (2015) 105–119.
545
doi:10.1016/j.ijome.2015.06.003.
URLhttp://dx.doi.org/10.1016/j.ijome.2015.06.003
[21] M. Drela, XFOIL: An analysis and design system for low Reynolds number airfoils (1989). doi:10.1007/
978-3-642-84010-4{\_}1.
URLhttp://link.springer.com/chapter/10.1007/978-3-642-84010-4{_}1
550
[22] D. V. Val, L. Chernin, Reliability-Based Design of Rotor Blades in Tidal Stream Turbines, in: European Wave and Tidal Energy Conference, Southampton, 2011.
[23] a. F. Molland, a. S. Bahaj, J. R. Chaplin, W. M. J. Batten, Measurements and predictions of forces, pressures and cavitation on 2-D sections suitable for marine current turbines, Proceedings of the Institution of Mechanical Engineers, Part M: Journal of Engineering for the Maritime Environment 218 (2) (2004) 127–138.doi:10.1243/1475090041651412.
555
URLhttp://pim.sagepub.com/lookup/doi/10.1243/1475090041651412
[24] H. C. Buckland, I. Masters, J. a. Orme, T. Baker, Cavitation inception and simulation in blade element momentum theory for modelling tidal stream turbines, Proceedings of the Institution of Mechanical Engineers, Part A: Journal of Power and Energy 227 (4) (2013) 479–485.doi:10.1177/0957650913477093.
URLhttp://pia.sagepub.com/lookup/doi/10.1177/0957650913477093
560
[25] R. Evans, R. McAdam, M. Royle, L. Mcewen, Optimum geometry for axial flow free stream tidal turbine blades, 10th European Wave and Tidal Energy Conference (EWTEC 2013), Aalborg, DK, 02. - 05. Sep 2013.
[26] J. L. V. Ingen, The eN method for transition prediction. Historical review of work at TU Delft, in: Fluid Dynamics Conference and Exhibit, no. June, Seattle, 2008, pp. 1–49.
[27] M. Drela, H. Youngren, XFOIL 6.9 User Primer (2001).
565
[28] D. M. Somers, The S814 and S815 Airfoils October 1991 — July 1992 The S814 and S815 Airfoils (December).
[29] W. Batten, a.S. Bahaj, a.F. Molland, J. Chaplin, The prediction of the hydrodynamic performance of marine current turbines, Renewable Energy 33 (5) (2008) 1085–1096.doi:10.1016/j.renene.2007.05.043.
URLhttp://linkinghub.elsevier.com/retrieve/pii/S0960148107002133
[30] R. F. Nicholls-Lee, S. R. Turnock, S. W. Boyd, Simulation based optimisation of marine current turbine blades, International
570
Conference on Computer and IT Applications in the Maritime Industries (2008) 314–328. URLhttp://eprints.soton.ac.uk/id/eprint/51108
[31] a.S. Bahaj, a.F. Molland, J. Chaplin, W. Batten, Power and thrust measurements of marine current turbines under various hydrodynamic flow conditions in a cavitation tunnel and a towing tank, Renewable Energy 32 (3) (2007) 407–426.
doi:10.1016/j.renene.2006.01.012.
575
[32] 26th ITTC Specialist Committee on Uncertainty Analysis, ITTC - Recommended Procedures 7.5-02-01-03. Fresh water and seawater properties, Tech. rep., International Towing Tank Conference (2011).
URLhttp://ittc.sname.org/CD2011/pdfProcedures2011/7.5-02-01-03.pdf
[33] D. M. Hamby, A review of techniques for parameter sensitivity analysis of environmental models., Environmental monitoring
580