Lisbon, Portugal, 9-12 September 2013
MULTIVARIATE STATISTICAL ANALYSIS FOR DAMAGE AND
DELAMINATION DETECTION IN COMPOSITE STRUCTURES
David Garcia*1, Irina Trendafilova2 1
Department of Mechanical and Aerospace engineering University of Strathclyde, Glasgow, United Kingdom
2
Department of Mechanical and Aerospace engineering University of Strathclyde, Glasgow, United Kingdom
Keywords: Structural Health Monitoring, Delamination, Composite materials, Singular Spectrum Analysis.
Abstract. The article is devoted to the analysis of the vibration response of composite
1 INTRODUCTION
Composite materials are at the forefront of the contemporary research because of their wide range of industrial applications. Structures made of composites materials have an increasing importance in different industries like civil engineering, mechanical and aerospace engineering and energy among many others. One of the most interesting properties that structures made of composites possess is their very large stiffness to weight ratio. Composites present an excellent combination of high strength and stiffness with low weight. This property among many others as versatility to adapt different shapes, protection against corrosion, gives the possibility to look for new engineering challenges and replace the traditional materials with composites. Composite laminates are widely used in different sectors due to their easy manufacture and efficiency and because of their versatility in the orientation of the fibers. Composite laminates are made of carbon or glass fibers in their majority, and a matrix commonly an epoxy resin, which is responsible for the hardening of the material. This makes the laminate unique as a structure.
Despite of their benefits composite materials have their disadvantages. Due to their layered nature and the interaction between both materials, fibers and matrix, composite materials are prone to different failures modes, the most common of them being delamination, which can cause irreversible damage. This failure causes the separation of the layers and induces significant loss of mechanical strength. Delamination is probably the most dangerous defect in composite materials because it can appear suddenly without any notice and it keeps growing to collapse the whole structural member. Composite materials with the defect of delamination can lose up to 60% of their stiffness and still remain visibly unchanged. For this reason a monitoring programme is a must for most composite structures. It plays a significant role not only in the life extension of the structure but also makes the structure more efficient by increasing its safety and reducing expensive inspections and their related costs.
For this reason with the help of vibration-based structural health monitoring (VSHM) methods can be develop a dynamical model which describes the vibratory behaviour of the structures made of composites [1-3]. VSHM are one of the popular ones. They can be divided in two main groups model based and non-model based ones [2].
There is no general approach towards modelling the vibratory behaviour of composite structures due to the difficulty to model the nonlinearities of the material. Nonlinear material behaviour in composite structures can be due to different aspects as nonlinear elastic behaviour, the presence of memory or visco-elastic properties in the material behaviour, plastic behaviour in the matrix and the different deformation rates of the fibers and the matrix. On a lot of occasions the input to the structure is might not be even proportional to the output which makes impossible the use of a linear model. [4-6]. For this reason the prevailing research in VSHM for composite materials tends to be on non-model based methods.
features. However some studies suggest to detect the delamination from variations in the higher frequencies [8]. The effect of delamination in structures is expected to decrease the natural frequencies and also increase the modal damping as compared to the healthy structure [9]. To go further some methods consider finite element model to simulate the delamination and to more accurately describe the structural behaviour [10]. Some simulations introduce the delamination without consider the opening and closing effect, which actually introduces additional nonlinear effects. Most of the traditional methods are based on the fact that delamination reduces the effective cross-section which in turn causes loss of rigidity of the structural element. However reduction of stiffness does not always mean that there is a decrease in strength [11]. For structures made of composites damping is also considered as damage feature where delamination is concerned. However, damping will only increase when the crack is opening since at this point there is more interaction between the faces of the crack [11].
Traditional models require sophisticated finite element modelling which needs intensive labour of updating between the model and the real experiment [12]. Non-model based methods suggest the discrimination between two or more signal categories, for instance the vibration response signals from a healthy structure and a damaged one or signals that come from structures with different damages levels and locations [13, 14]. They are based on one or more features which can be used for discrimination purposes. One possibility to extract such features is to reduce the dimension of the original measured data, which makes it easier to analyse. A powerful method which provides data dimensionality reduction is Principal Component Analysis (PCA). PCA has been applied for damage detection as a result of its clustering properties [15, 16].
This study suggests the use of a modified PCA method, more specifically Singular Spectrum Analysis (SSA). The basic idea of SSA consists in the application of Principal Component Analysis with the variables analysed being lagged versions of a single time series variable [17]. SSA has been applied in different fields as biology, forecasting and for monitoring the stability of time series in order to obtain smoother signals, for trend extraction and extraction of periodicities in the form of modulated harmonics [18, 19]. This study presents a new method for structural vibration analysis and health monitoring which applies Multichannel Singular Spectrum Analysis (MSSA), in the frequency domain and uses the vibration responses of the healthy and the damage composite laminate structure. The method reduces the dimension of the initial frequency domain data and projects it into a new space. This is an early stage investigation oriented towards the development of a novel methodology for vibratory analysis and damage (delamination) assessment in structures made of composite materials.
2 THE METHOD SUGGESTED
In this study a statistical method known as Multichannel Singular Spectrum Analysis (MSSA) is used to extract the information from the structural vibration response and to provide insight into the dynamics of the underlying structure [20].
2.1 Data collection and construction
time series response of each specimen. Multiple realizations of the vibration response series are measured. Each time series is represented as a vector as shown below.
= ( ,
, … , , … , )′ ( 1)
where = 1,2, … , and = 1,2, … , are the number of signal realizations for each specimen and the number of components in each realization (measured acceleration vector) respectively.
A matrix which collects all the realizations of the vectors is defined as
= (, , … , ) (2)
Due to the different scales and magnitudes in the measurements, the original matrix data is standardized to ensure consistency in the amplitude values. The method used is the most popular one which scales each variable to have a zero mean and unity variance [21]. The standardized matrix is then defined as
=
−
(3)
= (, , … , ) (4)
The time series corresponding to each realization in the data matrix , is transformed into the frequency domain. The frequency domain data looks much more ordered and informative for the purposes of selecting features. A new data matrix is obtained with the values of the frequency domain accelerations.
= (, , … , ) (5)
Each vector of the matrix has dimension where = 1,2, … ,.
= (,
, … , , … , )′ ( 6)
2.2 Embedding and Empirical orthogonal Functions (EOFs)
The next step is to embed the frequency domain signals into a new space. Dynamics systems cannot be fully unfolded in the two dimensional space of their measured signals due to their more complicated behavior. By creating an embedding space, more dimensions are introduced and thus more features of the original system dynamics are uncovered. According to Takens’ theorem [22] any dynamic system can be fully uncovered in a new space made of vectors which are lagged versions of the initial in time domain signals. This study suggests embedding the original signals in the frequency domain where more information about of the dynamic system is contained.
From each vector realization, a − !"#$ !%#& is created. The embedding
matrix is made of sub-matrices with the dimension ' corresponding to each realization
̃ = ) * * * * * * * + , , - , - . … / …
… /0 …
… /0 …
1
10
10
- . 2
. 2 ⋮
… /0, …
… ⋮ …
⋮
2 ⋮ ⋮
⋮ ⋮
⋮
0 00
… …
… 0 …
…
… 00 …… 0 0 0 0 5 6 6 6 6 6 6 6 7 ( 7)
where = 1,2, … , and 8 = 1,2, … , .
Now all the matrices ̃ are collected into a new matrix 9. The dimension of the new embedded matrix 9 is ' x ( ∙ ) where ' is the number of components for each realization, the number of realizations and the length of the window applied.
9 = (̃, ̃, … , ̃) ( 8)
At the next step, the covariance matrix of the matrix 9 is obtained. It defines the covariance between different realizations where the diagonal of the matrix contains the auto-covariances.
;< =9′ ∙ 9 =
( 9)
where ;< is the Covariance matrix of 9, 9′ is the transpose of 9. The eigenvalues > and the eigenvectors ? of ;< are obtained according to the following expression.
;<? = >? ( 10)
The eigenvalues > are then ordered in the diagonal matrix ΛA in decreasing order and the matrix EA contains their corresponding eigenvectors written as columns. The eigenvalues define the partial variance of each eigenvectors, therefore the total sum of all of these variances gives the total variance of 9.
C′A;ACA = ΛA ( 11)
The eigenvectors are usually called Empirical Orthogonal Functions (EOFs).
2.3 Decomposition and Reconstruction
Empirical Orthogonal Functions (EOFs) represent the data as a decomposition of the orthogonal basic functions with a certain percentage of variance of the original signal corresponding to each EOF. Projecting the measured data 9 onto the EOFs yields the
corresponding Principal Components D[23].
D = 9 ∙ CA ( 12)
Therefore, to obtain the Reconstructed Components (RCs), an embedding matrix has to be
two differences: 1 It is calculated for each Principal Component of the matrix D and 2 The lagged frequency vectors run in the opposite direction.
The RCs F are obtained according to the expression below.
F 1
DE∙ CA
( 13)
The RCs contains all the information contained in the EOFs because no information is lost in the reconstruction process, since the sum of all RCs gives back the original signal [23].
3 THE STRUCTURE AND THE EXPERIMENT
3.1 Experimental set-up
Five composite laminates beams were manufactured using: 10-layered carbon woven laminate multiprepeg E722 resin [9/90] configuration. The dimensions of the beams are 980x42mm, the thickness is 2.5mm. The beams were fully-fixed at both ends with a free length between the supports of 900 mm. The free-decay responses of the specimens were recorded. Five different cases of internal delamination were considered and they are defined below:
(B1) Healthy structure without delamination
(B2) Delamination in the middle lengthwise between 5th- 6th layer and 50 mm length. (B3) Delamination in the middle lengthwise between 5th- 6th layer and 80 mm length. (B4) Delamination on the left side (at 220mm from the edge) between 5th- 6th layer and 50
mm length.
(B5) Delamination on the left side (at 220mm from the edge) between 2th- 3th and 50 mm
length.
Small pieces of Teflon were introduced to simulate the delamination. The non-adherent property of this material disbonds the layers.
3.2 Data collection and reconstruction
A data matrix was constructed by using the acceleration measured time series. Seven free-decay responses for each laminate beam were recorded. Thus, we are in possession of seven
data realizations 7 for each composite laminate. The time domain responses were then
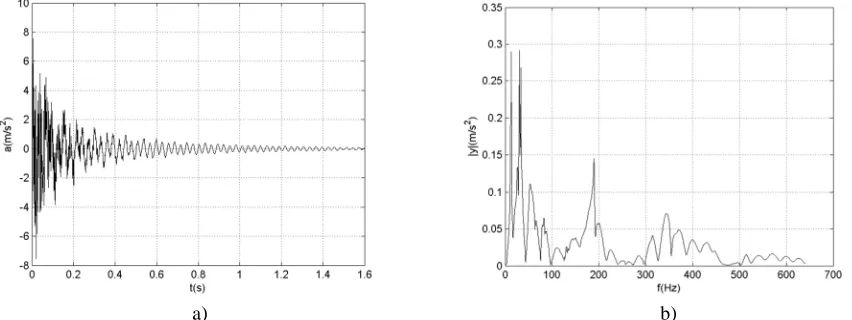
transformed to the frequency domain. Figure 1a and Figure 1b below represent the time and frequency domain responses of the intact beam.
[image:6.595.84.510.586.746.2]The data matrix is then constructed using the M realizations of the k-dimensional frequency domain vectors (in our case 1024). The procedure explained in the §2 was
applied to the frequency domain data matrix . The selection of the window size depends
on the purposes of the investigation. In our case the widow size selected was 7.
The new PCs were obtained by projection of the original data onto the EOFs.
[image:7.595.192.416.239.432.2]Nearly 100% of the variance is contained in the first nine EOFs. The first two EOFs are responsible for 88% of the variance where the 83% comes from the first one and the 5% from the second one. After the first four EOFs the percentage of variance is very small remains constant for the subsequent EOFs, as it is shown in the Figure 2 below.
Figure 2: Scree diagram
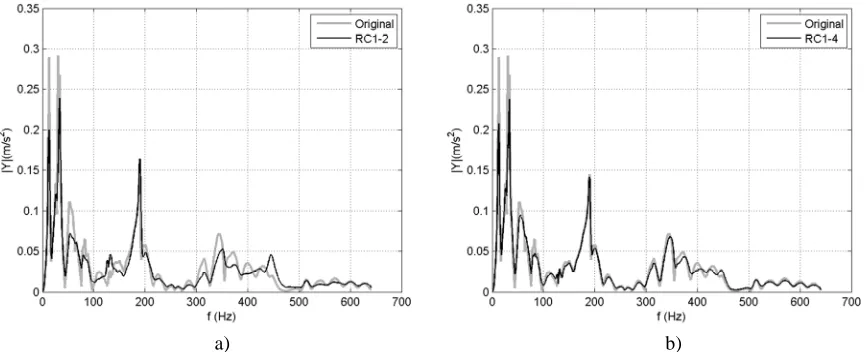
The original frequency domain series were reconstructed using the first four RCs. Figure 3 shows the results when the first two RCs were used (a) and when the first four RCs were used (b). It can be observed form Figure 3 that the reconstructed signal by using four RCs is much closer to the original frequency domain series than the reconstructed signal by using two RCs.
a) b)
Figure 3: a) Reconstruction of the original signal using the first two RCs
[image:7.595.81.515.551.727.2]3.3Results
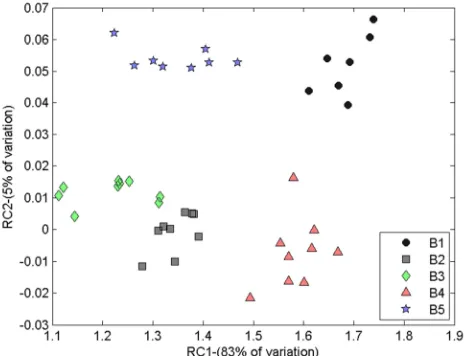
[image:8.595.178.411.275.453.2]Another reason to use SSA is that in the case of categorical data, it tends to cluster the new variables [17]. The decomposition in PC’s of the original frequency series reduces the distance between the new coordinates for objects from the same category while at the same time it increases the distance between objects from different categories. This effect is shown in the Figure 4. The data recorded from all damaged specimen configurations was projected onto the new space of the first two principal components. A clear difference can be detected between the new vector-points corresponding to the healthy structure and the ones from the different damaged structures. In addition, there is a clear distinction between points corresponding to different delamination configurations as shown in Figure 4 below. The excellent ability of MSSA for clustering is demonstrated.
Figure 4: The effect of clustering in the projection of the experiments onto RC-1 vs. RC-2
4 CONCLUSIONS
This paper suggests a multivariate statistical method, namely Multichannel Singular Spectrum Analysis (MSSA), which is used to transform the free decay vibration response from composite laminates beams. In this investigation the method is utilised for delamination detection in composite laminates.
The MSSA methods approach is used here in order to extract features from the frequency domain responses recorded from the laminate beams. MSSA decomposes the original signal into oscillatory components which in this case correspond to the free vibration modes of the beams. We chose to use the frequency domain responses because they are considered to contain more and better information about the free decay response of the beams in terms of their natural frequencies.
The first two PC’s are used for the purposes of damage/delamination classification and detection for purely visualization reasons. Our results show that in the new space, it is possible to distinguish between damaged and non-damaged specimens but in addition well separated classes corresponding to the different delamination scenarios are formed. Thus one can conclude that the approach suggested can be used not only for the purposes of delamination detection. Delamination quantification and localization are also possible through the method developed.
5 REFERENCES
[1] K. Worden, C. R. Farrar, J. Haywood, and M. Todd, "A review of nonlinear dynamics
applications to structural health monitoring," Structural Control and Health Monitoring, vol. 15, pp. 540-567, 2008.
[2] E. P. Carden and P. Fanning, "Vibration Based Condition Monitoring: A Review," Structural Health Monitoring, vol. 3, pp. 355-377, December 1, 2004 2004.
[3] Y. Zou, L. Tong, and G. P. Steven, "Vibration-Based Model -Dependent damage (delamination) identification and health monitoring for composite structures-Review " Journal of Sound and Vibration, vol. 230, pp. 357-378, 2000.
[4] N. V. S. Naidu and P. K. Sinha, "Nonlinear finite element analysis of laminated composite shells in hygrothermal environments," Composite Structures, vol. 69, pp. 387-395, 2005.
[5] A. Naserian-Nik and M. Tahani, "Free vibration analysis of moderately thick rectangular laminated composite plates with arbitrary boundary conditions," Structural engineering & mechanics, vol. 35, p. 217, 2010.
[6] P. Ribeiro and H. Akhavan, "Non-linear vibrations of variable stiffness composite laminated plates," Composite Structures, vol. 94, pp. 2424-2432, 2012.
[7] L. Zhang, "An overview of major developments and issues in modal identification," Proc. IMAC XXII, Detroit (USA), pp. 1-8, 2004.
[8] S. H. Diaz Valdes and C. Soutis, "Delamination detection in composite laminates from variations of their modal characteristics," Journal of Sound and Vibration, vol. 228, pp. 1-9, 1999.
[9] O. Salawu and C. Williams, "Damage location using vibration mode shapes," in Society of Photo-Optical Instrumentation Engineers (SPIE) Conference Series, 1994, p. 933.
[10] K. Alnefaie, "Finite element modeling of composite plates with internal
delamination," Composite Structures, vol. 90, pp. 21-27, 2009.
[11] D. Montalvao, N. Maia, and A. Ribeiro, "A review of vibration-based structural health monitoring with special emphasis on composite materials," Shock and Vibration Digest, vol. 38, pp. 295-326, 2006.
[12] E. J. Barbero, Finite element analysis of composite materials: CRC PressI Llc, 2008.
[13] H. Sohn, C. R. Farrar, N. F. Hunter, and K. Worden, "Structural health monitoring using statistical pattern recognition techniques," Transactions-American Society of Mechanical Engineers Journal of Dynamic Systems Measurement And Control, vol. 123, pp. 706-711, 2001.
[15] A. M. Yan, G. Kerschen, P. De Boe, and J. C. Golinval, "Structural damage diagnosis under varying environmental conditions—Part I: A linear analysis," Mechanical Systems and Signal Processing, vol. 19, pp. 847-864, 2005.
[16] A. M. Yan, G. Kerschen, P. De Boe, and J. C. Golinval, "Structural damage diagnosis
under varying environmental conditions—part II: local PCA for non-linear cases," Mechanical Systems and Signal Processing, vol. 19, pp. 865-880, 2005.
[17] I. T. Jolliffe, Principal Component Analysis: Springer, 2002.
[18] S. Park, J.-J. Lee, C.-B. Yun, and D. J. Inman, "Electro-mechanical impedance-based
wireless structural health monitoring using PCA-data compression and k-means clustering algorithms," Journal of intelligent material systems and structures, vol. 19, pp. 509-520, 2008.
[19] H. Hassani and A. Zhigljavsky, "Singular spectrum analysis: methodology and application to economics data," Journal of Systems Science and Complexity, vol. 22, pp. 372-394, 2009.
[20] R. Vautard and M. Ghil, "Singular spectrum analysis in nonlinear dynamics, with applications to paleoclimatic time series," Physica D: Nonlinear Phenomena, vol. 35, pp. 395-424, 1989.
[21] J. A. Westerhuis, T. Kourti, and J. F. MacGregor, "Comparing alternative approaches
for multivariate statistical analysis of batch process data," Journal of Chemometrics, vol. 13, pp. 397-413, 1999.
[22] D. Baratta, G. Cicioni, F. Masulli, and L. Studer, "Application of an ensemble technique based on singular spectrum analysis to daily rainfall forecasting," Neural Networks, vol. 16, pp. 375-387, 2003.
[23] M. Ghil, M. Allen, M. Dettinger, K. Ide, D. Kondrashov, M. Mann, A. W. Robertson,