City, University of London Institutional Repository
Citation
:
Liu, X., Kelly, S. R., Montesano, G., Bryan, S. R., Barry, R. J., Keane, P. A.,
Denniston, A. K. and Crabb, D. P. ORCID: 0000-0001-8754-3902 (2019). Evaluating the
Impact of Uveitis on Visual Field Progression Using Large Scale Real-World Data. American
Journal of Ophthalmology, doi: 10.1016/j.ajo.2019.06.004
This is the published version of the paper.
This version of the publication may differ from the final published
version.
Permanent repository link:
http://openaccess.city.ac.uk/id/eprint/22738/
Link to published version
:
http://dx.doi.org/10.1016/j.ajo.2019.06.004
Copyright and reuse:
City Research Online aims to make research
outputs of City, University of London available to a wider audience.
Copyright and Moral Rights remain with the author(s) and/or copyright
holders. URLs from City Research Online may be freely distributed and
linked to.
Evaluating the Impact of Uveitis on Visual Field
Progression Using Large-Scale Real-World Data
XIAOXUAN LIU, STEPHEN R. KELLY, GIOVANNI MONTESANO, SUSAN R. BRYAN, ROBERT J. BARRY, PEARSE A. KEANE, ALASTAIR K. DENNISTON, AND DAVID P. CRABB
PURPOSE: To compare rates of visual field (VF) loss in uveitis patients with glaucoma against patients with pri-mary open-angle glaucoma (POAG) and explore the asso-ciation between intraocular pressure (IOP) and rate of VF loss.
DESIGN: Retrospective cohort study.
METHODS: Anonymized VFs and IOP measurements extracted from the electronic medical records of 5 region-ally different glaucoma clinics in England. A total of 205 eyes with diagnosis of uveitis plus glaucoma were compared with 4600 eyes with POAG only. Minimum in-clusion criteria were ‡4 visits within a 4-year window. Relative risk (RR) of being a ‘‘rapid progressor’’ (mean deviation [MD] loss ‡1.5 dB/year) was calculated. A mixed-effects model (MEM) and a pointwise VF progres-sion analysis of pattern deviation were used to confirm differences between the groups. Longitudinal IOP mean, range, and variability were compared with rate of VF progression.
RESULTS: Median (interquartile range) baseline MD in the uveitis and POAG groups wasL3.8 (L8.7, L1.5) dB andL3.1 (L6.6,L1.2) dB, respectively. The uveitis and POAG groups had 23 of 205 (11%) and 331 of 4600 (7%) ‘‘rapidly progressing’’ eyes, respectively. Age-adjusted RR for ‘‘rapid progression’’ in uveitic vs POAG eyes was 1.9 (95% confidence interval: 1.8-2.0). The MEM confirmed that uveitic eyes (L0.49 dB/year) showed higher rates of VF progression than the POAG group (L0.37 dB/year; P < .01). IOP range and variability were higher in the ‘‘rapidly progressing’’ uveitic eyes.
CONCLUSIONS: Our analysis suggests that VF loss oc-curs faster in glaucoma patients with uveitis than those without uveitis. The risk of progressing rapidly in glau-coma with uveitis is almost double than in those without uveitis. Early identification of ‘‘rapid progressors’’ may enable targeted intervention to preserve visual function in this high-risk group. (Am J Ophthalmol 2019;207:
144–150. Ó 2019 The Author(s). Published by
Elsevier Inc. This is an open access article under the CC BY-NC-ND license (http://creativecommons.org/ licenses/by-nc-nd/4.0/).)
U
VEITIS REMAINS THE FOURTH MOST COMMONcause of blindness in the working-age population throughout the developed world, with visual impairment affecting between 2.8% and 10% of uveitic pa-tients.1–4Reduced visual function may result from direct damage to uveal tract structures, but more commonly occurs owing to secondary tissue damage, with the most prevalent complications being cataract, macular edema, and glaucoma.5Of these, both cataract and macular edema can be considered at least partially reversible; however, vi-sual impairment owing to glaucoma is irreversible and thus early diagnosis and appropriate management of uveitic glaucoma is of paramount importance.
Glaucoma in the presence of uveitis can develop via a number of mechanisms.6Increases in intraocular pressure (IOP) can occur owing to mechanical obstruction of aqueous outflow, presenting with secondary angle closure owing to pupillary block from posterior synechiae, or more chronically following development of peripheral anterior synechiae or angle rubeosis. Secondary open-angle glaucoma may develop owing to chronic inflamma-tory damage to the trabecular meshwork, or in response to corticosteroid therapy. In addition, specific uveitis en-tities are associated with elevation of IOP, such as Posner-Schlossmann syndrome, Fuchs heterochromic iridocyclitis, and herpetic uveitis. Active inflammation, corticosteroid usage, increasing age, and number of years since diagnosis have each been demonstrated to be associ-ated with raised IOP in uveitic patients.7
The prevalence of raised IOP in uveitis remains poorly defined, since increases in IOP may be transient and may not progress to true glaucomatous optic neuropathy. The prevalence of treated glaucoma varies from 20% to 30% in most cohorts.5,7–9 Accurate stratification of
Supplemental Material available atAJO.com. Accepted for publication Jun 5, 2019.
From the Ophthalmology Department, University Hospitals Birmingham NHS Foundation Trust, Birmingham, United Kingdom (X.L., A.K.D.); Academic Unit of Ophthalmology, Institute of Inflammation & Ageing, University of Birmingham, Birmingham, United Kingdom (X.L., R.J.B., A.K.D.); Optometry and Visual Science, School of Health Sciences, City, University of London, London, United Kingdom (S.R.K., G.M., S.R.B., D.P.C.); Birmingham & Midland Eye Centre, Sandwell and West Birmingham Hospitals NHS Trust, Birmingham, United Kingdom (R.J.B.); NIHR Biomedical Research Centre for Ophthalmology, Moorfields Eye Hospital NHS Foundation Trust and UCL Institute of Ophthalmology, London, United Kingdom (X.L., P.A.K., A.K.D.); and Centre for Rare Diseases, Institute of Translational Medicine, Birmingham Health Partners, Birmingham, United Kingdom (A.K.D.).
patients at risk of uveitic glaucoma is necessary to identify those at high risk of irreversible vision loss. Intensive monitoring and active intervention are important to prevent irreversible visual impairment in these patients.10 With the widespread adoption of electronic medical re-cords (EMR), it is now possible to collect clinical data from large patient populations, identifying trends in disease pro-gression and treatment response that have not been possible with traditional paper-based records. Such ‘‘Big Data’’ approaches have been successfully used to charac-terize the population and predict outcomes in other ophthalmic diseases.11–15 This study aims to use large-scale EMR data for comparing the rate of visual field (VF) loss in uveitis patients with glaucoma, compared to those with primary open-angle glaucoma (POAG), and explore whether this is associated with IOP.
METHODS
ANONYMIZED RECORDED DATA BETWEEN APRIL 2000 AND
March 2015 were extracted from the Medisoft (Medisoft Ltd, Leeds, UK) EMR from 5 regionally different glaucoma clinics in England and linked to the Royal College of Oph-thalmologists’ National Ophthalmology Database.16 The data used were collected for a Healthcare Quality Improve-ment Partnership project conducted by the Royal College of Ophthalmologists (National Ophthalmology Database Audit provider) as part of the National Clinical Audit and Patient Outcomes Programme. The study adhered to the Declaration of Helsinki and all analyses of the data were approved by a research ethics committee of City, Uni-versity of London. All patient data were anonymized and securely held on the university database. The resulting database contained records from 71 404 patients.
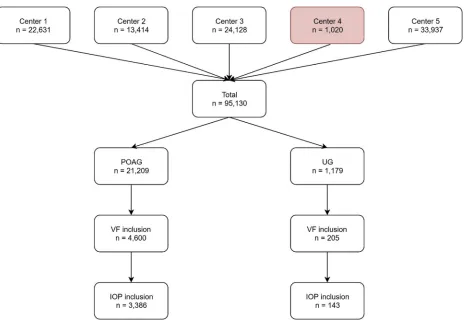
INCLUSION CRITERIA: Eyes were sorted into 2 groups based on EMR diagnostic labeling: a POAG group and a group of patients with both a ‘‘uveitis’’ and ‘‘glaucoma’’ diagnosis. POAG was defined by having a diagnostic label of ‘‘POAG’’ or ‘‘chronic open-angle glaucoma (COAG)’’ without any uveitis co-pathologies. Uveitis plus glaucoma was defined as having both a label of POAG or COAG plus a uveitis label. A variety of anatomic and disease-specific labels for uveitis were included (a full list of diag-nostic labels are provided in the Appendix A; Supple-mental Material available atAJO.com). Initial extraction by diagnosis found 1179 eyes with uveitic glaucoma and 21 209 eyes with POAG (Figure 1). The inclusion criteria for each eye were a minimum of 4 VF tests over 4 years, with at least 4 of the included tests being performed within the initial 4 years (Figure 2). Only VFs from the Humphrey Field Analyzer (HFA) using Goldmann size III (white-on-white) stimuli with the 24-2 test pattern acquired with
either SITA Standard or SITA Fast testing algorithms were included.
A secondary analysis on the association between IOP behavior and VF progression was also carried out. In addi-tion to the above inclusion criteria, a minimum of 4 IOP measurements in the first 4 years were needed.
STATISTICAL ANALYSIS: Analysis was carried out on 1
eye per patient; if a patient had 2 eligible eyes, 1 was chosen at random. The first VF examination of each series was defined as the baseline measurement. HFA pointwise sensi-tivity values and mean deviation (MD; an estimate of average VF sensitivity relative to healthy age-matched controls) values were extracted for each VF for each eye. Pattern deviation (PD) pointwise values were calculated using the visualFields package in R.17
Ordinary least-squares (OLS) linear regression of MD over time was used to estimate rates of progression (dB/year). As with previous studies, a fast-progressing VF series was defined as having a rate of progression slope of>_1.5 dB/year.13,18A crude relative risk (RR) was calculated as the ratio of the proportion of fast progressors in the uveitis and POAG groups, for each 10-year age group from 40 to 100 years, as esti-mated by the OLS regression slopes. An overall age-adjusted RR was calculated using the direct method.19
Two secondary VF progression analyses were also performed. First, a linear mixed-effects model analysis, which can estimate the regression coefficient while including both fixed and random effects, was fitted.20MD was treated as a response variable; time (years since first visit), group (POAG or uveitis), and baseline age were treated as fixed effects and individuals as a random effect (model provided inAppendix B, available atAJO.com).
Second, the permutation of pointwise linear regression (PoPLR) technique was used to analyze the pointwise sensi-tivities and PD values of each VF series.21–23 PoPLR repeatedly permutes the order of VF visits in a series to give robust estimations of the likelihood of significant VF change. In our case PoPLR was performed on PD values as an indicator of worsening VF to mitigate global changes that may occur, for example, from developing cataract. The outcome of interest is simply the proportion of eyes showing statistically significant progression (atP¼.05) in the uveitic and POAG groups (R code for the PoPLR analysis is provided inAppendix C; Supplemental Material available atAJO.com).
IOP data were analyzed using longitudinal metrics: mean, range, and mean absolute error (MAE). Mean IOP was defined as the mean of all recorded IOP values in the series. IOP range was defined as the highest value (peak) minus the lowest value (trough) in the IOP series. MAE, as a measure of IOP variability, was estimated by fitting an OLS linear regression to IOP values over time, then extracting errors (predicted values minus the observed IOP) at each visit. The mean of the absolute values of these errors was the MAE value. Univariate associations between
rates of progression and IOP metrics were analyzed. vStatistical comparisons were made using the Mann-WhitneyUtest.
Analysis was varied out using R (R Development Core Team, R Foundation for Statistical Computing, Vienna, Austria).
RESULTS
BASELINE CHARACTERISTICS: From a starting popula-tion of 1179 eyes, 205 (17%) eyes with uveitis plus glau-coma satisfied the inclusion criteria and were included in further analysis. From a starting population of 21 209 eyes, 4600 (22%) eyes with POAG were included in further analysis (Figure 2). Median (interquartile range [IQR]) age of the patients was 64 (53, 73) and 70 (62, 76) years in the uveitis and POAG groups, respectively. Baseline MD model estimates in the uveitis and POAG groups were -5.55 (95% confidence interval [CI]: -6.39, -4.47) dB and -4.47 (95% CI: -4.31, -4.63) dB, respectively. Median
(IQR) intensity (frequency) of VF testing was the same, with an interval of 10 months between each VF test, for both groups.
RATE OF VISUAL FIELD LOSS:The uveitis and POAG groups had 23 of 205 (11%) and 331 of 4600 (7%) eyes that progressed at >_1.5 dB/year, respectively. The crude RR of a fast rate of progression for uveitis/POAG was 1.6 (95% CI: 1.1-2.3) and age-adjusted RR was 1.9 (95% CI: 1.8-2.0). This indicates that, for a similarly aged popula-tion, a patient in the uveitis group was 1.9 times more likely to be a fast progressor than patients in the POAG group.
Further analysis using the mixed-effects model showed that the age-adjusted rate of progression was -0.49 dB/ year for the uveitis group and -0.37 dB/year for the POAG group. The estimated average age-corrected differ-ence in rate of progression between the groups at the mean age was -0.12 dB/year (P<.01).
[image:4.576.59.525.53.376.2]VF progression analysis using PoPLR on PD values indi-cates that the uveitis group has a higher proportion of significantly progressing eyes (21.2%), compared to the POAG group (18.5%).
LONGITUDINAL INTRAOCULAR PRESSURE ANALYSIS:
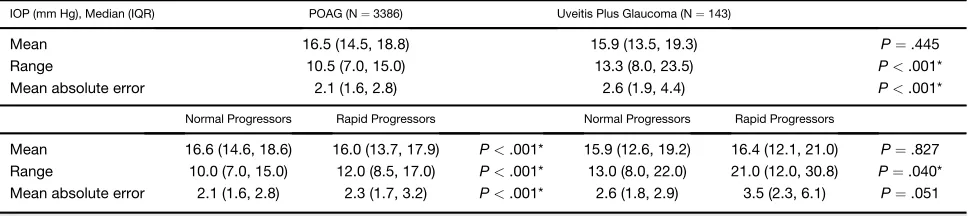
A total of 143 eyes with uveitis plus glaucoma and 3386 eyes with POAG met the additional inclusion criteria for longitudinal IOP analysis. A summary of longitudinal IOP measurements can be found in the Table. We did not find a statistically significant difference in mean IOP (within 1 mm Hg) between the 2 groups, yet there was wider range and higher MAE in the uveitis group (P < .001). A comparison between fast and nonfast progressors found the mean IOP difference to be within 1 mm Hg for all groups. IOP range was wider in the fast progressors of both POAG and uveitis groups (both
P <.05), and widest in the fast-progressing uveitis group (21 mm Hg). Similarly, MAE was higher in fast progressors of both diseases (P < .01), but highest in the fast-progressing uveitis group (3.5 mm Hg).
DISCUSSION
THIS IS THE FIRST STUDY TO USE REAL-WORLD EMR DATA TO
compare rates of VF loss in uveitis patients with glaucoma and those with POAG. We have demonstrated that uveitis patients with a diagnosis of glaucoma were likely to be younger and have a worse MD at baseline than those with a diagnosis of POAG. The uveitis group were more likely to lose VF at a rapid rate (>_1.5 dB/year loss in MD) compared with the POAG group, with an age-adjusted RR of 1.9 (95% CI: 1.8-2.0). Despite this, our data show that the average frequency of VF monitoring is the same
for both diseases. Our longitudinal IOP analysis suggests IOP range and variability had a stronger association with rapid VF loss than mean IOP.
Our findings suggest that patients with a combination of uveitis and glaucoma lose vision more rapidly than POAG, yet on average they are monitored with VFs at the same in-tensity. Our estimate of rate of VF loss in POAG (-0.37 dB/ year) is higher than has previously been reported in the literature; however, our estimates differ in that they were adjusted for age.13,24 The observed proportion of fast progressors in our POAG cohort is also similar to previous studies: defined thresholds for ‘‘fast’’ or ‘‘rapid’’ progression in published literature range from>_1 to 2 dB/ year loss in MD, and reported prevalence of patients progressing rapidly varies between 3% and 17% in previous studies.24–29
The main strength of our study is the large starting sam-ple size compared to others in the literature. Although only 205 uveitic eyes were included in our final VF progression analysis, a sufficiently large starting sample was required to reach the final 205 included samples. We restricted the inclusion of patients to those with a minimum of 4 VF tests over at least 4 years. Additionally, at least 4 of the included VF tests must have been performed within 4 years of the first test. As with our previous work, the min-imum inclusion criteria was a compromise between maxi-mizing sample size while still ensuring robustness of our rate of progression estimates.13,15
[image:5.576.53.273.56.187.2]Our study also has several limitations. Firstly, our data were reliant upon accurate recording in the EMR. Diag-nostic labeling within the Medisoft EMR is not a manda-tory field and can be entered as free text, or not entered at all. We included a large list of diagnostic labels commonly found in the presence of uveitis to widen our capture of uveitis subjects. However, a large portion of uve-itis subjects in this analysis were lacking in anatomic or disease-specific diagnostic labels in the EMR, thus limiting our ability to explore patterns in specific uveitis subtypes. We took steps in our analyses to mitigate the confounding effects of ocular comorbidities. For example, PoPLR VF progression analysis with PD values is designed to identify localized VF change and not just general reduction in VF sensitivity that might be attributed to developing cataract. Results from the PoPLR analysis supported our main find-ings. Nevertheless, we cannot fully account for the effects of ocular comorbidities on perimetric performance of the patients. Uveitic patients are susceptible to a range of com-plications such as cataract, cystoid macular edema, fibrin deposition, band keratopathy, and epiretinal membrane, all of which may affect VF performance. Acute inflamma-tory processes may cause temporary drops in visual acuity, which subsequently resolves. This may explain why some patients’ MD seems to improve over time (ie, perhaps owing to cataract surgery or resolution of inflammatory dis-ease such as cystoid macular edema), although this could also be attributed to patient variability and learning
FIGURE 2. A schematic illustrating the visual field (VF) series inclusion criteria and method for calculating rates of mean devi-ation loss (dB/year) for 2 example eyes. Eyes were excluded if <4 VF examinations or<4 years of follow-up. Rates of VF loss were calculated from ordinary least squares linear regres-sion of the baseline VF and the series of examinations that fell within a 4-year period after it (white window). In the top example, the 5th, 6th, and 7th recorded VFs fall outside of the window and were not used in the calculation. In the bottom example, only the seventh examination was excluded. This en-sures that all rates are estimated with equivalent precision, allowing for comparisons over time.
effect.30–32On the other hand, progressive loss of visual acuity from longstanding uveitic damage (such as scarring and retinal atrophy) may also confound the apparent loss of MD in the uveitic group. Structural information such as retinal nerve fiber layer thickness, cup-to-disc ratio, or the inclusion of imaging data would be useful for differen-tiating between true glaucomatous VF loss and global loss owing to other causes. Although not available in this data-set, linkage of structural information would be of interest for future studies.
An important finding is the worse presenting MD in the uveitic group, suggesting early VF loss may be under-detected. Additionally, the baseline age in the uveitis plus glaucoma group was younger, which also supports the hypothesis that uveitic glaucoma may progress faster. Detecting early VF loss is clinically difficult if perimetric testing is not performed routinely, particularly in the absence of a deranged IOP. In the context of uveitis, con-trolling the inflammation may require more clinical ur-gency and early glaucomatous damage can be easily overlooked. On the other hand, anti-inflammatory treat-ment, of which corticosteroids are the preferred first-line agent, can precipitate raised IOP in up to a third of pa-tients.33,34Steroid implants have been shown to increase the risk of developing glaucomatous optic neuropathy by 4 times compared to those taking systemic therapy.35 A comparison of VF progression in uveitis patients receiving steroid treatment vs those without would be of interest for future studies. Such an analysis would require accurate data on frequency, duration, and formulation of steroid use, which is not routinely captured by the Medisoft EMR. Suc-cessful management of glaucoma in uveitis requires simul-taneous treatment of inflammation and IOP elevation. In some cases, controlling the inflammation also helps to reduce IOP and there is evidence to suggest those treated with aggressive anti-inflammatory therapy have better out-comes.6Antiglaucomatous drugs such as beta-blockers and carbonic anhydrase inhibitors can be used to lower the IOP.
Some controversy exists around the use of prostaglandin analogues (PGAs) as a first-line agent owing to the theoret-ical risk of blood-aqueous barrier disruption and cystoid macular edema; however, multiple studies have found no differences in the rate of inflammatory recurrences and it is considered safe to use PGAs as first-line therapy in quies-cent uveitis.36,37The management options for glaucoma in uveitis are predominantly with an aim to decrease IOP, but it is unclear whether these treatments influence IOP variability.
The exact pathologic process behind glaucoma in different uveitic subtypes is difficult to define, as there are often multiple coexisting mechanisms driving IOP changes and glaucomatous damage. Yet, elevated IOP has been considered the main modifiable risk factor. Our study, albeit based on retrospective data, represents the largest published longitudinal analysis of IOP behavior in uveitis patients with glaucoma. We found the mean longitudinal IOP to be similar in uveitis and POAG. However, IOP range and MAE were higher in uveitis patients. In both uveitic and POAG groups, IOP range and MAE are consis-tently higher in those progressing rapidly compared to those losing less than 1.5 dB/year in MD. It is unclear whether the fluctuant IOP is a contributing factor to glau-comatous damage, or whether it is simply a more prevalent finding in those with more severe glaucoma, representing those with the poorest controlled IOP and therefore receiving the most aggressive treatment. The published literature on POAG is inconsistent in this area, with some studies reporting a strong relationship between ocular hypertension and glaucomatous field loss, while others sug-gest that long-term IOP variability is associated more strongly with progression than mean IOP.38,39 Lee and associates suggest a 1 mm Hg increase in standard deviation of IOP is associated with a 4-fold increase in risk of POAG progression.40 In uveitis, published long-term data on IOP is limited and understanding of IOP behavior in the context of inflammation, secondary TABLE.Longitudinal Intraocular Pressure Metrics: Comparison Between Primary Open-Angle Glaucoma and Uveitis Plus Glaucoma
Groups
IOP (mm Hg), Median (IQR) POAG (N¼3386) Uveitis Plus Glaucoma (N¼143)
Mean 16.5 (14.5, 18.8) 15.9 (13.5, 19.3) P¼.445
Range 10.5 (7.0, 15.0) 13.3 (8.0, 23.5) P<.001*
Mean absolute error 2.1 (1.6, 2.8) 2.6 (1.9, 4.4) P<.001*
Normal Progressors Rapid Progressors Normal Progressors Rapid Progressors
Mean 16.6 (14.6, 18.6) 16.0 (13.7, 17.9) P<.001* 15.9 (12.6, 19.2) 16.4 (12.1, 21.0) P¼.827 Range 10.0 (7.0, 15.0) 12.0 (8.5, 17.0) P<.001* 13.0 (8.0, 22.0) 21.0 (12.0, 30.8) P¼.040* Mean absolute error 2.1 (1.6, 2.8) 2.3 (1.7, 3.2) P<.001* 2.6 (1.8, 2.9) 3.5 (2.3, 6.1) P¼.051
Statistically significantPvalues are indicated by an asterisk (*).
[image:6.576.50.534.99.207.2]structural damage, and anti-inflammatory treatment re-mains poor.
Glaucoma secondary to uveitis is an important cause of irreversible sight loss, which is challenging to detect and manage. Our main finding from retrospective analysis of clinical data from multicenter glaucoma services in En-gland shows that uveitis patients with glaucoma are almost twice as likely to lose VF rapidly when compared to tients with POAG. Therefore, clinicians managing pa-tients with uveitis should remain vigilant for glaucomatous damage in these high-risk patients. In
England, there is evidence that most patients get a similar diet of VF examinations during follow-up, and our findings support this.13,18Our results at least highlight that uveitis patients require closer attention in order to rule out rapid loss of VF during treatment. IOP variability is more common in uveitic eyes and our findings suggest that IOP fluctuates across a wider range in this group than in POAG. We suggest a low threshold for glaucoma screening in patients with uveitis, even if IOP is within normal limits and particularly in the presence of a fluctuating IOP.
ALL AUTHORS HAVE COMPLETED AND SUBMITTED THE ICMJE FORM FOR DISCLOSURE OF POTENTIAL CONFLICTS OF INTEREST. Financial Disclosures: Pearse A. Keane has received speaker fees from Heidelberg Engineering, Topcon, Haag-Streit, Allergan, Novartis, and Bayer; serves on advisory boards for Novartis and Bayer; and is an external consultant for DeepMind and Optos. David P. Crabb has received speaker fees from Allergan, Santen, and Roche, and is an external consultant for CenterVue. The following authors have no financial disclosures: Xiaoxuan Liu, Stephen R. Kelly, Giovanni Montesano, Susan R. Bryan, Robert J. Barry, and Alastair K. Denniston. Funding/Support: X.L., P.A.K., D.P.C., and A.K.D. receive a portion of their funding from the Wellcome Trust, through a Health Improvement Challenge grant (200141/Z/15/Z). A.K.D. and P.A.K. receive a proportion of their funding from the Department of Health’s NIHR Biomedical Research Centre for Ophthalmology at Moorfields Eye Hospital and UCL Institute of Ophthalmology. S.R.K. received funding from the European Union’s Horizon 2020 research and innovation program under the Marie Sklodowska-Curie Grant Agreement No. 675033. The listed funding organizations had no role in the design or conduct of this research. All authors attest that they meet the current ICMJE criteria for authorship.
Other Acknowledgments: X.L. and S.R.K. contributed equally and share joint first authorship. A.K.D. and D.P.C. share joint senior authorship.
REFERENCES
1. Suttorp-Schulten MS, Rothova A. The possible impact of uveitis in blindness: a literature survey. Br J Ophthalmol 1996;80(9):844–848.
2. Bodaghi B, Cassoux N, Wechsler B, et al. Chronic severe uve-itis: etiology and visual outcome in 927 patients from a single center.Medicine (Baltimore)2001;80(4):263–270.
3. Darrell R, Wagener H, Kurland L. Epidemiology of uveitis. Incidence and prevalence in a small urban community. Arch Ophthalmol1962;68:502–514.
4. Goldstein H. The reported demography and causes of blind-ness throughout the world.Adv Ophthalmol1980;40:1–99. 5. Jones NP. The Manchester Uveitis Clinic: The first 3000
pa-tients, 2: Uveitis Manifestations, Complications, Medical and Surgical Management. Ocul Immunol Inflamm 2015;23(2): 127–134.
6. Siddique SS, Suelves AM, Baheti U, Foster CS. Glaucoma and uveitis.Surv Ophthalmol2013;58(1):1–10.
7. Herbert HM, Viswanathan A, Jackson H, Lightman SL. Risk factors for elevated intraocular pressure in uveitis.J Glaucoma 2004;13(2):96–99.
8. Sallam A, Sheth HG, Habot-Wilner Z, Lightman S. Outcome of raised intraocular pressure in uveitic eyes with and without a corticosteroid-induced hypertensive response. Am J Ophthalmol2009;148(2):207–213.e1.
9. Takahashi T, Ohtani S, Miyata K, Miyata N, Shirato S, Mochizuki M. A clinical evaluation of uveitis-associated sec-ondary glaucoma.Jpn J Ophthalmol2002;46(5):556–562. 10. Chauhan BC, Garway-Heath DF, Gon˜i FJ, et al. Practical
rec-ommendations for measuring rates of visual field change in glaucoma.Br J Ophthalmol2008;92(4):569–573.
11. Egan C, Zhu H, Lee A, et al. The United Kingdom Dia-betic Retinopathy Electronic Medical Record Users Group, Report 1: baseline characteristics and visual
acu-ity outcomes in eyes treated with intravitreal injections of ranibizumab for diabetic macular oedema. Br J Ophthalmol 2017;101(1):75–80.
12. Lee CS, Lee AY, Baughman D, et al. The United Kingdom Diabetic Retinopathy Electronic Medical Record Users Group: Report 3: baseline retinopathy and clinical features predict progression of diabetic retinopathy.Am J Ophthalmol 2017;180:64–71.
13. Boodhna T, Saunders LJ, Crabb DP. Are rates of vision loss in patients in English glaucoma clinics slowing down over time? Trends from a decade of data. Eye (Lond) 2015;29: 1613–1619.
14. Saunders LJ, Russell RA, Crabb DP. Measurement precision in a series of visual fields acquired by the Standard and Fast versions of the Swedish Interactive Thresholding Algorithm: analysis of large-scale data from clinics. JAMA Ophthalmol 2015;133(1):74–80.
15. Saunders LJ, Russell RA, Kirwan JF, McNaught AI, Crabb DP. Examining visual field loss in patients in glaucoma clinics during their predicted remaining lifetime. Invest Opthalmol Vis Sci2014;55(1):102–109.
16. Health Quality Improvement Partnership. National Elec-tronic Glaucoma Surgery and Visual Field Preservation Audit: Feasibility Report. London: Healthcare Quality Improvement Partnership (HQIP); 2018.
17. Marin-Franch I, Swanson WH. The visualFields package: a tool for analysis and visualization of visual fields.J Vis2013;13(4):10. 18. Boodhna T, Crabb DP. More frequent, more costly? Health economic modelling aspects of monitoring glaucoma patients in England.BMC Health Serv Res2016;16(1):1–13. 19. Fay MP, Feuer EJ. Confidence intervals for directly
standard-ized rates: a method based on the gamma distribution.Stat Med1997;16(7):791–801.
20. Bates D, Ma¨chler M, Bolker B, et al. Fitting linear mixed-ef-fects models using lme4.J Stat Softw2015;67.
21. O’Leary N, Chauhan BC, Artes PH. Visual field progres-sion in glaucoma: estimating the overall significance of deterioration with permutation analyses of pointwise linear regression (PoPLR).Invest Ophthalmol Vis Sci2012;53(11): 6776–6784.
22. Garway-Heath DF, Zhu H, Cheng Q, et al. Combining opti-cal coherence tomography with visual field data to rapidly detect disease progression in glaucoma: a diagnostic accuracy study.Health Technol Assess (Rockv)2018;22(4):1–106. 23. Garway-Heath DF, Quartilho A, Prah P, Crabb DP, Cheng Q,
Zhu H. Evaluation of visual field and imaging outcomes for glau-coma clinical trials (an American Ophthalomological Society Thesis).Trans Am Ophthalmol Soc2017;115:T4.
24. Chauhan BC, Malik R, Shuba LM, Rafuse PE, Nicolela MT, Artes PH. Rates of glaucomatous visual field change in a large clinical population. Invest Ophthalmol Vis Sci 2014;55(7): 4135–4143.
25. Chan TCW, Bala C, Siu A, Wan F, White A. Risk factors for rapid glaucoma disease progression.Am J Ophthalmol2017; 180:151–157.
26. De Moraes CG, Prata TS, Tello C, Ritch R, Liebmann JM. Glaucoma with early visual field loss affecting both hemifields and the risk of disease progression. Arch Ophthalmol2009; 127(9):1129–1134.
27. Heijl A, Buchholz P, Norrgren G, Bengtsson B. Rates of vi-sual field progression in clinical glaucoma care.Acta Ophthal-mol2013;91(5):406–412.
28. Aptel F, Aryal-Charles N, Giraud J-M, et al. Progression of visual field in patients with primary openangle glaucoma -ProgF study 1.Acta Ophthalmol2015;93(8):615–620. 29. Medeiros FA, Zangwill LM, Mansouri K, Lisboa R,
Tafreshi A, Weinreb RN. Incorporating risk factors to improve the assessment of rates of glaucomatous progression. Invest Ophthalmol Vis Sci2012;53(4):2199–2207.
30. Gardiner SK, Demirel S, Johnson CA. Is there evidence for continued learning over multiple years in perimetry?Optom Vis Sci2008;85(11):1043–1048.
31. Heijl A, Bengtsson B. The effect of perimetric experience in patients with glaucoma.Arch Ophthalmol1996;114(1):19–22. 32. Wild JM, Searle AET, Dengler-Harles M, O’Neill EC. Long-term follow-up of baseline learning and fatigue effects in the automated perimetry of glaucoma and ocular hypertensive patients.Acta Ophthalmol1991;69(2):210–216.
33. Tripathi RC, Parapuram SK, Tripathi BJ, Zhong Y, Chalam KV. Corticosteroids and glaucoma risk.Drugs Aging 1999;15(6):439–450.
34. Armaly MF, Becker B. Intraocular pressure response to topical corticosteroids.Fed Proc1965;24(6):1274–1278. 35. Friedman DS, Holbrook JT, Ansari H, et al. Risk of elevated
intraocular pressure and glaucoma in patients with uveitis: re-sults of the multicenter uveitis steroid treatment trial. Ophthalmology2013;120(8):1571–1579.
36. Markomichelakis NN, Kostakou A, Halkiadakis I, Chalkidou S, Papakonstantinou D, Georgopoulos G. Efficacy and safety of latanoprost in eyes with uveitic glaucoma. Graefes Arch Clin Exp Ophthalmol2009;247(6):775–780. 37. Horsley MB, Chen TC. The use of prostaglandin analogs in
the uveitic patient.Semin Ophthalmol2011;26(4-5):285–289. 38. Caprioli J, Coleman AL. Intraocular pressure fluctuation.
Ophthalmology2008;115(7):1123–1129.
39. Nouri-Mahdavi K, Hoffman D, Coleman AL, et al. Predictive factors for glaucomatous visual field progression in the Advanced Glaucoma Intervention Study. Ophthalmology 2004;111(9):1627–1635.