Ethnicity and child poverty
Lucinda PlattFirst Published 2009.
ISBN 978 1 84712 560 6
Contents
Acknowledgements ... xi
The Author ... xii
Abbreviations ...xiii
Glossary ... xv
Summary ...1
1 Introduction: ethnicity and child poverty ...11
1.1 Background and context ...12
1.1.1 Background and rationale ...12
1.1.2 Child poverty as an issue ...13
1.1.3 The existing evidence base ...14
1.2 The case for a focus on ethnicity ...14
1.2.1 What we know about ethnicity and child poverty ...14
1.2.2 Bringing ethnic minority employment and child poverty agendas together ...15
1.3 Research questions ...16
1.4 Data sources ...19
2 Understanding child poverty across ethnic groups ...23
2.1 Poverty risks by ethnic group and family type ...24
2.1.1 Trends in poverty rates ...25
2.1.2 Comparing poverty rates BHC and AHC ...25
2.1.3 Child poverty rates compared to all adult poverty rates ...26
2.2 Income sources across poor families ...35
2.2.1 Overall income composition ...36
2.2.2 Income sources across poor and not poor households ...39
2.2.3 Income composition by household type ...41
3 Is there an ‘ethnic penalty’ in poverty? ...55
3.1 Estimating ethnic poverty penalties ...57
3.2 Ethnic poverty penalties across children of all ages ...58
3.3 Ethnic poverty penalties across families with young children ...63
3.3.1 Results from the estimation of poverty: ethnic poverty penalties for young children ...65
4 Poverty persistence and transitions ...69
4. 1 Income and poverty transitions between Wave 1 and Wave 2 ...70
4.2 Poverty transitions and events ...73
4.3 Modelling poverty transitions ...77
5 Material deprivation across ethnic groups ...81
5.1 Introduction to material deprivation ...81
5.2 Describing deprivation across ethnic groups ...83
5.3 Investigating ethnic penalties in deprivation ...85
6 The dynamics of workless families with children across ethnic groups ...89
6.1 Unemployment transitions across UK-born ethnic groups ...89
6.1.1 Introduction to unemployment transitions ...89
6.1.2 Unemployment durations among unemployed by ethnic group ...91
6.1.3 Exit from unemployment by ethnic group ...92
6.2 Ten-year transitions between workless households ...94
6.2.1 Transition patterns 1991-2001 ...95
6.2.2 Family and area influences on dynamics of worklessness ...99
6.2.3 Illustrating the impact of ethnicity on workless household entry and exit ...106
7 The role of area...111
8 Understanding poverty within groups ...119
8.1 Poverty and Indian children ...120
8.1.1 Comparison of poor and non-poor Indian households with children ...121
8.1.2 Key findings for Indian children from the preceding chapters ...123
8.2 Poverty and Pakistani children ...124
8.2.1 Comparison of poor and non-poor Pakistani households with children ...124
8.2.2 Key findings for Pakistani children from the preceding chapters ...127
8.3 Poverty and black Caribbean children ...127
8.3.1 Comparison of poor and non-poor black Caribbean households with children ...127
8.3.2 Key findings for black Caribbean children from the preceding chapters ...129
8.4 Poverty and black African children ...130
8.4.1 Comparison of poor and non-poor black African households with children ...130
8.4.2 Key findings for black African children from the preceding chapters ...132
9 What does religion add to our understanding of child poverty? ...135
9.1 Are there religious poverty penalties? ...136
9.1.1 Religion and poverty penalties and transitions ...136
9.1.2 Religion and workless households ...141
9.2 Variation by religion among Indians ...143
9.2.1 Poverty transitions and persistence by religion among Indians ...143
9.2.2 Workless household transitions by religion among Indians ...144
9.3 Variation by ethnicity among Muslims ...145
9.3.2 Workless household transitions by ethnic groups
among Muslims ...146
10 Conclusions and policy implications ...149
10.1 Putting the jigsaw together ...149
10.2 Implications for policy and future research ...152
Appendix Data sources ...157
References ...167
List of tables
Table 1.1 Sources used in analysis and key features ...20Table 2.1 Children’s poverty rates: rolling averages (BHC), Great Britain ...25
Table 2.2 Children’s poverty rates 2003/04-2005/06 AHC and BHC, by ethnic group; distributions of all children and of poor children BHC and AHC by ethnic group, Great Britain ...26
Table 2.3 Child and all individuals’ poverty rates 2003/04-2005/06 BHC and AHC, by ethnic group, Great Britain ...27
Table 2.4 Distributions of children and poor children and risks of poverty 2003/04-2005/06, by family type and ethnic group, Great Britain ...28
Table 2.5 Distributions of children and poor children 2003/04-2005/06 and risks of poverty, by number of children in family and ethnic group, Great Britain ...30
Table 2.6 Distributions of children and poor children 2003/04-2005/06 and risks of poverty, by worker status of household and ethnic group, Great Britain ...31
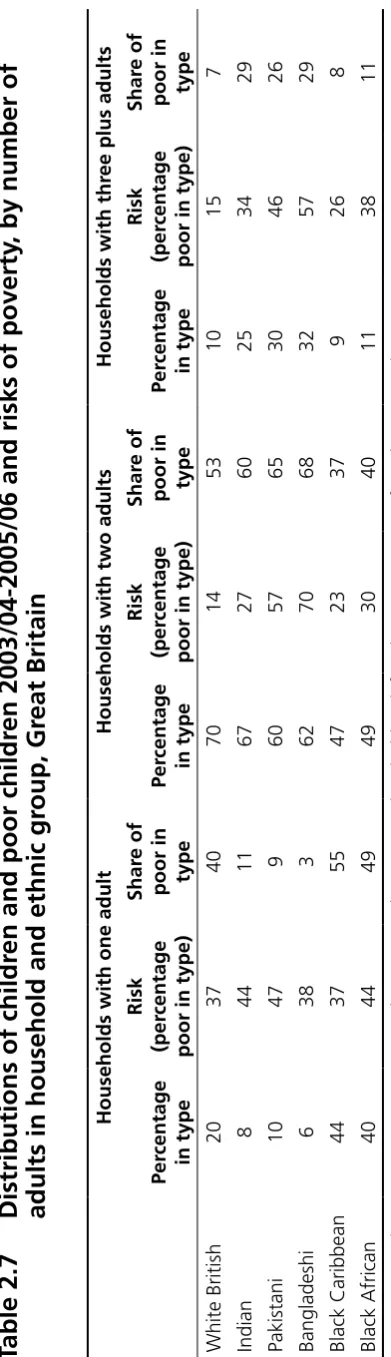
Table 2.7 Distributions of children and poor children 2003/04-2005/06 and risks of poverty, by number of adults in household and ethnic group, Great Britain ...33
Table 2.8 Distributions of children and poor children 2003/04-2005/06 and risks of poverty, by health/disability status of household and ethnic group, Great Britain ...34
Table 2.9 Average number of workers among all and working households, by ethnic group, Great Britain ...47
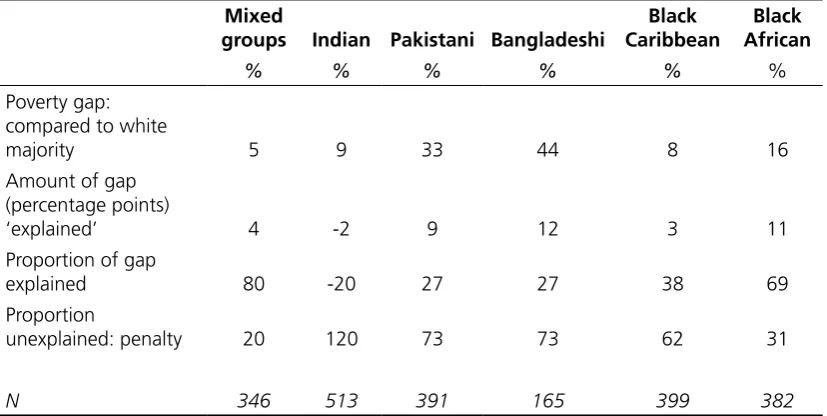
Table 3.1 Ethnic poverty penalties: results from decomposition analysis for six minority groups compared to white majority, Great Britain ...60
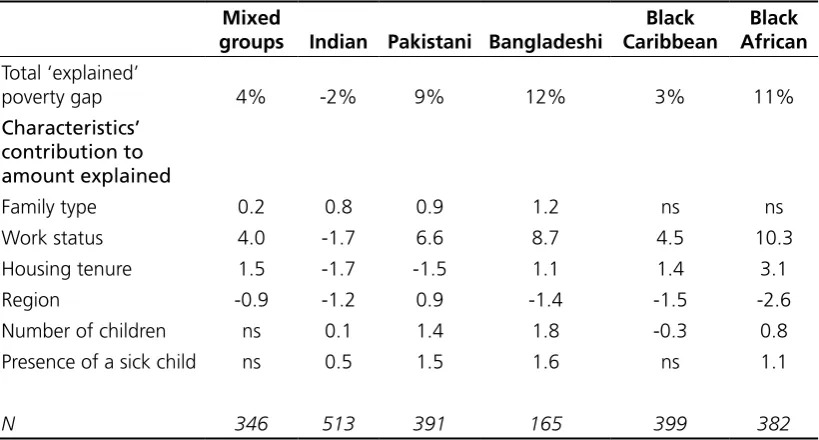
Table 3.2 Contribution of selected characteristics to ‘explained’ share of poverty gap in percentage points, by ethnic group, GB ...62
Table 4.1 Poverty rates at Waves 1 and 2, by ethnic group, UK ...72
Table 4.3 Demographic and work events associated with exit from poverty,
by family type, UK, column percentages ...75
Table 4.4 Demographic and work events associated with entry into poverty, by family type, UK, column percentages ...76
Table 4.5 Demographic and work events associated with exit from and entry into poverty, by ethnic group, UK ...77
Table 4.6 Differences in the probability of poverty entry and exit among children, by ethnic group, UK ...79
Table 5.1 Average deprivation scores in poor and not poor families with children, Great Britain ...83
Table 5.2 Modelling deprivation scores: the role of ethnic group relative to white families’ scores, Great Britain ...86
Table 6.1 Unemployment among men in families with children, ... Great Britain, row percentages...92
Table 6.2 Children aged 0-5 in 1991 and observed aged 10-15 in 2001, by ethnic group and household work status, England and Wales ...96
Table 6.3 Ethnic group associations with exit from a workless household 1991-2001, England and Wales ...102
Table 6.4 Ethnic group associations with entry into a workless household 1991-2001, England and Wales ...105
Table 6.5 Transition patterns, by cohort, England and Wales, column percentages ...108
Table 6.6 Evidence for change in size of ethnic group effects over time, 1981-1991 and 1991-2001, England and Wales ...109
Table 9.1 Distribution of religious affiliation in the MCS, UK ...137
Table 9.2 Religious affiliation and poverty risk, UK ...139
Table 9.3 Religious affiliation and poverty transitions, UK ...140
Table 9.4 Religious affiliation among ONS LS members aged 10-15 in 2001, England and Wales ...142
Table 9.5 Associations of religious affiliation with workless household transitions, England and Wales ...142
Table 9.6 Religious affiliation among Indians and poverty transitions, UK ..143
Table 9.7 The impact of religious affiliation on workless transitions for Indian children 1991-2001, England and Wales ...144
Table 9.8 Poverty transitions among Muslims by ethnic group, UK ...145
Table 9.9 Workless household transitions 1991-2001 among Muslims, by ethnic group, England and Wales ...146
Table A.1 Ethnic group of children aged 0-5 by cohort in the ONS LS, England and Wales ...164
List of figures
Figure 2.1 Composition of non-equivalised income averaged across households with children, by ethnic group (weekly amounts), Great Britain ...37 Figure 2.2 Composition of non-equivalised weekly income averaged
across households with children, by ethnic group
(proportions), Great Britain ...38 Figure 2.3 Composition of non-equivalised weekly income averaged
across poor households with children, by ethnic group
(proportions), Great Britain ...39 Figure 2.4 Composition of non-equivalised weekly income averaged
across non-poor households with children,
by ethnic group (proportions), Great Britain ...41 Figure 2.5 Composition of non-equivalised weekly income averaged
across couple families with children, by ethnic group
(proportions), Great Britain ...42 Figure 2.6 Composition of non-equivalised weekly income averaged across
lone parent families with children, by ethnic group
(proportions), Great Britain ...43 Figure 2.7 Composition of non-equivalised weekly income averaged across
poor couple parent families with children,
by ethnic group (proportions), Great Britain ...44 Figure 2.8 Composition of non-equivalised weekly income averaged across
poor lone parent families with children, by ethnic group
(proportions), Great Britain ...45 Figure 2.9 Composition of non-equivalised weekly income averaged across ...
households with children with at least one worker,
by ethnic group (proportions), Great Britain ...46 Figure 2.10 Household work status of households with children,
by ethnic group, Great Britain ...47 Figure 2.11 Composition of non-equivalised weekly income averaged
across poor households with children with at least
one worker, by ethnic group (proportions), Great Britain ...49 Figure 2.12 Composition of non-equivalised weekly income averaged
across households with one or two dependent children,
by ethnic group (proportions), Great Britain ...50 Figure 2.13 Composition of non-equivalised weekly income averaged across
poor households with one or two dependent children,
by ethnic group (proportions), Great Britain ...51 Figure 3.1 Predicted poverty risks across two family types,
by ethnic group at average values of all other
Figure 4.1 The relationship between incomes at Wave 1 and those at Wave 2 for the families of young children,
by ethnic group, UK ...71 Figure 6.1 Employment and economic activity among those of working age,
by ethnic group and sex, percentages, Great Britain ...90 Figure 6.2 Children’s transitions between workless households,
1991-2001, England and Wales ...97 Figure 6.3 Predicted probabilities of exit from and entry to a workless
household, by selected ethnic group and local
unemployment rates, England and Wales ...107 Figure 7.1 Predicted probabilities of being in a workless household
in 2001, by 1991 household work status, unemployment
rate and ethnic group, England and Wales ...115 Figure 7.2 Ethnic group and area characteristics, England and Wales ...117 Figure 8.1 Difference between mean and median unequivalised
weekly incomes in £ per week for households with
children, by ethnic group, Great Britain ...120 Figure 8.2 Income composition among poor and not poor white
households with children and by income quintiles,
Great Britain ...121 Figure 8.3 Income composition among poor and not poor Indian
households with children and by income quintiles,
Great Britain ...122 Figure 8.4 Characteristics of poor and not poor Indian households
with children, Great Britain ...123 Figure 8.5 Income composition among poor and not poor
Pakistani households with children and by income
quintiles, Great Britain ...125 Figure 8.6 Characteristics of poor and not poor Pakistani
households with children, Great Britain ...126 Figure 8.7 Income composition among poor and not poor black
Caribbean households with children and by income quintiles, Great Britain ...128 Figure 8.8 Characteristics of poor and not poor black Caribbean
households with children, Great Britain ...129 Figure 8.9 Income composition among poor and not poor
black African households with children and by
income quintiles, Great Britain ...131 Figure 8.10 Characteristics of poor and not poor black African households
Acknowledgements
The Author
Abbreviations
AHC After housing costs
BCS70 1970 British Cohort Study
BHC Before housing costs
BHPS British Household Panel Survey
CeLSIUS Centre for Longitudinal Study Information
and User Support
DWP Department for Work and Pensions
EMETF Ethnic Minority Employment Task Force
FRS Family Resources Survey
HBAI Households Below Average Income
HMSO HM Stationery Office
HRP Household Reference Person
LFS Labour Force Survey
MCS Millennium Cohort Study
NAO National Audit Office
NCDS National Child Development Study
NISRA Northern Ireland Statistics and Research
Agency
OLS Ordinary least squares
ONS Office for National Statistics
ONS LS Office for National Statistics
Glossary
Italics refers to terms explained.
Coefficient In Regression analysis, the net contribution of each characteristic to the outcome of interest (e.g. poverty) is summarised by a coefficient. This coefficient expresses the effect of an increase in the characteristic if it has a continuous range (e.g. age). Where the characteristic has categories, each category is expressed as a ‘dummy variable’ with a value of 1 where the category applies and a value of 0 otherwise. One category is excluded; and the meaning of the coefficient is then the effect of having that characteristic relative to being in the excluded (or reference) category. The reference category is typically the majority category. Thus, for example, with ethnic group analysis the reference group is typically white and dummy variables are included for all the minority categories. The coefficient for each ‘dummy’ category is the effect for that group compared to being white.
Confidence intervals All survey data can only approximate poverty rates (or other characteristics) across the population as a whole. Thus, some apparent differences in poverty rates among the survey respondents may not reflect true differences in the population. Confidence intervals provide a range around estimated rates within which we can be reasonably confident (typically 95 per cent confident) that the ‘true’ value falls. If these ranges for two groups do not overlap then we can be confident that there is a genuine difference between the groups. If the ranges do overlap then we cannot be confident that differences observed in our survey data can be generalised to the population. See also Statistical significance.
Control Refers to the practice of estimating
differences between groups in poverty risks over and above differences in family type, working status or other factors, which might be expected to contribute to differences in poverty rates. Controlling for characteristics allows us to look at the influence of ethnicity at common values of the other characteristics, that is when all the other characteristics are ‘held constant’.
Deprivation Deprivation scores complement the income
Ethnic group Refers to standard Office for National Statistics (ONS) categories of ethnicity that are typically collected in surveys. The categories used for the 2001 Census, or variations on those categories, form the basis of most of the analysis. For analytical coherence and for reasons of sample size, only a selection of the categories are used (typically six or seven categories). Ethnic group is measured at the level of the child, one of the parents or the composition of the household in which the child lives, depending on the specific data source and the analysis being conducted.
Hold constant See Control.
Multivariate analysis See Regression analysis.
Persistence Refers to the duration of a state over a period of time which is important for understanding the impact of that state. This report examines both poverty persistence and unemployment persistence, which can be contrasted with analysis examining movements in and out of poverty (poverty transitions) or of worklessness (workless transitions).
Poverty In this study, poverty is defined as living in a
Poverty penalty The term used to describe unexplained differences in estimated poverty risks between children from different ethnic groups whose family circumstances are otherwise similar. That is, it is the difference in risks once relevant factors have been simultaneously controlled. The poverty penalty comprises all those unmeasured and unmeasurable factors that cause otherwise comparable families to have different rates of poverty. The presence of an ethnic poverty penalty then implies that we need further information to understand those differences and that addressing known poverty risk factors will not on its own remove differences in poverty between ethnic groups.
Poverty rate The share of a group or a sub-population who
are in poverty. For example one group may have a poverty rate of 50 per cent and another may have a poverty rate of 20 per cent.
Poverty risks A key concept underpinning much of the analysis is the notion of differences in poverty risks. At the simplest level the risks of poverty for children from the various ethnic groups are the same as the poverty rate within the group. That is, if 50 per cent of a group is in poverty (a poverty rate of 50 per cent), then the risk of any child from that group being in poverty is also 50 per cent. Risks can also vary among those with similar individual or family characteristics, so that a child from a certain group may have a higher or lower poverty risk given family type.
Predicted probabilities Provide a way of illustrating the results from regression analysis where there are two possible outcomes (e.g. poor versus not poor).
The coefficients from such analysis are not
very informative in terms of understanding the scale of an association between poverty and other variables in the analysis (such as ethnic group). By estimating probabilities of being poor for different groups at specified levels of all the other characteristics, we can easily see the impact of belonging to that group. This can be important as it shows us the size of the ethnic group effect rather than simply
the statistical significance, since statistically
significant differences may, nevertheless, be small or they may be substantial.
Statistical significance Summarises the extent to which we can be confident that a relationship observed in our data can be generalised to the population. Conventional levels for indicating statistical significance are five per cent, one per cent and 0.1 per cent, indicating that there is a five, one or 0.1 per cent chance, respectively, that the association in our data will not be found in the population. Smaller chances of an arbitrary finding increase the confidence with which it is possible to claim the result. However, associations which are highly statistically significant (e.g. 0.1 per cent or below) may not necessarily be large. It can therefore be important to consider the size of the association as well as the confidence with which we can claim it.
Workless households These are defined as households in which no adult member is in paid work (either full-time or part-time).
Summary
Introduction
Child poverty commands widespread national and international concern. The United Kingdom (UK) has established its ambitions to end child poverty, with interim targets for substantial reductions and an apparatus to monitor progress. However, the poverty of ethnic minority children has not been strongly emphasised within the child poverty agenda by means, for example, of specific targets for ethnic minority groups. This is despite the fact that children from minority ethnic groups are overrepresented among poor children. Ethnic minorities make up 12 per cent of the population and 15 per cent of children, but 25 per cent of children who are in poverty (author’s own analysis of Households Below Average Income figures 2003/04 – 2005/06). That equates to 700,000 children, a number set to grow by 50,000 by 2010 (Sharma, 2007). All minority groups have higher rates of child poverty than the majority and the poverty rate for Bangladeshi children approaches two-thirds, compared to an average of one fifth. As these children become adults they will carry with them the consequences of childhood poverty and, to the extent that poverty is intergenerational, minorities may make up an increasing share of those in poverty in the UK. The greater risks of poverty faced by children from minority groups demand attention. Yet we do not know if policies to improve family incomes affect all groups evenly. Given higher chances of poverty across minority groups overall, are minority group families with children more responsive to policy levers to reduce child poverty? Or is poverty more intractable and severe – are minority group children at risk of being left behind as other children are gradually lifted out of poverty? What are the implications for the future welfare of the UK’s minority groups? At present we are not in a position to answer such questions.
Appropriate policy responses to these greater risks require detailed investigation of the patterns of poverty by ethnic group. This report expands our evidence base by offering the most detailed, comprehensive and up-to-date account of ethnicity and child poverty to date.
time. It draws on data from 2002 to 2007 to give a contemporary perspective on child poverty and ethnicity. The report cannot provide a detailed analysis of trends and the impact of policy since the ambition to eliminate child poverty was originally declared, due to small sample sizes in annual data. However, the evidence from rolling averages of pooled data from 2002/03 indicates a marked decline in child poverty among those with the highest poverty rates, Bangladeshi children, and evidence of declines in poverty for Pakistani, black Caribbean and black African children as well. The implication is that minority groups have benefited from child poverty policy, but very large differences in poverty remain.
The main focus of the report is not, though, so much on trends as on illuminating the extent to which ethnic minority children’s poverty can be understood in terms of recognised risk factors that policy is already concerned to address, such as the high poverty rates among lone parent families.
It explores the extent to which it is possible to explain the poverty of ethnic minority children in terms of known risk factors, and whether poverty of minority ethnic groups appears to be more intractable than the majority experience of poverty. Importantly, the report focuses on the specific experience of different ethnic groups, illuminating the diversity across groups and highlighting the distinctive patterns of poverty that characterise the experience of children from particular minority groups.
This summary highlights the main findings of the report and their implications for the experience of particular groups.
Main findings
Poverty rates
Child poverty differs widely across ethnic groups. All minority groups have higher rates of poverty than the average and compared to the white majority, according to the standard measure adopted by the Government for monitoring child poverty.1
With a fifth of children in poverty overall, black Caribbean and Indian children had rates of poverty of 26 and 27 per cent rising to 35 per cent for black African children. Over half of Pakistani and Bangladeshi children were in poverty according to most recent figures.2 With an increasing proportion of children made up of
those from minority groups this is a cause for concern not only for the welfare of these children in the present but also for the future prosperity and equality of the UK’s minorities.
1 The standard measure is living in a household with income adjusted for
family size which is below 60 per cent of the median, without deducting housing costs.
2 Note that these rates are calculated from averaging the most recent three
These poverty rates have shown some diminution since 2002/03-2004/05, when they were even higher for all minority groups, but they remain striking and demand explanation.
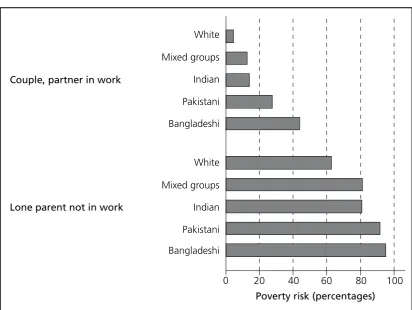
The poverty of minority groups is not just a result of higher numbers of families at risk of poverty, such as lone parents or large families; the risks of poverty associated with living in different types of family also differ across groups. Thus, for example, children in white couple parent families had a 14 per cent risk of being in poverty, but Bangladeshi children in couple parent families had a 66 per cent risk. Similarly, white children in a one or two child family had a 17 per cent chance of poverty but Pakistani children in a small family had a 49 per cent chance of being poor. And while risks of being poor were high for all children in lone parent families, they were yet higher for some groups than others with, for example, 36 per cent of white children in such families being in poverty but 46 per cent of black African children in lone parent families being poor.
There were also striking differences between the minority groups, both in the patterns of family type and the poverty risks associated with them. Thus, for example, the chances of being poor for Indian children living in households without a worker were 70 per cent, but only 12 per cent of Indian children lived in such households. By contrast, black African children living in a workless household had a slighter lower risk of poverty – 62 per cent – but 37 per cent of all black African children lived in such households. This means that policy to address the poverty of workless households can be expected to have a bigger impact on black African child poverty than on Indian child poverty.
As noted, living in a lone parent family brings relatively high risks of poverty across groups. But between minority groups both the risks and the chances of living in such a family varied. Thus, for example, the risks of poverty among children living in lone parent families were 49 per cent for Pakistani children and 39 per cent for black Caribbean children; but only 17 per cent of Pakistani children were in lone parent families, compared to 56 per cent of black Caribbean children. Policy to reduce the poverty of lone parent families will thus be much more pertinent to the experience of poor black Caribbean children than Pakistani children, even though they have somewhat lower risks of poverty.
Ethnic poverty penalties
The report examines whether such differences in poverty rates constitute an ‘ethnic poverty penalty’ for children from some groups. That is, if we control for measurable factors which we know are linked to differences in poverty risks – such as employment status and family structure – can we explain ethnic differences in poverty in terms of those risks, or are there additional, ‘unexplained’ differences?3
The report finds that higher poverty risks for minority ethnic groups are not simply the result of higher proportions of families which we know are at higher risk of poverty, such as lone parent families, large families or workless families. There were, rather, ethnic poverty penalties, for all the main minority groups, that is Bangladeshi, Pakistani, Indian, black African and black Caribbean children (though when we focused just on families with young children, a poverty penalty for black Caribbean and black African children was not observed).
Income sources
If it is income that determines whether or not a family is in poverty, whence does that income derive and do income sources vary across ethnic groups? These are relevant questions for thinking about how incomes might be improved among poor families and also to understanding why those families are poor in the first place. It is also of interest to consider how much income sources differ between poor families with children and families with children that are not living in poverty. If income sources vary substantially between poor and not poor households with children, then it might be thought that focusing on increasing those elements of income that differ substantially might help those in poverty, especially if income sources among poor households are rather similar across groups.
Looking at the sources of income across ethnic groups, there were clear differences between groups. Average household incomes were highest for Indian households with children and lowest for Bangladeshi households with children. There were also clear differences between families that were and were not living in poverty, with earnings playing a much more important role among those families that were not poor, and benefits forming a much more substantial share among those that were poor.
But among poor families, there were also differences across ethnic groups. Thus, poor Indian families still had a relatively large share of their income coming from earnings and a correspondingly smaller share coming from benefits. There were also differences among families above the poverty threshold. For example, benefits and tax credits made up a substantial share of the incomes of Pakistani and Bangladeshi households with children that were not in poverty, indicating the role of these income sources in helping families avoid poverty.
3 A more detailed discussion of what constitutes an ethnic poverty penalty can
Poverty experience over time
Poverty is most often measured at a point in time. However, policy is very well attuned to the recognition that poverty can be long-term or short-term, a one-off experience or persistent (or recurrent). Long-term poverty is potentially of greater concern as it can have more severe consequences and mean that a low standard of living one year is not ameliorated by a higher standard of living the next. Thus, there can be a cumulative impact on standards of living. However, due to previous data limitations, there has been very little evidence on differences in poverty persistence across ethnic groups. In spite of data limitations, this research did manage to investigate poverty persistence to a certain extent across ethnic groups. Looking at just two time points and data covering young children only, the analysis showed that Pakistani, Bangladeshi, black Caribbean, black African and mixed ethnicity families were more likely to be in poverty at both points than white families.
If poverty persistence – or the inability to escape poverty – is of substantial concern, an additional source of concern is the risk of falling into poverty. The research found that risks of entering poverty having not been in poverty around two years earlier, were significantly greater for Indian, Pakistani, Bangladeshi and mixed ethnicity families with young children than for white majority children, even when holding constant relevant family characteristics.
Poverty and deprivation
Just as poverty persistence gives some insight into longer-term standards of living, so more direct measures of standard of living or of deprivation can amplify our understanding of the experience of poverty and its variation across ethnic groups. Standard measures of poverty are based on low income measures. However, the child poverty monitoring process also recognises the importance of deprivation measures as indicators of lower standards of living. Investigating the incidence of deprivation across groups, we found that rates of deprivation were significantly higher for mixed ethnicity, Pakistani, Bangladeshi, black Caribbean and black African children than for white children. Indian children’s rates of deprivation were very similar to those for white children. When controlling for family characteristics, significantly higher rates of deprivation were still found for all those groups with absolutely higher rates; and Indian children also had significantly higher rates of deprivation than their white counterparts (or deprivation penalties), once like was compared with like. This held true when income poverty status was also held constant. So minority groups were at greater risk of deprivation even among the income poor.
Workless households
a growing concern and many poor children are living in households with at least one earner, a relatively low proportion of children who live with no earners can avoid poverty.
Analysis in this report, therefore, explored whether children are likely to live in a workless household over a ten year interval – or whether they experience moves into or out of a workless household between the two time points. This also enables a longer-term perspective across children’s childhoods. This analysis showed that risks of entry into a workless household were significantly higher for Pakistani and Bangladeshi children even after controlling for a range of family, household and local area characteristics. Moreover, the additional risks for Pakistani children appeared not to have reduced over time, when compared with a cohort born ten years earlier.
Diversity between ethnic groups in experience of poverty
The findings summarised above relating to poverty rates, income sources, poverty persistence, deprivation, and workless households indicate that children from minority ethnic groups have a diverse experience of poverty and that its causes vary by group. Issues potentially contributing to differences in poverty across groups include: employment rates, hours of work and pay, non-take-up of benefits and credits, numbers of adults in employment relative to dependants within the household, and lack of additional ‘buffers’ such as savings, sources of credit or alternative incomes. However, given the differences in experience of poverty across ethnic groups these factors are likely to vary in importance depending on the group.
The experience of children from different ethnic groups showed some highly distinctive features. Indian children had poverty rates that were not hugely above the average and were substantially lower than those for Pakistani, Bangladeshi and black African children. However, unlike for other groups, where some part of their increased poverty risks could be attributed to having more characteristics associated with higher poverty risks, Indian children’s poverty gap was not associated with risky characteristics. Indeed, controlling for their characteristics resulted in them having a higher poverty penalty than their original poverty gap. That means they could expect to have lower poverty rates than the majority. Conversely, if they had the same characteristics as the white majority they would have poverty rates higher than those they currently experience. In particular, rates of working and the role of earnings in total income are greater for poor Indian families than they are for the majority. So, although Indian children’s poverty is not as great as that for some minority groups it is perplexing.
measures; but the experience of Pakistani children seemed, in some cases, less susceptible to being accounted for in terms of known risk factors. The evidence also indicated that for Pakistani children their ethnic penalties showed no evidence of decreasing over time.
For both Pakistani and Bangladeshi children, the experience of those not in poverty appeared to be closer to that of those below the poverty threshold than it was for other ethnic groups. This was indicated by rates of deprivation among those not in poverty, by similarities in income sources among those poor and those above the poverty threshold, and by the greater risks of moves into poverty than for other groups. Benefits and tax credits made up a substantial share of the incomes of Pakistani and Bangladeshi households with children that were not in poverty, indicating the role of these income sources in helping families avoid poverty. Black Caribbean and black African children had different rates of poverty, with black African children generally having higher risks of poverty across a range of measures. In addition there were a number of differences in the household characteristics of these families and in the risks associated with particular family types. Nevertheless, their poverty experience shared many features: much of their poverty could be understood in terms of the greater risks associated with particular characteristics, particularly lone parent families and workless families. Poor families from these groups, particularly poor Caribbean families, received little of their income from earnings. Conversely, non-poor households typically had an earner. Differences in worklessness and in workless transitions could be linked to family and household characteristics that put them at higher risk of being in, or moving into, a workless household circumstances rather than to an ‘ethnic workless penalty’. Yet, for both these groups, deprivation was higher among the non-poor than would be expected, suggesting their standard of living may be lower than relative low income measures imply.
Area issues
Two additional themes were covered in the report. First was the contribution of differences in geographical distribution and across areas with different levels of deprivation to poverty differences. Local labour market characteristics were found to be important in increasing risks of living in a workless household, but the ethnic composition of an area did not contribute to explaining ethnic group differences in worklessness.
Religion
Implications for policy and future research
Implications for policy
Risk factors for poverty such as living in a lone parent family, living in a family with a disabled member and living in a workless family vary in their distributions across children from different ethnic groups. This suggests that policies to address these risk factors will tend to reduce the poverty differences between certain minority ethnic groups and the majority. Some groups will be more affected by certain policy in certain areas. For example, black Caribbean children are likely to benefit from policies to reduce lone parent poverty, while Pakistani children are likely to benefit from policies to reduce poverty in households with a disabled person. However, the poverty risks associated with family and household circumstances also vary between groups. Risks for any given family circumstances tend to be higher for children from minority ethnic groups; and in some cases, such as the risks of poverty among Bangladeshi children living in a working family, much higher. Therefore, tackling poverty of minority ethnicity children will also involve understanding and paying attention to the causes of these greater risks for apparently similar circumstances.
This report suggests that the following factors may contribute to the differences in poverty across groups: employment rates, hours and pay, non-take-up of benefits and credits, numbers of adults in employment relative to dependants within the household and lack of additional buffers such as savings, and alternative incomes. Addressing differentials across these areas will contribute to reducing children’s ethnic poverty penalties.
Deprivation analysis suggests that some of those who are not poor by the standard income measure are, nevertheless, experiencing hardship. Deprivation among those not poor is greater across minority groups than for the white majority. In addition, some groups, such as black Caribbean children were found to be at a disadvantage in terms of deprivation compared to otherwise comparable white children, even when they did not appear to be at greater risk of poverty compared to white children in similar family circumstances. These higher deprivation rates potentially reflect a lower standard of living on a given income. This raises concerns that even if policies raise some groups out of income poverty it may still leave them with a deficit in terms of standard of living.
The overarching messages for policy are that:
• consideration of ethnicity should be explicitly incorporated within the child poverty agenda to enable the impact of policies across and within groups to be evaluated and to ensure that certain groups are not left behind;
• when evaluating impact of policy, it may be important to consider how different measures tell different stories across ethnic groups;
• attention should be paid to the amelioration of poverty among those who are potentially the most severely affected;
• at the same time, much strategy focuses on the currently poor, but some groups have much greater risks of falling into poverty or into a workless household. Protecting those children not in poverty against becoming poor could potentially play an important role in reducing poverty differences between ethnic groups; • differences in child poverty between groups can be as great or greater than
those between minorities and majority. Policy needs to be sensitive to these differences and to ways of targeting the different risks across groups.
Implications for future research
The evidence presented in this report has pointed to a number of findings which cannot be fully explained. These include:
• the existence of poverty penalties for point in time poverty for a number of minority groups. That is, greater chances of poverty compared to the white majority which cannot be attributed to relevant, known risk factors, and which therefore, remain unexplained;
• poverty penalties in risks of entry into poverty for a number of minority groups relative to white majority comparators;
• penalties relating to risks of entry into workless households for Pakistani and Bangladeshi children, relative to white majority comparators;
• penalties in levels of deprivation among income poor families with children, relative to white income poor families with children;
• penalties in levels of deprivation among non-income poor minorities, relative to majority non-poor families.
The report suggests that the evidence base remains partial. In particular, additional research across the following areas would assist in addressing these unexplained findings:
• the use of benefits across groups, in particular whether there are differences in take up;
• living standards among poor and not poor families by ethnic group and the relationship between poverty duration and living standards across ethnic groups;
• protective factors including savings and assets as well as ability to draw on sources of credit, and how they vary across ethnic groups;
• how differences in risks of becoming poor relate to past experience or to accumulation of resources or assets.
Moreover, questions remain about the extent to which the consequences of poverty are similar or different for minorities compared to the majority. It would, therefore, be valuable to explore:
• how poverty persistence and poverty dynamics influences subsequent experience of minority ethnic group children;
• whether the consequences of child poverty for later life outcomes vary across ethnic groups, and the extent to which these are influenced by the extent of poverty within the ethnic group.
1 Introduction: ethnicity
and child poverty
This report addresses an important but neglected dimension of child poverty: the variation in child poverty across ethnic groups and the reasons for those differences. While child poverty has maintained a prominent position on the policy agenda the poverty of children from minority groups has received much less sustained interrogation and analysis and policy attention, despite being greater than the child poverty average for all minority groups and twice or three times as large for some minority groups.
Given the lack of research attention paid to the topic of ethnic minority child poverty, this report sets out to provide a wide-ranging treatment of the topic, supplying a comprehensive analysis of a number of different aspects of minority group children’s poverty experiences in one place and within the possibilities of existing data sources. It thus aims to build up a baseline of evidence on, and understanding of, ethnicity and child poverty, using insights from different sources and different approaches in a complementary fashion, and to establish a starting point for subsequent analyses. Moreover, the wide sweep of the analysis is intended to provide a much stronger grasp of the experience of individual minority groups and variation within those minority groups, in addition to their relative position with respect to the majority and, to a lesser extent, each other.
This introduction sets out the rationale for the report more fully (Section 1.1) and makes a case for the importance of incorporating an understanding of ethnic difference into the child poverty agenda (Section 1.2), noting how existing child poverty research has amplified our understanding of poverty risks and policy interventions. It outlines the specific questions that the research set out to address (Section 1.3); and briefly outlines the sources and approaches that the report utilises in order to address them (Section 1.4).
• the role of family structure and type in risks of poverty;
• in-work poverty as well as the poverty associated with workless households; • acknowledgement of the limited understanding of ethnic group differences in
poverty;
• the extent of within group diversity in poverty outcomes, including diversity in religious affiliation;
• the importance of locality in understanding poverty differences.4
1.1
Background and context
1.1.1 Background and rationale
One of the features of child poverty in the UK that attracted initial policy concern was the fact that the rates of child poverty are consistently higher in this country than poverty rates in the overall adult population – and that this is not the case in all comparable developed nations (Bradshaw, Ditch, Holmes and Whiteford, 1993). The other feature that stimulated particular concern about the UK scenario was the comparatively very high rates (UNICEF, 2000). In the mid to late 1990s, the UK suffered higher child poverty than nearly all other industrialised nations. The Prime Minister at the time responded to this by making a pledge to eradicate child poverty within a generation in March 1999 (Blair, 1999). This pledge was later supported with challenging Government targets to reduce child poverty by a quarter by 2004/05, to halve it by 2010/11, on the way to eradicating it by 2020.
To date the Government’s strategy has focused on increasing employment levels for parents and increasing financial support for families with children, and there have been some successes. It is, however, acknowledged that more needs to be done to address the particular issues facing ethnic minority families with children where rates of child poverty tend to be higher than for comparable white groups (Harker, 2006). This issue was highlighted in the strategy document ‘Working for Children’ (DWP, 2007b).
Poverty rates across minority groups are higher than those experienced by the majority. In addition, as in the population as a whole, child poverty rates are higher than the poverty rates of adults of the same ethnic group. Moreover, minority group children are over-represented among children relative to minorities in the
4 The research focus was shaped by emerging research findings and
population.5 Minorities made up 15 per cent of children in Great Britain on average
over 2002/03-2005/06, compared to 12 per cent of the overall population. This combination of factors means that while the population share of minority groups remains small, minority group children made up 25 per cent of children in poverty, or nearly 700,000 children (author’s own analysis of Households Below Average Income (HBAI) figures 2003/04 – 2005/06). And Barnardo’s (Sharma, 2007) have projected the increases in the numbers of poor children from certain ethnic groups in poverty in the medium term at around 50,000 more Pakistani, Bangladeshi and black children being in poverty by 2010 on current policies. As these children grow up, if there is intergenerational persistence of poverty, we may see the proportion of those in poverty from minority groups increasing. On the other hand, major investment to reduce child poverty could disproportionately benefit minority group children.
For these reasons, there is a good case to be made that ethnicity should be central to the child poverty agenda. Yet detailed analysis and understanding of the profile of, and influences on, ethnic minority poverty has not followed from this or been actively pursued. Differentials in child poverty by ethnicity are now well known in broad terms; but little detailed contemporary analysis has followed from that. For example, the last detailed study of ethnic variations in incomes and poverty was carried out by Berthoud (1998), and that report did not focus specifically on child poverty. Research is lacking in terms of attention to variation across measures – or the different poverty ‘stories’ for different groups. Arguably, concern about the ethnic minority dimensions of child poverty is less forceful or cogent than that which the agenda overall commands.
This report, therefore, attempts to provide an evidence base on child poverty and ethnicity and at the same time address the lack of prominence of ethnic minority child poverty within child poverty debates.
1.1.2 Child poverty as an issue
We have a highly detailed understanding of child poverty overall; and there is continuing evidence of the substantial levels of interest it commands. Since the Labour Government’s commitment to eradicate child poverty within a generation (Blair, 1999), child poverty has been a high profile policy issue. Interim targets and an annual process of monitoring progress towards those targets (DWP, 2006) have maintained a spotlight on children’s economic welfare. The annual publication of the HBAI figures (DWP, 2008) have attracted media and Parliamentary attention. And there have been two Select Committee reports on child poverty in the last four years (House of Commons Work and Pensions Committee, 2004; 2008). The most recent Select Committee Report (House of Commons Work and Pensions Committee, 2008) serves to illustrate the very limited understanding that exists
5 Including white minorities, who made up three per cent of the total
of ethnic differentials, their contours and causes, and the confusion that this can result in: ‘We received mixed evidence on the reasons why so many children from certain ethnic minority groups live in poverty’ (paragraph 184).
1.1.3 The existing evidence base
Extensive in-depth analysis of child poverty has both stimulated and followed the growth in interest in child poverty in the UK. And this has taken place across a range of aspects and dimensions, such as a detailed understanding of poverty risks and distributions (Brewer et al., 2008), income sources and the role of income-related benefits, the dynamics of poverty and poverty persistence (Hill and Jenkins, 2001; Jenkins and Rigg, 2001), deprivation approaches to poverty (Gordon et al., 2000; Pantazis et al., 2006), policy application and impact (Piachaud and Sutherland, 2001), cross-national comparisons, both cross-sectional (Vleminckx and Smeeding, 2001) and longitudinal (Bradbury et al., 2001) and the consequences of poverty experienced as a child in adult life (Ermisch et al., 2001).
More recently there has been an interest in severity of poverty (Adelman et al., 2003; House of Commons Work and Pensions Committee, 2004), though severity is not explicitly related to the monitoring of child poverty, unlike persistence and deprivation.
Issues in poverty measurement have also been discussed and debated (Böheim and Jenkins, 2006; McKay, 2004) , including through the consultation on how best to measure and monitor the Government’s child poverty targets (DWP, 2003). Emerging academic concerns have paid attention to the meaning of welfare and alternative conceptions of child well-being (Bradshaw and Mayhew, 2005). Government has also engaged with the research community and the evidence base in reviewing its progress on the child poverty agenda (Harker, 2006; HM Treasury, 2004). Most recently, the cross-departmental statement, Ending Child Poverty: Everybody’s business (HM Treasury, 2008) outlined the current state of knowledge relating to child poverty risks, the costs and causes of child poverty, the impact of policy up to 2008 and the future policy strategy for moving towards the eradication of child poverty by 2020.
1.2
The case for a focus on ethnicity
1.2.1 What we know about ethnicity and child poverty
The few exceptions highlight the overall limitations of our evidence base in this area. For example, Bradshaw et al. (2005) explored variation across ethnic groups in terms of parental socio-economic status and Magadi and Middleton (2007) investigated the extra risks of severe poverty faced by certain ethnic groups, while Jayaweera et al. (2007) looked at the situation of mothers of young children. Ethnic variation has also been covered in some studies within a more general discussion relating to children and poverty, for example in relation to large families (Iacovou and Berthoud, 2006); and HBAI tables give an overview of differences in poverty risks by ethnic group and the ethnic composition of low income populations (DWP, 2008).
These examples tend to highlight the limitations of our knowledge as much as to increase it and raise as many questions as they answer. Moreover, as the Select Committee quotation cited above revealed, there is no common understanding of the features or causes of ethnic differences in poverty. There is, therefore, a need to amplify our understanding of the poverty of children across and within ethnic groups and this report represents a significant step in that direction.
1.2.2 Bringing ethnic minority employment and child poverty agendas together
Arguably, one reason for the relative lack of attention to ethnic group within the child poverty agenda is that the policy focus relating to ethnic minority disadvantage has been on employment differentials; and that child poverty and employment agendas have not been well-integrated either at national or at European level (Platt, 2007a). At around the same time as the child poverty agenda was taking off, there was also increasing interest in differences in employment rates across ethnic groups. In 2001 the Prime Minister asked the Strategy Unit to investigate this issue. And this interest was also reflected in a DWP Public Service Agreement target on narrowing employment gaps, including the ethnic minority employment gap. A final report from the Strategy Unit in 2003 (Cabinet Office, 2003) included a recommendation for establishing a cross-departmental Ethnic Minority Employment Task Force (EMETF). There is now a very extensive evidence base relating to the employment of men and women from different ethnic groups; and a range of policy initiatives aimed at improving the employment rates of minorities has been implemented. However, the potential impact of employment patterns on child poverty has not been directly evaluated.
and solutions are framed. And while broad differences in poverty rates between ethnic groups are well known, many of the measures that are used for monitoring progress on child poverty are not (and are often not able to be) sensitive to ethnic group differences.
If the child poverty agenda has struggled to incorporate an understanding of ethnic differences, the ethnic minority employment strategy has struggled to get a clear grasp of what the implications might be for child poverty. The difficulty in marrying the two agendas has potentially been exacerbated by the move within the DWP from a focus on disadvantaged groups to an areas focus, and the consequent difficulty for the employment strategy of targeting policy towards minority groups specifically (National Audit Office (NAO), 2008).
Overall, then, there is a strong child poverty agenda, but it is not differentiated by ethnic group, raising the question of whether the impact of policy works in the same way for ethnic minority group children.
In 2006, the EMETF requested a paper on ethnicity and child poverty specifically making the link between the work of the Task Force and the child poverty agenda (Platt, 2006a). This paper was then drawn on in DWP’s specially commissioned review of their child poverty strategy (Harker, 2006). The research in this report builds on – and is a response to – some of the gaps highlighted in that initial paper. It aims to contribute an important shift and lay the possible foundations for greater integration of ethnicity and child poverty agendas at a policy level.
1.3
Research questions
Given the paucity of detailed evidence on child poverty experience across ethnic groups, it was clear that this study faced a wide range of possible research questions. As discussed in Section 1.2, the gaps in our knowledge in relation to ethnicity span the various aspects of child poverty that have been relatively intensively researched for the population as a whole. The research, therefore, aimed to provide coverage across a wide range of aspects of poverty, establishing a broad evidence base, with a greater level of detailed analysis in specific areas and providing ways of understanding the poverty experience of individual groups. The research was designed to build from the basic facts about poverty rates and poverty risks across groups, to take account of certain aspects of poverty such as poverty persistence and deprivation, and establish a picture of the experience of individual ethnic groups overall, including looking at similarity and difference between those poor and those not poor.
• What is the incidence of child poverty across ethnic group?
• What are the distributions of poverty across different types of family by ethnic group?
• To what extent can we understand differences in poverty in terms of differences in distributions of ‘high risk’ families across ethnic groups?
• Alternatively, to what extent is there evidence for an ethnic ‘poverty penalty’? These questions are considered in Chapters 2 and 3.
Given the interest in poverty persistence (DWP, 2003; DWP, 2005; DWP, 2008; Hill and Jenkins, 2001) a further set of questions related specifically to issues of duration, and of poverty exit and entry.
• To what extent are some groups more at risk of poverty persistence than others?
• How can we understand such differences? These questions are considered in Chapter 4.
Understanding duration of poverty gives some insight into the variation in the experience of poverty not captured by cross-sectional measures, including the impact of income on standards of living over time. Another way to explore differences in experience of poverty and to learn something about living standards is to look at deprivation measures. Therefore, a small set of questions aimed to amplify the picture of poverty shown from income poverty measures by asking: • How does deprivation vary across ethnic groups?
• And how does it vary between income poor and not income poor? These questions are considered in Chapter 5.
Moreover, to enhance information on duration of disadvantage, and given the close links between worklessness and poverty, medium term persistence in workless households were the focus of a further subset of questions, namely: • What are the patterns of workless household persistence (or entry and exit) for
children across ethnic groups?
• And how has this changed over time? These questions are considered in Chapter 6.
With the reconfiguration of the DWP’s agenda relating to disadvantaged groups around an area focus, there has been increasing interest in understanding the influence of locality on life chances. Further questions which the study aimed to address were:
These questions are considered in Chapters 6 and 7.
Both research and policy have moved away from a consideration of minority groups as homogenous or treating them as a single population for the purposes of policy intervention. The diversity of experience across ethnic groups is continually stressed (Clark and Drinkwater, 2007; Modood et al., 1997; Platt, 2007b). There was, therefore, a need to differentiate groups’ experience; and the attempt to understand these different ‘stories’ in their own terms is a way of recognising diversity both between and within minority groups. Related to this was an interest in the diversity within groups and the extent to which those in poverty were distinct from those not in poverty, or whether there was, instead some sort of continuum of experience. The research therefore set out to explore the following questions: • What are the sources of income for poor children across ethnic groups? • How does this differ between poor and not poor children?
• What can be said about the overall patterns of poverty experienced by particular groups?
• What is the composition of poor families by ethnic group?
• How does this compare with those families not poor for each group?
Income sources are explored in Chapter 2, and Chapter 8 considers the cumulative evidence on particular groups.
Recognition of heterogeneity within groups has also brought increasing attention to the relationship between religious affiliation and disadvantage (Brown, 2000; Dobbs et al., 2006; Lindley, 2002; Open Society Institute EU Monitoring and Advocacy Program, 2004). Linked to this are the final set of research questions: • Is there a poverty penalty related to religious affiliation?
• And how does this intersect with ethnic disadvantage? These questions are explored in Chapter 9.
In Chapters 2 to 9, the key findings for each chapter are summarised at its conclusion. The key points are additionally brought together in the final Chapter 10 which provides an overview to the research and the responses to the various research questions and their policy implications. Chapter 10 also aims to establish where the evidence provided by this research is partial, and is not adequate to inform policy effectively. It, therefore, aims to answer the questions:
• What are the overarching policy implications of the findings of this report? • What are the remaining gaps in evidence?
1.4
Data sources
This section outlines the sources used in the report. Given the range of questions asked of the project, outlined above, this analysis drew on a wide range of large scale data sets and analytical techniques. It is important to note, moreover, that there is no single source that is ideally suited to the analysis of child poverty by ethnic group and that will provide a detailed delineation and comprehensive understanding. Indeed, data constraints are one of the main reasons why the evidence base on ethnicity and child poverty is relatively underdeveloped.
Both the suitability of particular data sources to addressing different questions in relation to child poverty and ethnicity and the appropriate analytic approaches to employ in answering them were initially explored in a feasibility study (Platt, forthcoming). The feasibility study explored sample sizes for different sources and argued that there exist a number of sources that can be used for particular analyses on a range of aspects of child poverty; and that the aim should be to exploit them effectively and in a complementary fashion.
Table 1.1
Sour
ces used in analysis and key featur
es
Sour
ce
Key featur
es including geographical coverage
Used to
FRS 2002/03-2005/06
Annual cr
oss-sectional survey of about 28,000 households.
Focus on detailed information on income, benefits, assets, and pensions. Also other information including demographic data. Now covers UK (pr
eviously only Gr
eat Britain), but only Gr
eat
Britain r
espondents used in analysis.
(1) pr
ovide descriptive statistics on rates and risks of poverty by
gr
oup and by key characteristics acr
oss gr
oups (Chapters 2 and
8); (2) examine income composition acr
oss and within gr
oups
(Chapters 2 and 8); investigate ethnic poverty penalties using decomposition analysis (Chapter 3); (3) construct deprivation scales and describe and model dif
fer
ences in deprivation acr
oss
ethnic gr
oups (Chapter 5).
HBAI 2002/03-2005/06
Data set derived fr
om the FRS. Contains standar
d low
income measur
es, income deciles and weights to gr
oss up to
population and child population, as well as other variables used in HBAI r
eports. Gr
eat Britain coverage as above.
(1) estimate poverty rates and tr
ends in poverty based on
thr
ee-year r
olling averages, by ethnic gr
oup (Chapter 2); (2)
pr
ovide income poverty measur
e and gr
ossing factor for FRS
analysis as above.
MCS Wave 1 (2001-03) and Wave 2 (ar
ound 2003-05)
Cohort of about 18,000 childr
en bor
n in 2000/01 fr
om acr
oss
UK. First two waves conducted when child was ar
ound nine
months and ar
ound thr
ee years old. Interview with main car
er
.
Additional information collected fr
om partner and also fr
om
siblings and fr
om dir
ect measur
es but not used her
e. Main
focus on child development and family r
elations, but also data
on income and work status.
(1) investigate and model poverty transitions and the factors associated with poverty exit and entry among families with young childr
en (Chapter 4); (2) estimate ethnic poverty
penalties for young childr
en (Chapter 3); (3) examine
dif
fer
ences by r
eligious affiliation (Chapter 9).
ONS LS Extracts of selected sample members fr
om
1991-2001 and 1981- 1991
A longitudinal data sour
ce that is r
epr
esentative of the
population of England and W
ales over time, deriving fr
om
a one per cent sample of the 1971 Census. The original Longitudinal Study sample included 1971 Census information for people bor
n on one of four selected dates in a calendar
year
. These four dates wer
e used to update the sample at the
1981, 1991 and 2001 Censuses and to add new members between Censuses. Information is added fr
om each decennial census on sample
members and on the members of those in the same household as the sample member at that date. Data include work status, housing tenur
e and basic demographic data including country
of birth. Small ar
ea level information was matched into
individual observations.
1
(1) describe ten-year transitions of childr
en between working
and workless households (Chapter 6); (2) model workless household exit and entry risks acr
oss ethnic gr
oups, and
variation in the r
ole of initial household work status (Chapter
6); (3) assess the contribution of ar
ea characteristics to
transitions (Chapter 7); (5) examine dif
fer
ences by r
eligious
affiliation (Chapter 9).
Table 1.1
Continued
Sour
ce
Key featur
es including geographical coverage
Used to
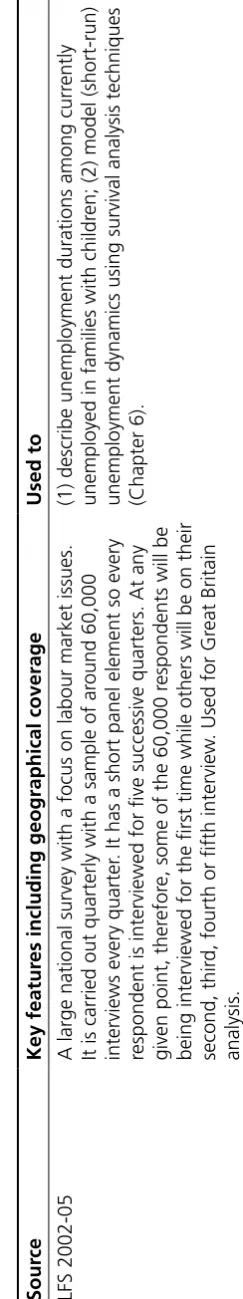
LFS 2002-05
A large national survey with a focus on labour market issues. It is carried out quarterly with a sample of ar
ound 60,000
interviews every quarter
. It has a short panel element so every
respondent is interviewed for five successive quarters. At any given point, ther
efor
e, some of the 60,000 r
espondents will be
being interviewed for the first time while others will be on their second, thir
d, fourth or fifth interview
. Used for Gr
eat Britain
analysis.
(1) describe unemployment durations among curr
ently
unemployed in families with childr
en; (2) model (short-run)
unemployment dynamics using survival analysis techniques (Chapter 6).
1
The r
esults used in this r
eport wer
e clear
ed for r
As Table 1.1 indicates, a wide range of analytical techniques were used across the chapters in this report. The feasibility study also considered the potential for particular analytical approaches. These included descriptive approaches; methods for understanding the contribution of differences in characteristics to poverty gaps; methods for exploiting longitudinal data; ways of investigating transitions from being poor to not being poor and vice versa, and ways of exploring other changes associated with such transitions. Such approaches are all employed in the research reported in the following chapters. The methods are indicated in the relevant sections of the report, but are not discussed in detail.6
The feasibility study also examined the ethnic group categories used across the data sources and the