University of Southern Queensland
Faculty of Engineering and Surveying
Comparing Different Heating Methods
for Determination of Moisture Content
in Soils
A dissertation submitted by
Mr Adam Cormick
In fulfilment of the requirements of
Bachelor of Engineering (Honours)
i
ABSTRACT
The use of microwave ovens to dry soil samples to conduct soil moisture tests offers the potential for the results to be available in under one hour compared to approximately 24 hours required to obtain the same results using the standard oven method that is the standard method used in industry.
This research project aimed to identify the correlations between the two methods for a specific range of materials and identify possible limitations for the use of the microwave method. Research was done at the beginning of the project to assess the past and current use of microwaves for moisture content determination and also to develop a methodology that will give an adequate comparison between the methods. It was also important to identify an appropriate test method that would give result in accurate results and ensure that all relevant standards were complied with.
The range of materials tested includes fine-grained silty soil, Bentonite, Kaolinite, Illlite and Peat moss (organic material).
The study involved testing 277 samples using both the microwave drying method and the standard oven method. Through this 554 moisture content results were obtained allowing an accurate comparison to be made between the two methods.
The results were very close in the 192 samples containing fine-grained silty soil, Bentonite, Kaolinite and Illite up to a moisture content of 30%. This included the materials alone as well as all ratios of fine-grained silty soil and clay mixes with all three types of clay. The difference between the methods was less than 1.5% in over 98% of these samples with over 90% of the samples having a difference of less than 1%.
ii University of Southern Queensland
Faculty of Health, Engineering and Sciences
ENG4111/ENG4112 Research Project
Limitations of Use
The Council of the University of Southern Queensland, its Faculty of Health, Engineering & Sciences, and the staff of the University of Southern Queensland, do not accept any responsibility for the truth, accuracy or completeness of material contained within or associated with this dissertation.
iii University of Southern Queensland
Faculty of Health, Engineering and Sciences
ENG4111/ENG4112 Research Project
Certification of Dissertation
I certify that the ideas, designs and experimental work, results, analyses and conclusions set out in this dissertation are entirely my own effort, except where otherwise indicated and acknowledged.
I further certify that the work is original and has not been previously submitted for assessment in any other course or institution, except where specifically stated.
A. Cormick
0050099564
Signature:
iv
ACKNOWLEDGEMENTS
I would like to acknowledge the technical assistance received throughout this project from my father Roy Cormick and Cary Pawson. Their technical knowledge and assistance with the laboratory testing was invaluable to the success of the project. I would also like thank my father and my brother Jacob Cormick for their assistance in conducting the laboratory testing. Their assistance allowed a much larger number of samples to be tested than what I could have achieved alone which benefited the project greatly.
I would also like to acknowledge the continued assistance and support received from my supervisor Dr. Kazem Ghabraie throughout this project.
v
TABLE OF CONTENTS
Contents
Page
ABSTRACT ... i
ACKNOWLEDGEMENTS ... iv
LIST OF FIGURES ... viii
LIST OF TABLES ... x
LIST OF APPENDICES ... xi
CHAPTER 1 - INTRODUCTION ... 1
1.1 Outline of the study ... 1
1.2 Introduction ... 1
1.3 The Problem ... 2
1.4 Research objectives ... 3
1.5 Conclusions ... 4
CHAPTER 2 –LITERATURE REVIEW ... 5
2.1 Sample size ... 5
2.2 Heating time ... 7
2.3 Specimen container type ... 10
2.4 Result comparison with standard oven method ... 11
2.5 Types of clay tested ... 14
2.6 Organic material ... 15
2.7 Microwave ‘noload’ protection ... 16
CHAPTER 3 - METHODOLOGY ... 17
3.1 Introduction ... 17
3.2 Materials to be tested ... 17
3.3 Limiting variability during testing ... 18
3.4 Samples to be tested ... 19
3.5 Test method to be used ... 21
vi
3.6.1 Microwave ovens ... 22
3.6.2 Standard laboratory oven ... 24
3.6.3 Sample containers ... 24
3.6.4 Balance ... 25
3.6.5 Basic laboratory equipment ... 25
3.6.6 Riffle box ... 26
3.7 Sample preparation ... 26
3.7.1 Preparing the fine-grained silty soil ... 26
3.7.2 Establishing the initial moisture content of all materials ... 31
3.7.3 Development of the mixing list for samples ... 33
3.7.4 Mixing samples ... 39
3.8 Testing procedure ... 43
3.9 Recording results ... 50
3.10 How results will be analysed ... 51
3.11 Testing material properties ... 53
CHAPTER 4 - RESULTS AND DISCUSSION ... 57
4.1 Introduction ... 57
4.2 Fine-grained silty soil ... 57
4.3 Bentonite ... 59
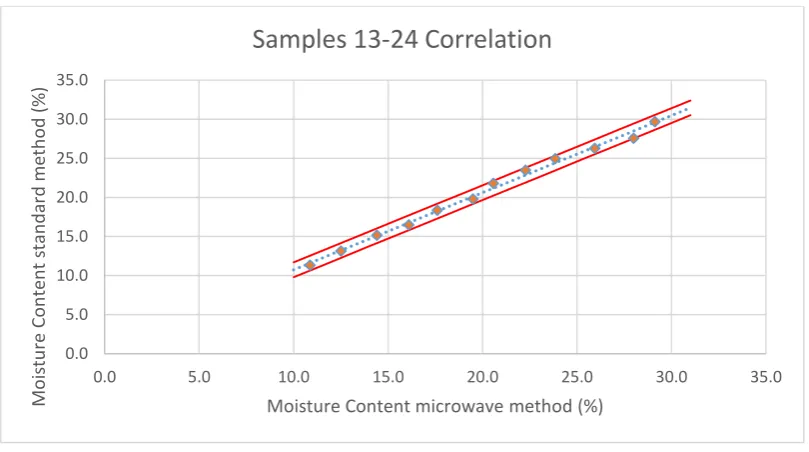
4.3.1 Samples 13-24: 20% Bentonite and 80% Fine-grained silty soil ... 59
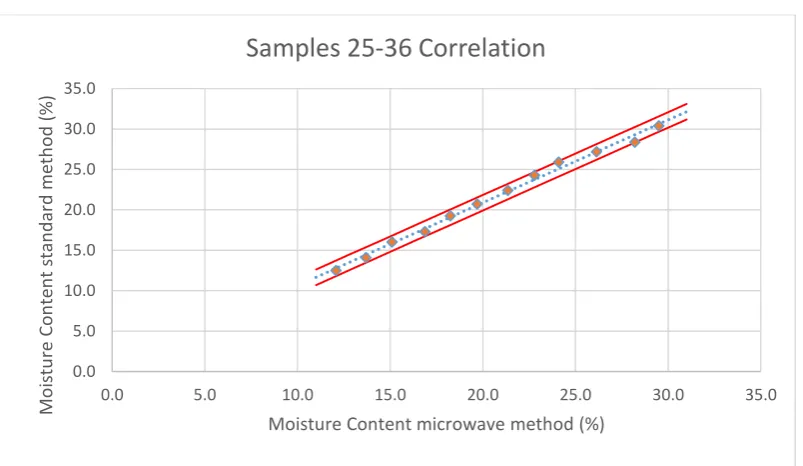
4.3.2 Samples 25-36: 40% Bentonite and 60% Fine-grained silty soil ... 60
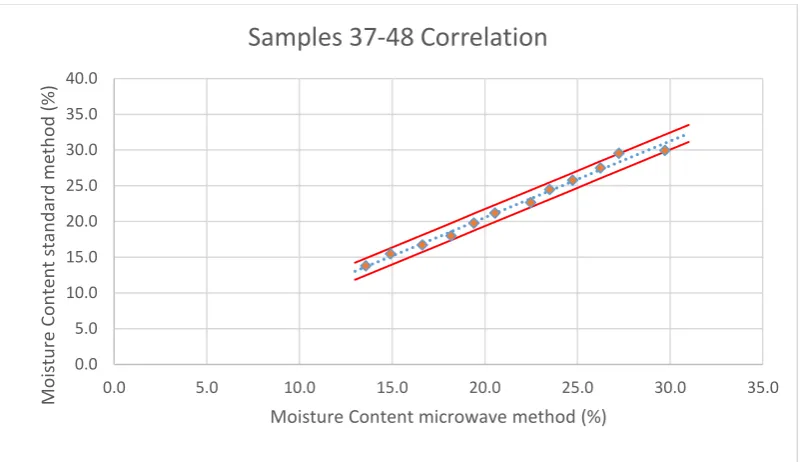
4.3.3 Samples 37-48: 60% Bentonite and 40% Fine-grained silty soil ... 61
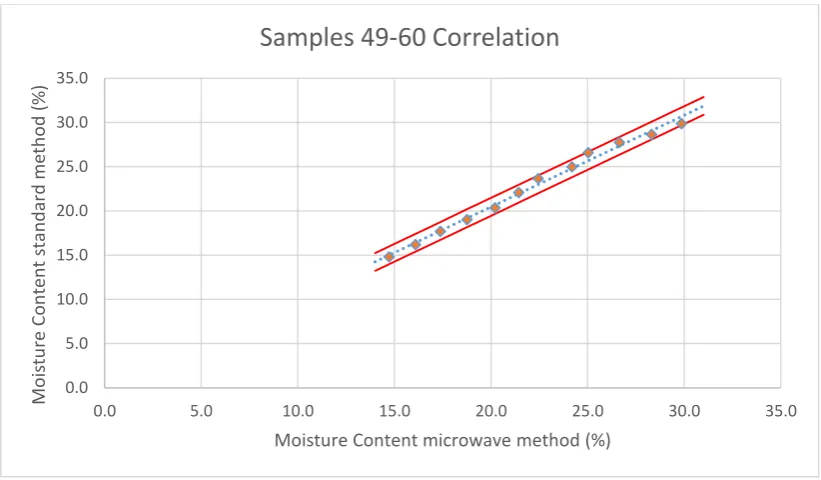
4.3.4 Samples 49-60: 80% Bentonite and 20% Fine-grained silty soil ... 62
4.3.5 Samples 61-72: 100% Bentonite up to 30% moisture content ... 64
4.3.6 100% Bentonite 35% to 110% moisture content ... 65
4.3.7 100% Bentonite 115% to 260% moisture content ... 66
4.4 Kaolinite ... 69
4.4.1 Samples 85-96: 20% Kaolinite and 80% Fine-grained silty soil ... 69
4.4.2 Samples 97-108: 40% Kaolinite and 60% Fine-grained silty soil .... 70
4.4.3 Samples 109-120: 60% Kaolinite and 40% Fine-grained silty soil .. 71
4.4.4 Samples 121-132: 80% Kaolinite and 20% Fine-grained silty soil .. 73
4.4.5 Samples 133-144: 100% Kaolinite up to 30% moisture content ... 74
4.4.6 100% Kaolinite 2% to 65% moisture content ... 76
vii
4.5.1 Samples 157-168: 20% Illite and 80% Fine-grained silty soil ... 77
4.5.2 Samples 169-180: 40% Illite and 60% Fine-grained silty soil ... 79
4.5.3 Samples 181-192: 60% Illite and 40% Fine-grained silty soil ... 80
4.5.4 Samples 193-204: 80% Illite and 20% Fine-grained silty soil ... 81
4.5.5 Samples 205-216: 100% Illite ... 82
4.6 Comparison of all clay and fine-grained silty soil samples up to 30% moisture content ... 84
4.7 Peat moss (organic material) ... 85
4.7.1 Samples 251-262: 5% Peat moss and 95% Fine-grained silty soil ... 85
4.7.2 Samples 263-274: 10% Peat moss and 90% Fine-grained silty soil . 86 CHAPTER 5 - CONCLUSIONS ... 89
5.1 Introduction ... 89
5.2 Fine-grained silty soil ... 89
5.3 Bentonite ... 89
5.3.1 Bentonite and fine-grained silty soil mixes ... 89
5.3.2 100% Bentonite ... 90
5.4 Kaolinite ... 91
5.4.1 Kaolinite and fine-grained silty soil mixes ... 91
5.4.2 100% Kaolinite... 91
5.5 Illite ... 92
5.6 Peat moss ... 92
5.7 General conclusions ... 93
5.8 Achievement of objectives ... 94
5.9 Further work ... 96
REFERENCES ... 97
viii
LIST OF FIGURES
Figure 3.1: Microwave ovens set up for testing ... 23
Figure 3.2: A refractory (fire) brick in the microwave oven for ‘no load’ protection24 Figure 3.3: Using a sieve to ensure fine grained soil material is under 2.36mm. ... 27
Figure 3.4: Three materials for fine-grained silty soil material prior to being combined ... 28
Figure 3.5: Materials being combined by weight for the fine-grained silty soil ... 29
Figure 3.6: The riffle box used to quarter the fine grained silty soil into sub-samples. ... 30
Figure 3.7: Material stored in plastic containers to keep moisture content stable ... 31
Figure 3.8: Samples used to determine initial moisture content of the materials. ... 32
Figure 3.9: Calibration of the balance using calibrated masses ... 39
Figure 3.10: Sample mixing list being used when mixing samples ... 40
Figure 3.11: Setting up the resealable sample bag on the balance for mixing ... 41
Figure 3.12: Adding the required materials to the sample mix ... 41
Figure 3.13: A mixed sample with air removed ready for curing ... 42
Figure 3.14: Samples arranged for curing ... 43
Figure 3.15: Mixing the sample thoroughly before dividing it into sub-samples ... 44
Figure 3.16: Sub-samples in their sample containers ready for testing ... 45
Figure 3.17: A sub-sample cooling before being weighed ... 46
Figure 3.18: Weighing a microwave dried sub-sample between heating cycles ... 47
Figure 3.19: A tray of sub-samples ready to be placed in the oven ... 48
Figure 3.20: Trays of sub-samples being dried in the laboratory oven ... 49
Figure 3.21: Testing the liquid limit of materials ... 54
Figure 3.22: Testing the plastic limit of materials ... 54
Figure 3.23: Testing the silt content of the fine-grained silty soil ... 55
Figure 4.1: Correlation of fine-grained silty soil results ... 58
Figure 4.2: Correlation of 20% Bentonite samples ... 59
Figure 4.3: Correlation of 40% Bentonite samples ... 60
Figure 4.4: Correlation of 60% Bentonite samples ... 62
Figure 4.5: Correlation of 80% Bentonite samples ... 63
Figure 4.6: Correlation of 100% Bentonite samples up to 30% moisture content ... 64
Figure 4.7: Correlation of 100% Bentonite samples from 30% to 110% moisture content ... 66
Figure 4.8: Difference between the results from both methods for Bentonite samples across entire moisture range tested ... 67
Figure 4.9: Correlation of 100% Bentonite samples from 115% to 260% moisture content ... 68
Figure 4.10: Correlation of 20% Kaolinite samples... 69
Figure 4.11: Correlation of 40% Kaolinite ... 71
Figure 4.12: Correlation of 60% Kaolinite ... 72
ix
Figure 4.14: Correlation of 100% Kaolinite up to 30% moisture content ... 75
Figure 4.15: Correlation of 100% Kaolinite from 2% to 65% moisture content ... 76
Figure 4.16: Correlation of 20% Illite samples ... 78
Figure 4.17: Correlation of 40% Illite samples ... 79
Figure 4.18: Correlation of 60% Illite samples ... 80
Figure 4.19: Correlation of 80% Illite samples ... 82
Figure 4.20: Correlation of 100% Illite samples ... 83
Figure 4.21: Correlation of all fine-grained silty soil and clay samples tested up to 30% moisture content ... 85
Figure 4.22: Correlation of 5% Peat moss samples ... 86
Figure 4.23: Correlation of 10% Peat moss samples ... 87
x
LIST OF TABLES
Table 3.1: Initial moisture content of materials ... 32
Table 3.2: Material properties tested ... 56
Table 3.3: Fine-grained silty soil composition ... 56
Table 4.1: Difference between results for fine-grained silty soil ... 58
Table 4.2: Difference between results for 20% Bentonite samples ... 60
Table 4.3: Difference between results for 40% Bentonite samples ... 61
Table 4.4: Difference between results for 60% Bentonite samples ... 62
Table 4.5: Difference between results for 80% Bentonite samples ... 63
Table 4.6: Difference between results for 100% Bentonite samples ... 65
Table 4.7: Difference between results for 100% Bentonite samples from 30% to 110% moisture content ... 66
Table 4.8: Difference between results for 100% Bentonite samples from 115% to 260% moisture content ... 68
Table 4.9: Difference between results for 20% Kaolinite samples ... 70
Table 4.10: Difference between results for 40% Kaolinite samples ... 71
Table 4.11: Difference between results for 60% Kaolinite samples ... 72
Table 4.12: Difference between results for 80% Kaolinite samples ... 74
Table 4.13: Difference between results for 100% Kaolinite samples up to 30% moisture content ... 75
Table 4.14: Difference between results for 100% Kaolinite samples from 2% to 65% moisture content ... 77
Table 4.15: Difference between results for 20% Illite samples ... 78
Table 4.16: Difference between results for 40% Illite samples ... 80
Table 4.17: Difference between results for 60% Illite samples ... 81
Table 4.18: Difference between results for 80% Illite samples ... 82
Table 4.19: Difference between results for 100% Illite samples ... 83
Table 4.20: Differences between results of all fine-grained silty soils and clay samples tested up to 30% moisture content ... 84
Table 4.21: Difference between results for 5% Peat moss samples ... 86
xi
LIST OF APPENDICES
Appendix A: Project specification ... 102
Appendix B: Sample composition spreadsheet ... 104
Appendix C: Sample mixing list ... 123
Appendix D: Balance check sheets ... 133
Appendix E: Data collection form ... 136
Appendix F: Material properties test results ... 138
Appendix G: Moisture content results spreadsheet ... 143
Appendix H: Correlation data ... 158
Appendix I: Data for adjusted moisture contents using correlation data ... 174
1
CHAPTER 1
INTRODUCTION
1.1 Outline of the study
The overall aim of this project is to compare the difference between moisture content results obtained from using a standard moisture oven and a microwave oven for the purpose of assessing the accuracy of the results obtained as well as difference of time taken to achieve a result. As the standard oven drying method is the accepted method used by industry that has a tried and proven history, the results obtained from the standard oven will be accepted as the true results for all samples.
1.2 Introduction
Drying samples to test for moisture content is a necessary and important part of several test methods. These include density tests, California Bearing Ratio (CBR) tests and quality tests such as Plasticity Index (PI) and grading. Another example of where moisture content testing is very important is the testing of aggregates and sand to be used in concrete batching. The moisture content of the materials needs to be tested prior to batching to enable the amount of water that is required to be added to the mix can be calculated accurately.
2 developed test methods for using microwave oven drying. However questions still remain about specific issues regarding the use of the microwave oven methods and this project will attempt to add to the testing data already compiled to assist in making the applicability of this method clearer to testing operators and the industry.
1.3 The Problem
One of the main issues involved when drying samples using a standard drying oven is that the time required for the drying of the material to a constant mass is approximately 24 hours. This can vary with sample types and sizes however 24 hours is readily accepted as a standard drying time. In many applications waiting 24 hours for the results of moisture tests can cause some issues. This is particularly the case when obtaining results of compaction (density) tests. The problem that can occur is that if construction needs to proceed, further compacted layers may be added over the layers being tested within in the 24 hour period whilst waiting for the samples to dry. If the layer is then found to have failed to reach the specified level of compaction the additional layers that have since been added will need to be removed in order to allow rework the failed layer. If results were available in a shorter timeframe by using an alternative method such as the microwave drying method any compaction / moisture issue would be able to be identified in a significantly shorter time frame thereby reducing the financial risk to the construction team. The time taken for the samples to dry using the microwave method will vary depending on sample type and size however the vast majority of tests should be able to be completed within approximately 20-40 minutes given the results of past studies.
3
1.4 Research objectives
The main objectives identifies from the project specification, attached as Appendix A, for this project along with the methods of achieving them are listed below:
Research the background information relating to the drying of, and moisture determination of soil samples.
Evaluate the current use of microwave ovens in this process.
Both of these objectives will be achieved by conducting a thorough literature review on the use of microwave ovens for the purposes of testing soil
moisture content. This will be the first stage of the project and the literature review is included within this preliminary report.
Identify an appropriate testing procedure to compare the correlation of results achieved using a microwave oven to that of the results from the use of an industry standard convection oven.
These objective will be achieved through both reviewing currently available standards and test methods for the microwave method, and also reviewing the test methods used in each of the studies reviewed as part of the literature review. As well as this the testing procedure will be developed in consultation with the laboratory staff at the soils laboratory where the testing will be conducted. The experience of the staff will be beneficial to ensuring the test procedure used will be appropriate for this study.
Study the effects of fine grained content (silt and clay), percentage of different types of clay minerals (Kaolinite, Illite and Montmorillonite) and organic content has on the correlation between the drying methods.
Identify the limitations of use of microwave oven drying techniques for soil samples.
4
Compare the effect sample size has on time taken to test soils samples using microwave ovens.
The sample size used can have a significant impact on the time taken to successfully dry the sample. Varying sized samples of the same material will be tested with the times compared to show the effect sample size has on drying times. It should be noted that there are also other issues that can occur if the sample size is too small. This will be taken into account when choosing sample sizes to be tested.
1.5 Conclusions
This project will also endeavour to identify the limitations of using the microwave method. It will not be possible to test all potential limitations, however we will examine the limitations of clay minerals Kaolinite, Illite and Montmorillonite, and also the impact of organic matter content within the soil.
5
CHAPTER 2
LITERATURE REVIEW
2.1
Sample size
During the review of previous studies it became obvious that there was a wide variety of sample sizes have been used in the microwave drying method. It is important to note that when using the microwave drying method the sample size used appears to have a significant impact on the time taken to successfully dry the samples so this will be an important factor when establishing the testing regime for this study. In the past studies sample sizes ranged from as small as 10 grams through to 1 kilogram.
The smallest samples used were that used by Routledge and Sabey (1976) where samples tested were 5 samples at 10 grams each and 20 samples at 50 grams each. These were similar sized to the samples used in the study conducted by Balscio (1992) which analysed the results of an earlier study to perform linear regression analysis. The sample size used in the earlier study was 15 grams. It is important to note however that the samples in the later study were all peat moss samples not soil samples. Another study that utilised relatively small sample sizes was Carter and Bentley (1986), although they initially used 1kg samples to determine the drying times for different soils, for the majority of the testing conducted in the study 20 – 30 gram samples were used.
6 The sample size range used by Daod (2012) fitted within these recommendations with a sample size of 150 – 200 grams for moisture content determination however smaller sample sizes of 50-60 gram samples were used specifically for determining the Liquid Limit.
Larger sample sizes were also used in a number of the studies. Berney et al. used sample sizes between 200 and 250 grams with Gaspard (2002) using even larger samples with a sample size of 500 grams. There was no detailed explanation on why the larger sample sizes were chosen. Kumar (1987) initially used a sample size of 1kg for 3 basaltic clays which took approximately 2-3 hours to dry. They later recommended that the sample size be reduced to approximately 300 grams for further studies due to the time required to dry the samples. The 300 gram samples took approximately 20 – 25 minutes to dry in a standard microwave oven which is a significant reduction from the previous 2-3 hours required.
Chung and Ho (2008) took another slightly different approach and used sample sizes in three ranges depending upon soil grain type. 100-200 gram samples were used to test fine grained samples. 300-500 gram samples were used for medium grained samples and 500-1000 gram samples were used to test the coarse grain samples. Suwandi et al. (2009) unfortunately did not specify the mass of the samples used which makes it hard to accurately compare the results of this study with other studies.
7
2.2
Heating time
The time required to successfully dry soil samples using the microwave method is affected by a number of aspects including soil type, sample size, microwave oven power and moisture content of soil to be tested. As the biggest impact on heating times from other studies appears to be related to sample sizes it is necessary to review the times taken to dry samples in those studies and associated sample sizes in order to assist choosing the correct sample size to use in this project.
The study conducted by Routledge and Sabey (1976) used drying intervals ranging from 5 minutes through to 35 minutes depending on sample size and material being tested. The 35 minute drying time was needed to dry 20 samples which were 50 grams each simultaneously. This was a test of the capacity to test multiple samples which is a much higher load than what would normally be used. Testing multiple samples at a time may have allowed them to avoid the effects of over drying by having a heavy load on the microwave.
Experimentation by Carter and Bentley (1986) determined an approximate drying time chart for different types of soil which could be very useful during the testing phase. During the testing of 1kg samples to establish the chart drying times were 1-2 minute intervals until mass stabilised with a weight taken between dying intervals. For smaller samples that were 15-16 grams the drying time required was 3-8 minutes depending on the material. This paper recommends a drying procedure that is quite different to the current ASTM test method, where the sample is dried continuously for the time required from the chart they developed, weighed, and then returned to the microwave for 1-2 mins. If the weight after the extra 1-2 mins matches within 0.01g for samples up to 300 grams or 0.05 grams for samples from 300-500 grams then the result is calculated from the current mass. Caution should be taken when considering this approach that it is widely considered that there is a risk of overheating clay samples in long continuous drying periods which may give a false result.
8 adopted for the ASTM method however this method does allow the use of an initial 3 minute heating period. The authors of this paper also recommend that when taking weights of the sample that 7 measurements are taken at 10 second intervals with the average taken as the sample weight. This is believed to also prevent overheating of the sample by allowing time for it to cool slightly. In the study it took between 8 and 28 minutes to dry the samples. Hagerty et al. (1990a) followed the testing guidelines of ASTM 4643 which requires samples to be heated at 1 minute intervals and then weighed. This process is repeated until successive weight measurements are within 0.01 times the previous weight measurement. The testing regime did vary on samples that took a significant period of time to dry where drying times between measurements were extended to 15mins after the first 10 one minute periods showed that significant mass change was still taking place.
After the development of ASTM 4643 this test method appears to have become the most widely used microwave drying test procedure and has been used in different parts of the world with some level of variation. Gaspard (2002) conducted testing as per ASTM 4643 except that based on previous experience they raised the initial drying period from 3 minutes to 6 minutes on the soil types tested. This is allowed under the ASTM method. Times taken to test 500 gram samples ranged from 11 minutes through to 32 minutes depending on the soil type with a mean duration of 23 minutes. The study by Chung and Ho (2008) used ASTM 4643 with 1 minute drying intervals although the initial drying period was reduced to 2 minutes.
The average drying times across the same type of materials tested at varied power setting showed that at a high setting of 700W the samples tested had an average drying time of 11.8 minutes. When this power setting was reduced to a medium power setting the average time increased to 20.8 minutes per sample and the tests conducted on low power setting took too long to be useful (greater than 1 hour and still not finished). It should be noted that less tests were conducted on medium setting than high setting. Further details of the drying times are available on page 33 (Chung and Ho, 2008).
9 The study by Kumar (1987) achieved a heating time of 20-25 minutes for a 300 gram sample however in the initial tests where 1 kg samples were used drying time was approximately 2-3 hours which starts to become excessive. For the larger 1kg samples the samples appear to have been weighed every 20 minutes of drying time. The 300 gram samples were weighed every minute. Daod (2012) used a drying time of 30 minutes but no further detail was given regarding intervals between mass measurements.
Diprose (2001) raises that an important point to consider is that different microwaves operate their lower power settings differently. Some have an inverter so that the samples would receive a fraction of the power continuously over the time the sample is in the microwave. Microwaves that don’t utilise an inverter simply give short bursts of full power with intervals of no power. This could have an effect on drying times.
The Australian standards are quite vague on the heating times required for testing samples using microwave drying. The only specific requirement in regards to drying time is that all subsequent heating times must be at least one quarter of the original drying time (Standards Australia 2005, p. 3).
10
2.3
Specimen container type
There are several options for the type of container which may be used for containing the soil sample during microwave drying. The only real exclusion to the type of container that may be considered for use is metallic containers as they are not suitable for use in a microwave oven.
In an early study conducted by Routledge and Sabey (1976) tared paper cups were used to hold specimens. Whilst this type of container appears to have been used successfully there are many better options available for use so this type of container will not be considered for use in this project.
For their study of microwave drying Carter and Bentley (1986) used glass Pyrex beakers, silica dishes and porcelain evaporating dishes to establish which types of containers were suitable. Whilst they determined that all types were able to be used the Pyrex beakers were found to potentially create condensation issues depending on the shape. The porcelain evaporating dishes were determined to be preferable as they had an open shape and they absorbed more microwaves than the other container types which made them warmer and seemed to prevent condensation issues. The study by Daod (2012) used Porcelain containers successfully also. In a later study Gilbert (1988) used Pyrex beakers successfully but also noted that tall beakers should be avoided due to potential condensation issues.
11
2.4
Result comparison with standard oven method
A major objective of this project is to attempt to find a consistent correlation between the microwave drying method and the standard oven method. If this is possible it would allow the moisture content results obtained from microwave oven drying to be slightly adjusted through the use of an equation to more accurately reflect the results that would have been achieved through the use of the standard oven drying method. For this purpose it was important to review past comparisons of the results achieved from microwave drying compared to the results from standard oven drying.
The study by Routledge and Sabey (1976) found that the shape of the drying curves produced were of the form y = AeBt, where t = time and y = moisture %. Using this type of curve R2 values were quite high with 0.996 for clay and 0.980 for loamy sand. At this stage I’m not sure if this information will be useful for this project but it may assist when determining correlation between the methods. The Australian Standard specifies linear regression analysis to be used however it may be possible that non-linear methods of correlation may provide the best correlation.
12 Carter and Bentley (1986) found that the results achieved from the 600 watt microwave mostly compared well to the results achieved from oven drying. They found slightly higher moisture contents were given at higher power settings. This could be an indication of a slight amount of over drying given the warning of over drying samples in numerous studies. They found that having the microwave set at full power the results averaged 0.4% higher moisture contents than the oven method, whereas a 70% power setting averaged moisture contents that were 0.1% less than the oven results. Samples tested at 50% power settings gave results that averaged 0.4% lower than the oven dried samples. This was from a relatively large study of over 250 samples which indicates with a certain amount of confidence that a 600 watt microwave used at around 70% power setting should obtain results very close to oven results. Further study could try to narrow down the power rating of the microwave that will achieve the most accurate results.
The results of the study by Gilbert (1988) showed a good correlation between results obtained from both methods with the variation of results in the vast majority of test samples being less than 1%. It should be noted that a computer controlled microwave oven system was used in the testing however similar results would be expected from using a standard microwave oven.
13 The study by Balscio (1992) found that the results between the methods were highly correlated with all R2 values except one greater than 0.98 on samples of peat moss when using linear regression analysis. This study recommends using a partially restricted linear regression model due to the ease of use and still relatively accurate results. In the partially restricted linear regression model the slope of the regression line is set to 1.0 and the intercept is computed from the data. It should be noted that this study was of testing peat moss not standard types of soil or clays.
Several other studies found relatively close results between the two methods. After statistical analysis of their test results Gaspard (2002) concluded that the standard microwave oven should provide good results for the type of soils tested in the study. The study also concluded that a standard microwave oven is a more feasible device to use rather than a computer controlled microwave oven. Chung and Ho (2008) concluded that the results of moisture contents from both methods agree quite well with the maximum difference from the 72 tests conducted being less than 1%. The study by Suwandi et al. (2009) found a minimum difference in the results of 0.28% between the methods and a maximum difference of 10%. It should be noted however that this was a relatively small study with only 36 sample in total between the three methods used. Also sample sizes tested are not specified, this could have an impact on the results.
14 correlation between the results from both test methods with an R2 value of 0.9731 and concluded that this study believes that the microwave oven method is more suitable for samples containing gypsum and calcium carbonate. This as an area for possible further study given that separate studies give opposing recommendations with material containing gypsum. It should be noted that the effects of gypsum will not be considered in my study. The study also noted that accuracy of the microwave drying method tended to increase with soil grain size (page 38).
The Australian standards require the microwave drying method to be correlated with the standard oven method by using linear regression analysis as set out in AS 1289.2.3.1-1998 (Standards Australia 1998).
2.5
Types of clay tested
Some of the different types of clay used in the previous studies were identified by Plasticity Index (PI) rather than mineral composition. When comparing the effects of varying percentages of Kaolinite, Illite and Montmorillonite have on the ability to utilise microwave drying it will be necessary to test the PI of samples to allow a better comparison with previous studies. Kumar (1987) tested three different basaltic clay specific to the area of highway being constructed in Victoria. They were described as Red (PI=40), Brown (PI=75) and Grey (PI=95). No further detail on the type of clay was given. The study by Daod (2012) was conducted in Kurdistan and clay types are given by colour only, no further information is given. Two types of clay were used in the study by Hagerty. et al. (1990a). They were Kaolin (PI=50) and Bentonite (PI=48). Although this study did list the clay used as Bentonite, a PI of 48 appears very low compared to other what would be expected for a Bentonite clay. These were tested separately and also in two different mixes of 4 parts kaolin 1 part bentonite and 8 parts kaolin 1 part bentonite.
15 conducted by Routledge and Sabey (1976) used two types of soil. The first type was made up of 84% sand, 7% silt and 9% clay. The second test material contained 29% sand, 26% silt and 45% clay. Gilbert (1991) tested a number of samples containing various local clays to the area tested in the USA and also tested Georgia Kaolin which was approximately 97% Kaolinite (PI=23). The Kaolin sample tested with a maximum difference of 0.3% between the methods.
Gaspard (2002) tested two type of clay samples. LA 15 clay (PI=50.2) and Big River clay (PI=62). The results from both methods compared well for both of these samples. Soils tested by Suwandi et al. (2009) were local soils to Malaysia and were described as containing clay with PI’s ranging from 30.2 to 36.5 for the 12 soils sampled.
Some of the clay minerals being tested in this project have shown good comparisons between the drying methods in previous studied, in particular kaolinite and montmorillonite. They will still be compared again in this project as this project will focus on utilising methods that satisfy current Australian Standards and related test methods. Previous studies used various testing methods which may have an effect on the comparison of the results.
2.6
Organic material
There was limited information found regarding the testing of soils containing organic matter in previous studies. This increases the importance of comparing the results between the methods with varying percentages of organic material in an attempt to find what limit of organic material within the soil samples will make the microwave drying method unsuitable for use.
16 Balscio (1992) uses results from the testing of samples of peat moss from mushroom farming beds successfully however it does not specify exactly what the peat moss consists of.
It is stated in Australian Standard AS 1289.2.1.4-2005 that the microwave drying method is not suitable for samples containing organic matter unless it is temperature controlled however it doesn’t state what level of organic material within the soil precludes the use of standard microwaves being used for drying samples (Standards Australia 2005, p. 1).
2.7
Microwave ‘no load’ protection
A number of the studies using microwave drying included some sort of material to absorb the microwave energy along with the test sample to ensure that when the sample had completely dried there was never a no load situation as this can result in severe damage to the microwave.
Carter and Bentley (1986) used pieces of asbestos as the ‘dummy sample’ however this is obviously no longer suitable due to the dangers posed by the asbestos material. They also claimed that a beaker of water was unsuitable due to the possibility of steam being produced and affecting the accuracy of the results obtained.
17
CHAPTER 3
METHODOLOGY
3.1
Introduction
This chapter will cover the methodology that was utilised to complete the testing of the samples required to compare the standard oven and microwave oven drying methods. This includes the materials that were tested, the equipment used, the method used to prepare the samples and the test methods used to conduct the testing in the laboratory.
3.2
Materials to be tested
Three types of clay are to be tested as specified in the project specifications. These clay types are Kaolinite, Montmorillonite and Illite.
Kaolinite: This was obtained via a product produced by Sobelco called Snobrite 55. This is 98% Kaolinite with the remaining 2% Quartz. This was the closest product to pure Kaolinite that I could obtain.
18 Illite: This was a much harder product to obtain. It was eventually obtained in a fine powdered form as it is used by the beauty and health industries in this form. I was only able to obtain 9kg of Illite at a cost of $270 so the sample sizes for this material were restricted in size
3.3
Limiting variability during testing
It was highlighted by laboratory staff early in the test preparation stage that to get the most accurate comparison of the drying methods possible it would be essential to reduce variability as much as possible during the testing process.
Dry weights used for sample ratios and sizes:
The first part of this process was to ensure that all samples were mixed according to the equivalent dry weights of the materials. This was important as all of the materials that were to be utilised had different moisture contents. This was achieved by placing all materials in sealed plastic containers so that their moisture contents will remain unchanged and taking an initial moisture content for each of the materials using the standard oven method. All samples will be mixed using equivalent dry weights to ensure ratios of materials are consistent throughout the samples to be tested. To make it easier to mix the samples a spreadsheet is used to calculate the amount of material required for each sample to give the dry weight equivalent required.
19 Cooling time prior to recording mass of sample:
In accordance with AS1289.2.1.4-2005 the sample is required to be allowed to cool after each heating cycle until the sample container is warm to touch. To ensure consistency throughout the testing process some trial and error was used in consultation with laboratory staff and it was decided that a cooling period of 1 minute following each heating cycle fulfilled this requirement. A one minute cooling period will be timed for each sample after each heating cycle to remove any variability in results due to different cooling times.
3.4
Samples to be tested
The materials need to be tested at a range of clay/silt mixes across a range of moisture contents. After speaking with the testing operators at the laboratory where testing will be completed the following test regime was proposed.
Each clay will be tested at 0%, 20%, 40%, 60%, 80% and 100% mixtures with a silt mix. This should allow a good snapshot of how the amount of each clay type and silt affects the use of microwave drying. If an issue is identified with the correlation becoming worse at a certain mix further tests can be conducted for the interval mixes if required e.g. 70%, 90% etc. These were simply skipped in the early stages as to conduct tests at every 10% mix would raise the number of tests required substantially.
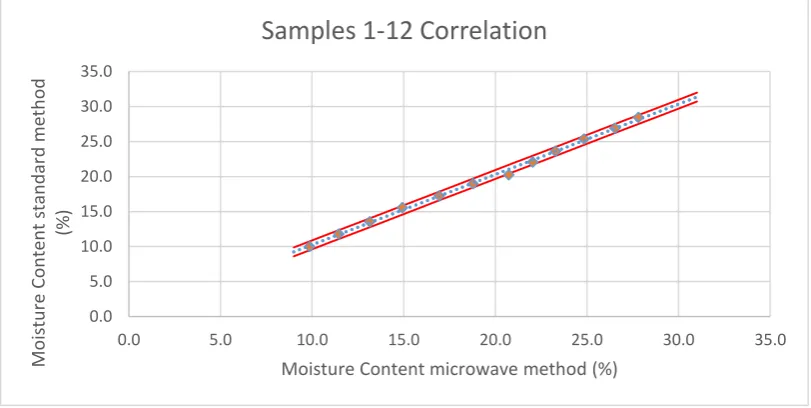
20 This will satisfy AS 1289.2.3.1-1998, which requires a minimum of 10 samples to be tested across the expected moisture range that is likely to be encountered with a particular material in order to achieve a correlation between the methods. This will allow each percentage mix of each type of clay to be correlated. By testing 12 samples it allows the possibility of an error occurring in up to 2 samples per mix to be tested and still having enough results to complete the correlation as per AS 1289.2.3.1-1998.
Following this proposed methodology 12 oven dried samples and 12 microwave dried samples will be completed for the fine grained silty soil with 60 samples tested by each method for each type of clay. This will result in 192 oven dried samples and 192microwave dried samples to compare, which is 384 samples tested in total. This is for the initial comparison of materials from their original moisture content up to 30% moisture content. This was chosen as the upper limit initially for the mixed samples as this was just above the liquid limit of the fine grained silty soil and would allow a comparison across the mixes to compare the affect that silt and clay content changes had on the suitability of the microwave drying method.
After the testing of the material properties it became evident that each of the clays would need to be tested at higher moisture contents, up to their liquid limit. These higher moisture contents were tested on samples that consisted of 100% clay for each of the three clay types. The samples were tested across the range of higher moisture contents up to their liquid limit however due to limited material Illite was tested at liquid limit only.
21
3.5
Test method to be used
Following the literature review it became apparent that the most comprehensive test method currently available is ATSM D4643-08 (ASTM 2008). This method assists to reduce the possibility of over drying the samples which is particularly important with clay samples. For these reasons this is the tests method that will be used in the testing of the samples. The only addition to this method is to include a 1 minute cooling period between the sample being removed from the microwave and the mass being taken. This method still complies with AS1289.2.1.4-2005, the Australian standard for determination of the moisture content of soil using a microwave oven (Standards Australia 2005, p. 2).
The test method used for the microwave drying is as follows:
1. Prepare a suitable sized representative sub-sample. 2. Determine mass of clean, dry container.
3. Place specimen in container, immediately determine and record mass. 4. Initially dry for 3 minutes. This can be adjusted shorter or longer based on
experience however as I have no experience with this type of testing on these materials at this stage the time will remain at 3 minutes.
5. Allow sample to cool for 1 minute using a timer to ensure consistent times. 6. Check mass and record.
7. Carefully mix soil with extreme care not to lose and soil from container. 8. Reheat for a further 1 minute.
9. Repeat steps 4 – 6 until change is less than 0.1% of the initial wet mass of the soil. i.e. 0.15 grams for a 150 gram sample. To take into account any limited performance of the balance during testing 150 gram samples will be
considered dry when the change is less than 0.1 grams.
22 The test method used for the standard oven method is as follows:
1. Prepare a suitable sized representative sub-sample.
2. Determine the mass of a clean and dry container.
3. Place specimen in container, immediately determine and record mass
4. Place the container with the sample in the oven and dry at 105°C to 110°C to constant mass.
5. After drying remove from oven and allow to cool until touch. 6. Determine the mass of the container and soil.
7. Return sample to the oven for at least one hour.
8. Repeat steps 5-6 until the difference between the current and previous mass is less than 0.1% of the initial mass of the wet soil.
3.6
Equipment required
For this project an array of equipment was needed to complete the laboratory testing to a high standard. The equipment used throughout the testing phase is listed below.
3.6.1 Microwave ovens
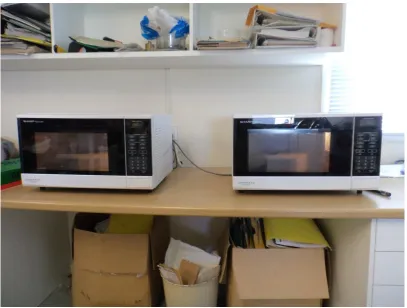
The microwave oven used for testing were Sharp R-350Y(W) 1200W models. Two microwave ovens of exactly the same model were used throughout the testing as shown in Figure 3.1. They were inverter microwave ovens and were able to be set to provide a continuous 720 Watts (60%) power. It was identified in the literature review that drying with a microwave oven of around 700 Watts power was sufficient power to dry the samples and had a lower chance of over drying the samples than using a high power setting. This is particularly important with clay materials.
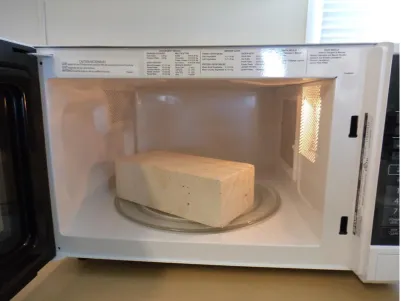
24 Figure 3.2: A refractory (fire) brick in the microwave oven for ‘no load’ protection
3.6.2 Standard laboratory oven
The comparison requires one of the subsamples of each sample to be tested using the standard oven method. To complete this testing the standard ovens used in the soils testing laboratory where testing was taking place. The ovens are checked and calibrated as required by the laboratory requirements. The ovens were used only at the standard temperature of 105 degrees Celsius +/- 5 degrees as required by the Australian Standards (Standards Australia 2005).
3.6.3 Sample containers
25 in each container so that the sample could be stirred during the testing process without risking losing any of the sample material. The glass rod was included as part of the container weight.
All sample containers were numbered individually so that samples were not mixed up in the drying process.
3.6.4 Balance
A balance was available for use at the soils testing laboratory where all testing was carried out. The balance must have a limit of performance not greater than +/- 0.5 grams for samples between 100 grams and 500 grams, and not greater than +/- 0.05 grams for samples less than 100 grams (Standards Australia 2005, p. 2).
This balance satisfies these requirements. To ensure that consistent accuracy is maintained the balance was checked by laboratory staff using their standard six month balance repeatability check prior to the commencement of this testing program and the balance was calibrated at the beginning of each day when used. As the balance was required for use within the laboratory during the testing period, each time it was required to be moved it was relevelled and calibrated. Also to aid accuracy the balance was positioned on a large tiled concrete block separated from the bench around it and whenever possible the air-conditioning was maintained at a constant temperature for 24 hours prior to testing, however sometimes this was not possible. In the event that the air-conditioning was not maintained for 24 hours before testing the calibration of the balance was checked every 2 hours to ensure accuracy.
3.6.5 Basic laboratory equipment
There were a number of basic laboratory items that were required for this testing program to be completed. As the testing was completed at a working laboratory these items were readily available.
These items included:
26
Plastic spatula’s
Scoops
Resealable plastic material containers
Resealable sample bags (these were purchased for this project)
Water spray bottles
Trays for oven samples
3.6.6 Riffle box
The riffle box is a standard laboratory method for ensuring that a large sample is divided into representative sub-samples (Standards Australia 2014, p. 9). This process is repeated until the required sample size is obtained. For this project the amount of fine grained silty soil that was required needed to be stored in 4 separate plastic material containers. To ensure that 1 sample was divided into 4 representative sub-samples the riffle box was used.
The use of the riffle box will be described in detail in the sample preparation section.
3.7
Sample preparation
To ensure that the results of this project were as useful as possible a significant effort was placed into the preparation phase. This will assist in ensuring that the comparison between the methods across the range of materials tested is as accurate as possible.
3.7.1 Preparing the fine grained silty soil
The base silty soil that all the clay samples will be mixed with was first sieved through a 2.36 mm sieve as shown in Figure 3.3 below. Only material which passes this sieve will be used.
27 ensure 100% silt was used given the volume of material required so in place of this original idea, fine grained silty soil was sieved in this manner only.
As 100% of the soil mix has passed through the 2.36 mm it meets the definition of a fine grained given in the Australian Standards which requires not less than 80% of the material to pass the 2.36 mm sieve (Standards Australia 2001, p. 3). This soil classification is needed for meeting the Australian Standard minimum sample size which will be covered in a later section.
A sieve analysis of this base material will be conducted to determine how much silt was contained within this material.
Figure 3.3: Using a sieve to ensure fine grained soil material is under 2.36mm.
28
Figure 3.4: Three materials for fine-grained silty soil material prior to being combined
These were initially mixed by adding 2.5 kg amounts of each of the three material type into a container and mixing by hand until the mix was homogeneous. The mixing of these materials by weight is shown in Figure 3.5 below. This volume of material was chosen as it could be easily mixed in a container without being too slow. Any amount of material could have been used provided that equal amounts of each material were added.
29
Figure 3.5: Materials being combined by weight for the fine-grained silty soil
30 Figure 3.6: The riffle box used to quarter the fine grained silty soil into sub-samples.
This process can be repeated as many times as necessary but in this case 4 sub-samples were required to ensure that all of the fine grained silty soil could be stored in sealed plastic material containers as shown in Figure 3.7 below. This was done so that an initial moisture content of the material could be tested to allow the material to be mixed in dry weight equivalent. This is needed to ensure that ratios of materials and sample sizes are consistent throughout the testing process.
31 Figure 3.7: Material stored in plastic containers to keep moisture content stable
3.7.2 Establishing the initial moisture content of all materials
As covered in the section on reducing variability in the testing process, I was given technical advice from the laboratory staff that to ensure a fair comparison throughout the range of samples and also to ensure that the ratios of materials were consistent it was necessary to mix all samples based on the equivalent dry mass of the material. Essentially this means to take into account any moisture already contained within the material as it is impractical to dry such a large amount of material prior to mixing the samples.
32
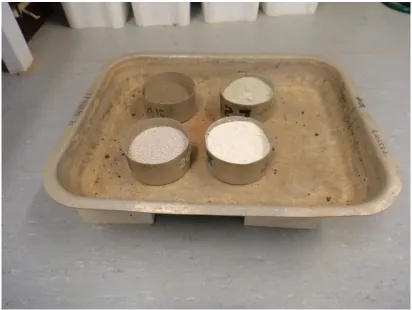
Figure 3.8: Samples used to determine initial moisture content of the materials.
The initial moisture contents of the materials to be used for testing are listed in Table 3.1 below. The calculations for the initial moisture content are included within the spreadsheet in Appendix B for each of the materials. These were also verified by hand calculations.
MATERIAL INITIAL MOISTURE CONTENT (%)
Fine-grained silty soil 10.1
Bentonite (1) 16.0
Bentonite (2) 16.5
Kaolinite 2.0
Illite 5.6
[image:44.595.112.525.93.403.2]Peat moss (organic content) 170.1
33 3.7.3 Development of the mixing list for samples
To reduce the chance of errors and to ensure that the samples would cover a sufficient range of moisture to offer and accurate comparison of the drying methods a sample mixing list was developed in the form of an excel spreadsheet. The sample mixing list that is produced by the spreadsheet contains the type of material to be used for each group of samples, the sample number of each sample to be mixed, the amount of clay and fine-grained silty soil required for each sample in terms of wet material and also any additional water required for the sample. The benefit of having the mix list already in terms of wet mass of each material required is that all adjustments have been made and the person mixing the samples simply needs to add the mass of each material listed on the sheet. The spreadsheet used to calculate the mixing list is attached as Appendix B and the mixing list produced by the spreadsheet is attached as Appendix C.
The first step in developing the spreadsheet was to use the initial moisture contents to calculate the required quantities of each material for each of the samples to be mixed including any additional water to be added.
The formula used to calculate the wet mass of material required to ensure the correct amount of dry material was:
𝑊𝑀 = 𝐷𝑀 + (𝐷𝑀 𝑥 𝐼𝑀𝐶 100)
Where: WM = Wet mass of the material (grams)
DM = Dry mass of material required (grams)
34 This formula takes into account the moisture already contained within each of the materials so that when mixed each sub-sample to be tested will contain 150 grams of dry material for the fine-grained silty soil, Bentonite and Kaolinite mixes. For the Illite mixes each sub-sample will contain 110 grams of dry material and for the organic mixes containing peat moss they will contain 80 grams of dry material.
Due to the number of calculations required it was much easier to implement this in the form a spreadsheet. The spreadsheet calculations were validated using hand calculations of random samples throughout the range of samples to be tested.
NOTE: The sample size can be easily adjusted for each material within the spreadsheet. The sample masses listed here are the final sample masses that were decided on for testing in consultation with laboratory staff. This was a beneficial feature of using a spreadsheet for the calculations as this made adjusting the sample sizes to see how much of each material would be required. This was particularly useful when adjusting the sample size for the Illite samples given the restricted amount of material available compared to the other materials. The amount of each material required is output by the spreadsheet.
MOISTURE RANGE TO BE TESTED
To enable a comparison and to meet the requirements of the Australian Standard for the correlation of the microwave method to the standard oven method it is necessary to test a minimum of 10 samples across the expected moisture range (Standards Australia 1998, p. 1). To ensure this criteria is met and that a comparison across the different mixes was possible it was decided to test each of the mixes at moisture contents ranging from the initial moisture content of the mix without any additional water being added through to a moisture content of 30%. The upper limit of 30% was decided upon as this was slightly above the liquid limit of the fine-grained silty soil. The spreadsheet is set up so that the upper moisture tested for each range of samples can be manually entered to enable different upper limits could be set easily.
35 This was completed with the Bentonite and Kaolinite, however due to the limited availability of Illite material it was tested at its liquid limit but no samples were tested between 30% and its liquid limit.
The lower moisture content is calculated automatically by the spreadsheet based on the initial moisture content of each of the materials in the sample. This is the moisture content of the combined materials without any additional water added. The formula used to calculate the lower moisture content tested is:
𝑀𝐶 = ( 𝐶
100 𝑥 𝐼𝑀𝐶𝑐𝑙𝑎𝑦) + ( 𝑆
100 𝑥 𝐼𝑀𝐶𝑠𝑖𝑙𝑡)
Where: MC = Moisture content (%)
C = Clay content of sample (%)
IMCclay = Initial moisture content of clay (%)
S = Fine-grained silty soil content of sample (%)
IMCsilt = Initial moisture content of fine-grained silty soil (%)
For materials containing organic matter the same basic formula is used as follows:
𝑀𝐶 = (𝑂𝑟𝑔
100 𝑥 𝐼𝑀𝐶𝑜𝑟𝑔𝑎𝑛𝑖𝑐) + ( 𝑆
100 𝑥 𝐼𝑀𝐶𝑠𝑖𝑙𝑡)
Where: Org = Organic matter content of sample (%)
IMCorganic = Initial moisture content of organic material (%)
36 After establishing the lower and upper moisture contents that will be tested the spreadsheet spreads the remaining 10 samples to be tested evenly across the range between these two limits. This ensures both compliance with the Australian Standards and also provides a range of moisture contents sufficient to make an adequate comparison between the methods.
The next step for the spreadsheet is to calculate the amount of additional water that needs to be added to each sample. It is known that the first sample of each set of samples requires no additional water to be added. The moisture content of each sample is then used to calculate the amount of water that is required to be added using the following formula:
𝑊 = (𝑀𝐶𝑠𝑎𝑚𝑝𝑙𝑒 − 𝑀𝐶𝑙𝑜𝑤𝑒𝑟
100 ) 𝑥 𝑆𝑎𝑚𝑝𝑙𝑒
Where: W = Additional water required (grams)
MCsample = Moisture content required for current sample (%)
MClower = Moisture content of the lowest moisture sample in the group
Sample = Sample size required based on dry weight of materials (grams)
It is important to note that the MClower is the lowest value of each group of samples, i.e. each different mix has a different lower moisture content.
The implementation of this formula in excel was validated by hand calculations of random samples.
37 Sub-sample mass = C/O + S + W
Where: C/O = Clay or Organic matter in terms of wet material (grams)
S = Fine-grained silty in terms of wet material (grams)
W = Additional water required to be added (grams)
This sub-sample mass calculated will be used when dividing the samples during testing. For the purposes of mixing the samples the masses of each of the materials to be added are simply doubled within the spreadsheet.
Sample mass = 2 x Sub-sample mass
38 SETTING UP THE BALANCE
The balance used to measure samples for both mixing samples as well as weighing samples during the drying process was calibrated regularly to ensure accuracy remained at a high level to reduce the chance of error. Prior to being calibrated the balance is positioned on a concrete block with a tiled top that has been set up in the laboratory specific for locating balances. Once the balance is in position it is levelled up to within the markings located in the level bubble on the balance.
The balance can then be calibrated using calibrated laboratory masses as shown below in Figure 3.9. This was done each time the balance was moved and also again at the beginning of each testing session. Whenever possible the air-conditioning in the laboratory was left running for 24 hours prior to testing to ensure a stable environment for the balance. Where this was not possible the balance was checked using the calibrated masses every 2 hours to ensure that balance drift was kept to a minimum.
Prior to the beginning of the test program the balance was checked against the laboratories 6 month balance repeatability check which was within the requirements. The monthly single point check sheet and six month repeatability check sheets for the balance have been attached as Appendix D.
39 Figure 3.9: Calibration of the balance using calibrated masses
3.7.4 Mixing samples
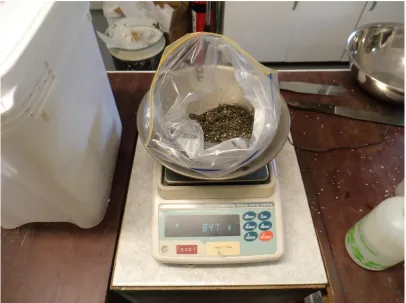
After development of the sample mixing list and setting up the balance the testing program was able to be moved into the stage of mixing the samples in preparation for testing.
40 Figure 3.10: Sample mixing list being used when mixing samples
From initial trials it was discovered that the best way of mixing the samples was to mix them directly inside the resealable bag that will be used to hold the samples while the cure. The main reason for mixing the samples this way as opposed to mixing them in a separate bowl was to reduce the amount of sample lost during the transfer between containers.
41 Figure 3.11: Setting up the resealable sample bag on the balance for mixing
[image:53.595.113.520.426.729.2]42 The majority of the air was removed from the sample bag and the bags were sealed as shown in Figure 3.13 below. These were numbered with the sample number corresponding to those listed in the spreadsheet to ensure that samples were not mixed up.
Figure 3.13: A mixed sample with air removed ready for curing
A curing time of at least 24 hours was used to ensure moisture content would be even within each sample however most samples cured for at least a few days prior to testing.
For the clay samples with higher moisture contents the samples were left to cure for at least 7 days. This was sufficient to allow the moisture to be evenly distributed throughout the sample material.
43 Figure 3.14: Samples arranged for curing
3.8
Testing procedure
44 placed into the steel tins for drying by the standard oven method. Each dry dish weight was recorded before the sample was placed in the dish and for the microwave samples a small piece of glass rod is included as part of the dish weight as this rod remains in the sample for stirring throughout the testing process. It is not removed to reduce the chance of sample loss as this has the potential to create errors.
The wet weights of the sample are taken immediately after the sample is divided to ensure they are recorded before any moisture loss to the air begins to occur.
Figure 3.15: Mixing the sample thoroughly before dividing it into sub-samples
Figure 3.16 below shows the sub-samples ready for testing with the sub-sample for the microwave method on the left and the standard oven method sub-sample on the right.
45 Figure 3.16: Sub-samples in their sample containers ready for testing
TESTING
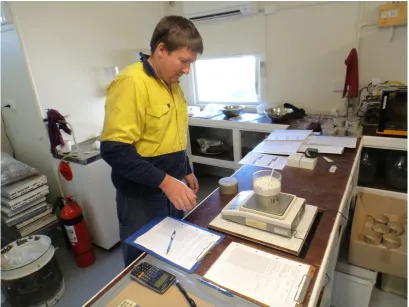
The sub-samples were both tested according to their respective test methods listed in Section 3.5. For all samples tested in this study the microwaves were set at 60% resulting in a constant heating energy of 720 watts. This is able to be adjusted as the testing operators gain experience with the particular materials being tested however for the purpose of maintaining consistency amongst the testing this setting remained constant.
The microwave dried sub-samples were all initially dried for a period of 3 minutes with all following drying periods being 1 minute each.
46 samples to cool for 1 minute and then weigh them. Timers were used to ensure that the 1 minute cooling periods were consistent. This part of the testing process can be seen in Figure 3.17 below.
An empty sample tin placed upside down on the balance as shown in Figure 3.18 was also used to ensure the balance remained unaffected by any heat from the samples.
After being weighed samples were then immediately stirred gently and returned to the microwaves for another drying cycle. This was repeated as necessary. To comply with the Australian Standard the samples are dried until the difference in weight between the current and previous weights is less than 0.1% of the initial sample mass, in this case 0.15 grams. I was advised by laboratory staff that in their opinion to ensure that this was achieved it was best to continue until the difference was less than 0.1 grams as this took into account any limited performance of the balance.
47 Figure 3.18: Weighing a microwave dried sub-sample between heating cycles
The oven samples had their tin numbers and tray names recorded to ensure that no samples were mixed up in the drying process. These trays were placed in the oven for approximately 24 hours. A tray of sub-samples ready to be placed in the oven is shown in Figure 3.19 below.
It can also be seen in Figure 3.19 that the trays were lined in aluminium foil. This was done to ensure that there was no possibility that any material left in the tray from previous testing could get stuck to the sample containers as even a slight change in weight due to foreign material on the container would impact on the accuracy of the test results.
Three trays of sub-samples being dried in the laboratory oven are shown in figure 3.20 below.
48 To ensure the samples were fully dried a random selection of samples were removed from the oven and weighed after the initial 24 hour drying period. These were then returned to the oven for a further 1 hour drying period. The weights were rechecked and if the difference in weights from the previous weighing were less than 0.1% of the initial wet material mass the samples were considered dry and all samples were weighed.
The ovens used were laboratory drying ovens set as per the Australian Standards.
Figure 3.19: A tray of sub-samples ready to be placed in the oven
50
3.9
Recording results
The results of the tests were initially recorded on a data collection form that was developed for this project. This form includes spaces to record all necessary information for both sub-samples on the same form. This enabled a hard copy of all results for each sample to be kept. An example of the data collection form is included in Appendix E. Another reason for recording a hard copy of results was because it was easier to keep track of multiple samples drying at a time using multiple sheets, if this was to be entered directly into an electronic spreadsheet in the laboratory I believe there is a higher potential for errors to occur.
The details recorded include:
Sample number
Microwave being used ( A or B)
Samples container numbers to ensure samples aren’t mixed up
Mass of empty sample containers for both sub-sample containers
Mass of sub-sample containers container wet material
Mass of the microwave sub-sample after every drying interval
Mass of both sub-samples when dried
All of the details are transferred to the results spreadsheet when completed. The test data page of the spreadsheet requires sample container masses, the masses of sample containers when filled with wet material and the masses of sample containers with material when dried for both sub-samples.
The spreadsheet is set up to calculate moisture content from both methods based on these details. It also displays the difference between the methods as a percentage of the standard oven method. This assumes that the standard oven method results as being true as the standard oven method is accepted by industry as providing true and accurate results.