Emerging Pattern Mining To Aid Toxicological Knowledge Discovery
Richard Sherhod,
†,∥Philip N. Judson,
‡Thierry Hanser,
§Jonathan D. Vessey,
§Samuel J. Webb,
§and Valerie J. Gillet
*
,††Information School, University of Sheffield, Regent Court, 211 Portobello Street, Sheffield S1 4DP, U.K.
‡Judson Consulting Service, Heather Lea, Bland Hill, Norwood, Harrogate HG3 1TE, U.K.
§Lhasa Limited, Granary Wharf House, 2 Canal Wharf, Holbeck, Leeds LS11 5PY, U.K.
*
S Supporting InformationABSTRACT: Knowledge-based systems for toxicity predic-tion are typically based on rules, known as structural alerts, that describe relationships between structural features and different toxic effects. The identification of structural features associated with toxicological activity can be a time-consuming
process and often requires significant input from domain
experts. Here, we describe an emerging pattern mining method for the automated identification of activating structural features
in toxicity data sets that is designed to help expedite the process of alert development. We apply the contrast pattern tree mining algorithm to generate a set of emerging patterns of structural fragment descriptors. Using the emerging patterns it is possible to
form hierarchical clusters of compounds that are defined by the presence of common structural features and represent distinct
chemical classes. The method has been tested on a large public in vitro mutagenicity data set and a public hERG channel
inhibition data set and is shown to be effective at identifying common toxic features and recognizable classes of toxicants. We also
describe how knowledge developers can use emerging patterns to improve the specificity and sensitivity of an existing expert
system.
■
INTRODUCTIONThe development of accurate methods for the prediction of toxic
hazard and environmental effects of chemical compounds is a
topic of great importance to all chemical industries1,2both from
the economic stand point of reducing the need for expensivein
vivoorin vitroexperiments and from the ethical stand point of reducing testing in animals. However, predicting toxic effects is a significant challenge for a number of reasons: multiple different toxic effects exist; the same toxic effect can arise through multiple
biological mechanisms; and for many toxic effects the
mechanisms of action are poorly understood. Furthermore, it
is difficult to obtain large high-quality data sets from which to
form reliable computational models.
Expert systems are a class of computational tools that have shown success in predicting toxic hazard by applying established
knowledge of toxicology. For example, the Derek Nexus,3
HazardExpert,4 and CASEUltra5 systems encode structural
features that have been associated with particular toxicological
effects, known as structural alerts, alongside other parameters
such as physicochemical properties. These systems apply
different rule-based or reasoning-based decision making
algorithms to the stored knowledge in order to make predictions of toxicity. For instance, Derek Nexus uses a reasoning model to construct and weigh up arguments for and against toxicity. A disadvantage of expert systems is that developing new structural alerts to expand the knowledge bases requires considerable time
and effort from domain experts and involves detailed analysis of
relevant literature.
Our aim in this work is to develop a data mining method to assist knowledge base developers in identifying substructural
features associated with toxic effects which can be used to
expedite the process of forming new structural alerts. Several methods have been reported in the literature aimed at identifying structural features or motifs that are associated with biological
activity. For example, Nicolaou et al.6 describe an automated
approach to identifying structural motifs associated with active compounds in high throughput screening (HTS) data. Their approach is iterative, with each iteration involving a clustering
step followed by the identification of a maximum common
substructure within a cluster which is then used to define a new
compound set for further clustering. Harper et al.7also describe a data driven clustering method aimed at identifying motifs that are common to active compounds in HTS data. The motifs are based on reduced graphs which are generated for all compounds and are then ranked based on the activity values of the compounds that exhibit them. Frequent subgraph mining techniques have also been applied to identify subgraphs that are associated with biological activity and toxicity.8These approaches are essentially based on enumerating all possible subgraphs within a data set and then identifying those which are more prevalent in one class of compounds compared to another. Graph mining methods are computationally expensive, and various algorithms have been
developed to improve the efficiency of the process. For example,
Received: March 21, 2014
Published: May 29, 2014
pubs.acs.org/jcim
Kazius et al. apply the Gaston subgraph mining algorithm to
identifying features associated with mutagenicity.9Lozano et al.
describe a similar approach that involves enumerating connected subgraphs directly from the toxic compounds and searching for each independently in the toxic and nontoxic compounds,
retaining those that occur only in the toxic compounds.10
Poezevara et al. have since extended this method to identify combinations of connected subgraphs that are associated with toxicity, which are then represented in a condensed form using
closed graphs.11More recently, Ferrari et al. have described a
substructure mining approach that is based on fragmenting molecules via their SMILES representations with the fragments selected according to their predictive ability on a training set.12 Jullian and Afshar have developed Knowledge Extraction and
Management (KEM) software13that is based on association rule
mining, also known asformal concept analysis14orGalois lattice
theory.15The compounds arefirst fragmented into substructures of various sizes, and each compound is encoded as binary properties indicating the presence or absence of the substructural fragments together with its activity, which is also encoded as a
binary property. KEM can be used tofind association rules that
relate substructural fragments to activity by limiting the extracted rules to those containing the presence of activity as the consequent. They describe an application of KEM to a data set of reproductive toxicants and innocuous compounds.
In our previous work, we applied jumping emerging pattern (JEP) mining to data sets consisting of toxic and nontoxic compounds to identify structural features associated with
toxicity.16 Emerging pattern (EP) mining is a data mining
techniquefirst developed within the engineering communities to
identify combinations of descriptors that are able to distinguish between classes of objects based on binary descriptors.17JEPs are sets of one or more combined descriptors that are present in one class and absent from the other; for instance, collections of molecular descriptors that are only found together in active
compounds. In thefirst application of emerging pattern mining
to chemical data sets, Auer and Bajorath18used emerging pattern
mining to develop predictive models of biological activity based on physicochemical and molecular properties. Continuous value descriptors were discretized into bits representing, for example, discrete ranges of molecular weight and log P values. JEP mining was then used to identify combinations of bits that are more prevalent in active compounds than in inactives and which represent sets of property ranges that are characteristic of the
actives. More recently, Bajorath’s group has applied JEP mining
to multitarget classification,19and Garcia-Borroto et al.́ 20have described a method for extracting emerging patterns from a decision tree which avoids the need to discretise continuous property descriptors and have demonstrated its application to classification modeling.
A limitation of JEPs is that they are inherently intolerant of noisy data. As a consequence, the presence of even a small
number of misclassified compounds can lead to the generation of
several detailed JEPs which are necessary to describe the active
compounds while at the same time excluding the misclassified
compounds. For example, aromatic nitro compounds are well-known to be associated with mutagenicity, and the presence of a single aromatic nitro compound in the set of nontoxic compounds causes the creation of many, overly detailed descriptions of active compounds in order to exclude the inactive one. Emerging patterns, on the other hand, are noise tolerant since they represent patterns that are more common to one class than the other; however, they can be less discriminating. Since
the aim of our work is the extraction of characteristic features of toxic compounds for expert analysis, rather than direct prediction of toxicity, greater noise tolerance and improved interpretability of results are more important than the predictivity of individual patterns.
In this paper, we describe the contrast pattern tree (CP-tree)
algorithm21 for mining EPs and apply it to mine structural
features in toxicity data sets. The emerging pattern mining enables toxic compounds to be organized into hierarchies in which the patterns of features become more detailed as a hierarchy is descended. This allows knowledge-base developers to browse through a set of compounds in a highly organized way and to choose an appropriate level of detail. We evaluate the performance of the EP mining on a large Ames mutagenicity data set and compare the results with those found using JEP mining. Finally, we apply the EP mining to a hERG channel inhibition data set to demonstrate its applicability to more complex toxicity end points.
■
METHODOLOGYThe concept of an emerging pattern is illustrated by a hypothetical data set in Table 1. The data set consists of data
entries in two classes,D1andD2, with each class consisting offive entries. Each data entry is represented by a set of up to four binary properties or items (a,b,c,d). If an item is present in a data entry, then its label is shown in the corresponding row, otherwise the label is absent. A set of properties of any length (cardinality) is called an itemset or pattern. Any pattern that is a proper subset (a subset of fewer items) or is equal to the itemset of one or more of the data entries and occurs more frequently in one of the two classes is said to be“emerging”in that class. In Table 1, the two items that are both italic and bold,aandc, represent an itemset that occurs more frequently in the entries in the classD1relative toD2so that the pattern {a,c} is emerging inD1. Thus, an EP can be considered to be a characteristic of the entries in one class that distinguishes them from those in the other class, regardless of the discriminatory ability of any individual item in the pattern.
The data entries that contain a pattern are referred to as its support set, i.e., they support the pattern. For example, the pattern {a,c} is found in the entries [1, 2, 3, 6] which form its support set. The proportion of data entries in one class that contains a pattern is referred to as its support; the support for pattern,pat, in classDis
= | |
Supp pat count pat D
( ) ( )
D
D
Table 1. Hypothetical Data Set Containing Pattern {a,c} That Is Emerging inD1
data entry properties
D1 1 a b c d
2 a b c
3 a c
4 a b d
5 b c d
D2 6 a c d
7 c d
8 b d
9 c
wherecountD(pat) is the number of entries in classDthat contain the pattern, and|D|is the total number of entries inD. An EP is a pattern which has higher support in one class compared to another. The EP {a,c} in Table 1 has a support of 0.6 inD1, since it is present in three of thefive data entries in that class, whereas it has support of only 0.2 inD2, since it occurs in only one offive data entries.
The ratio of support in two classes indicates how emerging a pattern is. This ratio is often referred to as growth rate; the growth rate,G, of pattern,pat, in classD1compared toD2is
= G pat Supp pat Supp pat ( ) ( ) ( ) D D 1 2
The growth rate of an EP must be between 1 and infinity, with an
infinite growth rate indicating a JEP, i.e., the support in one class is zero. The growth rate of EP {a,c} in Table 1 is 3 (support value of 0.6 inD1and 0.2 inD2).
The simplest method of identifying the EPs in one class compared to another is to enumerate all possible itemsets in the class of interest and then obtain their support sets by searching for instances of each itemset in the data entries of each class. However, the number of combinations of properties can be prohibitive, even for low dimensional data sets. The contrast
pattern tree (CP-tree) mining algorithm, developed by Fan,21
allows EPs to be identified within a reasonable time.
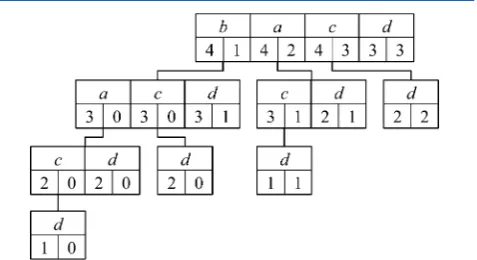
Contrast Pattern Tree Mining.A contrast pattern tree (CP-tree) is an ordered multiway tree representation of the itemsets in a data set. The CP-tree for the hypothetical data set in Table 1 is shown in Figure 1. Each node in the tree contains one or more
items which are ordered on descending support rate (and then lexicographically for equal support rates). Each item within a node can be connected by a branch to a node below it in the tree, i.e., as a child node of the item. Itemsets can be extracted from a CP-tree by tracing paths depth-first starting at the root node and considering one item at a time in order. Where a node contains
multiple items, paths are traced through the left-most itemfirst.
For example, the following itemsets are traced starting frombin
the root node: {b,a,c,d}; {b,a,d}; {b,c,d}; {b,d}. An item toward the right of a node is used to represent those itemsets that do not contain items to its left. For instance, itemsets traced
starting fromain the root node in Figure 1 do not containb,
while itemsets traced fromcdo not containbora. Each item
within a node is associated with two counts: the left count gives the support inD1for the itemset on the path traced from the root node to the item; and the right count gives the support of the
same itemset inD2. As well as the items within a node being
ordered on support rate, the items at different levels of the tree are also ordered on support rate.
Thefirst step in creating a CP-tree is to sort the items within each data entry on decreasing support rate. The data entries themselves are then sorted on their itemsets. For example, the items in the hypothetical data set are ordered in the sequenceb< a<c<d<null, whereb<aindicates thatbis beforea; the data entries are then ordered 1 < 2 < 4 < 5 < 8 < 6 < 3 < 10 < 7 < 9, as shown in Table 2. The data entries are then processed in turn.
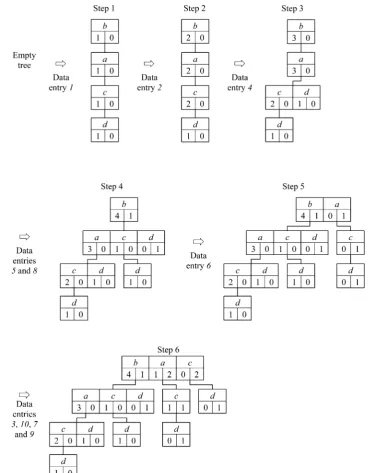
Figure 2 illustrates the process of generating the initial CP-tree from a single pass over the hypothetical data set in Table 2. Entry 1, as the highest priority data entry, is takenfirst, and the item with highest support is inserted into the root node of the tree with counts set as (1, 0), since the data entry is a member ofD1. The rest of the items form new nodes at progressively lower levels of the tree. After processing data entry 1 the tree is as shown at Step 1 of Figure 2 with each item having the values (1, 0). The next data entry is then processed. If its highest supported item already exists in the root node, then the appropriate counts are incremented; otherwise a new item is added to the root node. The itemset {b,a,c} of the second data entry already exists, and so the appropriate counts are incremented. Having inserted all data entries containing the most supported item {b} (Steps 1−4) data entry 6 is inserted. The highest supported item for data entry 6 is {a} which does not exist in the root node, and so a new item is inserted with counts set as (0, 1). A new node is created below the root and item {c} inserted with counts also set as (0, 1). This process continues until all data entries have been inserted into the CP-tree, resulting in the CP-tree shown at Step 6 of Figure 2. At this stage, the leftmost path through the tree in Step 6 has correct support counts. However, counts for itemsets which are subsets of larger itemsets that are present in the data are not correctly registered, and some itemsets are missing from the tree. Thus, itemset {b,a} has the correct support rate (3, 0); {b,a,c} has the correct support rate (2, 0); and {b,a,c,d} has the correct support rate (1, 0). However, itemset {b,a,d} traced through the second item of the left most node at level 3 has support rate (1, 0) even though there are two occurrences of {b,a,d} within the data entries. This arises because each data entry is registered in only one path in the tree, and this is the left most path. Thus, data entry 1 with itemset {b,a,c,d} is registered in the left most path only and not in any paths that occur to the right in the CP-tree where some of the items are missing, for example, paths {b,a,d}, {b,c,d}, and {b,d}.
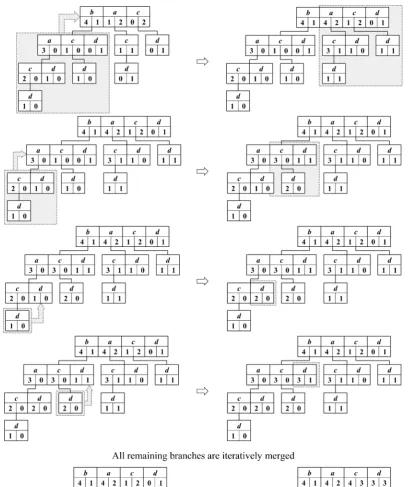
[image:3.625.63.302.404.534.2]Generation of the complete CP-tree together with correct support counts requires additional processing which involves
Figure 1.CP-tree of the data set in Table 1.
Table 2. Items in Each Data Entries Shown in Table 1 Are Ordered on Support Rate and the Data Entries Are Ordered by Itemset
data entry properties
1 b a c d
2 b a c
4 b a d
5 b c d
8 b d
6 a c d
3 a c
10 a
7 c d
recursively merging subtrees in a depth-first, left-to-right trace
through the initial tree. The depth-first trace begins with
left-most itemb in the root node. The child node ofb is shown
shaded in Figure 3 and is merged into the root node. If the child node contains items that are already present in the root (aandc, in this example), then the counts associated with the corresponding items are summed, and any children of these nodes are merged with children of the item in the parent, and so on. If the child contains an item that is not already present in the parent (d), a new item is created and counts set according to the child. This process effectively adjusts the counts for itemsets that are subsets of {b,a,c,d} but that do not containb. The depth-first trace then shifts to node {a,c,d} and merges its subtrees into the node. This process continues until the leaf nodes are reached at which point the trace back-tracks and processes the next item in the parent node, and so on. When all the items in the root node
have been processed, this will result in the complete CP-tree being generated, as shown in Figure 3.
Storing a complete CP-tree in memory in order to mine EPs is impractical for large high dimensional data sets. However, the construction of the complete CP-tree can be avoided by combining the procedure for merging subtrees with the procedure for extracting EPs. The CP-tree is created and traversed, and the branches already visited are pruned in one
continuous process. The algorithm follows a depthfirst trace and
[image:4.625.124.498.64.538.2]uses heuristics to terminate a branch if various continuation criteria are not met. The heuristics are used to prevent the generation of EPs that are unlikely to be of interest, for example, they are of too low support to be considered useful. As each item is processed, if it has a child node, the subtree is merged prior to adding the item into the current EP and processing then passes to the child node. Processing continues if all of the conditions given
below are met, otherwise the item together with its child nodes are pruned from the tree and the algorithm backtracks.
1. Descending to the next node does not exceed a threshold on path length (that is, number of items in the EP).
2. There has been a change in support for the pattern in either
D1orD2, or the number of steps for which there has been no
increase in growth rate is below a user-defined threshold.
3. Support inD1is greater than support inD2.
4. Support inD1is above a user-defined minimum supportδ1.
5. The following statement is true
δ
δ δ
≥ ×
ρ− ⎛
⎝
⎜⎜ ⎞⎠⎟⎟
G pat
Supp pat
( )
( )
D
1
2 2
1
[image:5.625.109.520.64.552.2]where δ2is a user-defined support threshold in D2that must satisfy 0≤δ2≤δ1, andρis a noise tolerance parameter greater than 1.
Alternatively, the algorithm may be configured to identify the
shortest valid EP in a path. The algorithm will stop traversing down a branch as soon as condition 5 is met, and the resulting pattern will be returned as an EP. The branch will then be pruned, and the algorithm will continue to the next branch.
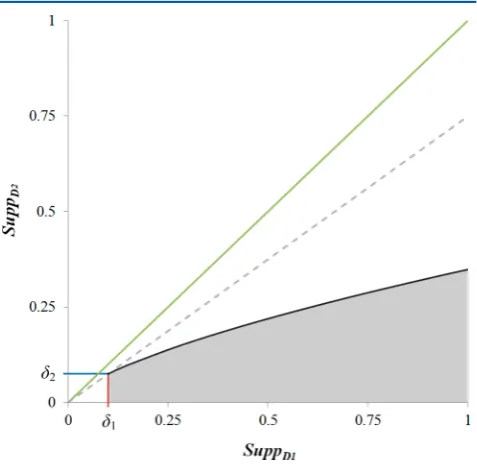
The growth function,G(pat), results in a curved frontier (solid black line) as shown in Figure 4 which plots support inD1against
support inD2and defines the growth rate threshold at different
support values. An EP with high support inD1must have a higher
growth rate than one with lower support. The shaded area indicates the space in which EPs may be found. The red and blue
lines represent the parameters δ1 and δ2, respectively, which
define the starting point and initial gradient (dashed line) of the curve. In this case,δ1is 0.1,δ2is 0.075, andρis 1.5. The green diagonal line shows where support for an itemset is equal in both classes.
Altering δ1and δ2allows the initial gradient of the curved
frontier to be increased or decreased to include or exclude weaker EPs, respectively. These parameters determine how strongly
discriminating an EP must be for it to be identified by the
algorithm; a shallow gradient will shift the frontier toward support inD1and significantly reduce the space in which EPs can
be found. The noise tolerance parameterρcan be used to alter
the growth rate as support inD1increases so that the growth rates of EPs with larger support inD1are greater than the growth rates
of EPs with smaller support inD1. Thus, highly supported but
weakly discriminating EPs are excluded. Such patterns may represent inconsequential features that are common within the data but are arbitrarily found in more entries inD1than inD2. Ifρ is equal to 1.0, then the frontier defined byG(pat) is linear and
follows the dashed line. Ifρis increased, then the curve becomes
more pronounced, and the deviation from the dashed line
becomes greater. Increasingρcan dramatically limit the space in
which EPs are found, such that only JEPs can be identified. This
may significantly increase the number of resulting patterns and
computation time while increasing pattern length and reducing their support.
Support Set Hierarchies.Once the EPs have been mined from the CP-tree, they can be organized into hierarchies, in a similar way to the JEPs described in our previous work. Many of the support sets for EPs exhibit subset-superset relationships, which permit the sorting of EPs, and their support sets, into hierarchical families with the most supported EP forming the root node of a tree. The remaining EPs are arranged below the root node in order of decreasing support. As a tree is descended,
the EPs become more specific and less supported. Figure 5
illustrates a hierarchy based on data entries in the hypothetical data set that contain items {a,c} where the tree is composed of
four EPs arranged as a tree offive nodes. Within the tree, each
node represents an EP, in braces, and its support set in square brackets.
The resulting hierarchies represent a form of supervised
clustering, i.e., the clustering is based on features that are characteristic of one class. Where EPs are associated with a toxic end point, the hierarchies of clusters are considered to be potential classes of toxicants that share a common mode of action, and individual clusters may represent potential subclasses. The clusters found using EPs overlap since a supporting data entry can be present in more than one node of a hierarchical tree and in more than one hierarchy. This is distinct from
conventional hierarchical clustering methods, which do not
typically result in overlapping clusters or multiple hierarchies.
■
EXPERIMENTAL SECTIONData Sets.The EP mining method has been applied to an
internally curated version of the Hansen et al.22 Ames
mutagenicity data set and to a hERG channel inhibition data
set available through PubChem.23
The Hansen data set is a publicly available benchmarkin vitro
mutagenicity data set which is a compilation of data from a number of sources. The data set was curated to ensure the validity of molecular structures using a combination of
ChemAxon24 software and KNIME25 nodes. Where possible,
structures were matched by their CAS registry number to structures present in Lhasa Limited’s Vitic database,26where the structures have previously undergone thorough validation and curation. Where matches in Vitic were found and there were differences in the structures, the structures in the benchmark data set were replaced with those from Vitic. Where a match could not be found, the structures were compared against their source data
set, as referenced by Hansen et al., where a common identifier
was available and the data was provided in a readily accessible
format. Where structures differed, those in the benchmark data
[image:6.625.62.301.183.421.2]set were replaced by those from the source material.
Figure 4.Support space of EPs.
[image:6.625.363.529.199.295.2]Structures with valency violations and charge violations were repaired, for example aromatic nitro compounds frequently contained pentavalent nitrogen atoms, which were standardized as positively charged tetravalent nitrogen. Molecules containing R or X pseudo atoms were removed, as they could not be resolved to complete structures. Multicomponent structures
containing significantly smaller components, such as H-X or
sodium ions, were processed to retain only the largest component. Where multiple large components were found, the entire entry was removed from the data set, as it was not clear which component is most significant or if the activity is a result of
both components combined. Finally, ChemAxon’s Standardizer
software, and a number of small purpose-built software tools were used to generate standardized representations of structures. Following this curation and validation, our version of the benchmark data set contained 6338 compounds: 2311 from the original benchmark data set, 1107 structures from the data set
published by Kazius et al.,9172 from the NISS data set, and 2748
from the Vitic database. 3432 of the compounds are classed as
mutagenic and represent the active class (D1), and 2906 are
classed as nonmutagenic and represent the inactive class (D2).In vitro mutagenicity predictions were obtained using Lhasa
Limited’s Derek Nexus 2012 program, in order to compare
mined EPs and their support sets to existing knowledge in the Derek Nexus knowledge base. The curated data set with Derek Nexus predictions is provided in the Supporting Information.
The hERG channel inhibition data set is available through
PubChem.23The data set contains 1960 compounds that have
been preclassified as active or inactive: 252 compounds are in the active class (D1) and 1708 are in the inactive class (D2). The data set is therefore strongly biased toward inactives, in the ratio 7:1. This data set is also available in the Supporting Information.
Descriptors.The CP-tree mining requires binary descriptors. In the case of the mutagenicity data set, the descriptors are
in-house structural fragmentfingerprints described below. These
were chosen since in vitro mutagenicity is known to be
predominantly caused by the presence of small reactive groups. hERG channel inhibition is known to be related to the presence of various structural features in different configurations, and so both structural fragments and pharmacophore pairs were used,
i.e., atom-pairs27 that describe pharmacophoric features
con-densed to pseudo atoms.
The structural fragments encode functional groups and ring systems. Functional groups are generated by breaking all single
and aromatic carbon−carbon bonds and retaining fragments
composed of two or more atoms. Ring systems are generated by breaking all bonds that are not part of a ring or connected to a ring. Fragments are then represented as unique, canonicalized
SMARTS28with no duplicates. For the functional groups only,
atoms are labeled with the number of neighboring atoms they had in their parent structure and their aromaticity. The fragmentation methods were applied separately to each molecule in the mutagenicity data set, resulting in a combined set of 3679 unique functional groups and ring systems. Each molecule in the
data set wasfingerprinted using the fragment descriptors, with
the presence of each fragment represented as a bit in a
fingerprint.
For the hERG data set, the fragmentation method was extended to generate all aliphatic acyclic chains, in addition to the functional groups and ring systems. The chains were generated
by breaking all bonds except acyclic and aliphatic carbon−carbon
bonds and retaining fragments composed of two or more atoms. This resulted in 2213 unique fragment descriptors.
Pharmaco-phore pairs were generated byfirst producing a reduced graph29
representation of each molecule by replacing the following with single pseudo atoms: aromatic rings, including fused ring systems; acyclic alkyl groups of more than two atoms, but excluding those in rings; hydrogen bond donors, acceptors and donor/acceptors. All pseudo atom-pairs between 1 and 7 bonds in length were generated from each reduced graph, resulting in 59 unique pharmacophore pairs. The fragment and
pharmaco-phore descriptors were used to produce two separatefingerprints
for each molecule in the data set.
■
RESULTSIn Vitro Mutagenicity. EPs and support hierarchies were mined from the mutagenicity data set using a minimum threshold on support in actives of 0.01, i.e., 1% the active class or at least 35 molecules. The parameter for support in inactives was also 0.01, resulting in an initial gradient of the curved growth
frontier of 1.0. The curve of the frontier was defined by a noise
tolerance parameter (ρ) of 1.3, which provided sufficient noise
tolerance without overly reducing the support space available for EP mining. To reduce run time and limit the potential generation of redundant EPs, the CP-tree mining algorithm applied the EP
mining heuristics, described previously, such that only thefirst
EP in any branch of the CP-tree was retained.
The results of EP mining are compared to those found by JEP mining in Table 3. The JEPs were mined using the method
described in our previous work for the same data set and fragment descriptors, and a minimum value for support in actives
of 0.01. The first two columns give the number of unique
patterns and hierarchies generated by each method. The columns
headed “coverage of actives” show the number and the
percentage of the active compounds represented by at least
one EP and JEP, respectively. The columns headed“coverage of
inactives” show the number and percentage of the inactive
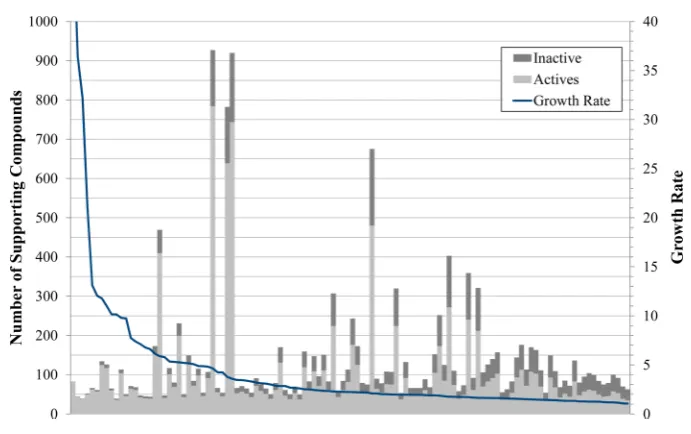
compounds, found within the support of at least one pattern. Far fewer EPs and EP hierarchies were produced than JEPs and JEP hierarchies so that manual inspection of the patterns resulting from EP mining is more practical. Furthermore, despite the smaller number of patterns, the EPs cover approximately 86% of the active class, while the JEPs cover only 39%; thus EP mining has identified potentially activating features of more actives with significantly fewer patterns. By definition, the JEPs cover 0% of the inactives, whereas the EPs cover 49% of the inactives. The coverage of inactives is relatively high; however, this represents the total coverage of inactives considering all EPs; the support rates can vary considerably for individual EPs with some being highly discriminatory. Figure 6 shows the number of supporting actives and inactives for each of the 116 EPs and their growth rate; the EPs are ordered by descending growth rate. The EP with
Table 3. Comparison of EP and JEP Mining for the Mutagenicity Data Seta
coverage of actives coverage of inactives
patterns hierarchies count % count %
EP 116 53 2959 86.23% 1411 48.55%
JEP 1191 478 1329 38.72% 0 0.00%
aThe columns headed “coverage of actives” give the number and
the highest growth rate is only supported by 83 active
compounds (support value of ∼0.02) and no supporting
inactives and is therefore a JEP with an infinite growth rate.
The EP with the second highest growth rate is supported by 43
actives (support value of∼0.01) and only one inactive (support
value of ∼0.0003), resulting in a very high growth rate of
approximately 36.4. Conversely, the most supported EP is
supported by 784 actives (support value of ∼0.23) and 143
inactives (support value of∼0.05) and has a relatively low growth rate of approximately 4.5. For knowledge discovery, the EPs can be sorted on the growth rate so that a knowledge base developer
examines those with the highest growth ratefirst. If the coverage
of inactives is considered too high, it could be reduced by altering the support and noise tolerance parameters and regenerating the EPs. Both the EP and JEP mining methods required a run time of approximately 1 min.
To put the coverage of these methods into context, Table 4
shows the number of structural alerts forin vitromutagenicity
from Lhasa Limited’s Derek Nexus that was found in the active
class. The columns headed “coverage of actives” show the
number of active molecules that exhibit at least one of the Derek Nexus alerts where it can be seen that Derek Nexus covered approximately 77% of the active compounds. The columns
headed “coverage of inactives” show the number of inactive
molecules that exhibit at least one of the Derek Nexus alerts; Derek Nexus covered approximately 23% of the inactive compounds. Table 5 shows the exclusive and shared coverage of the EP method and Derek Nexus. The columns headed
“exclusive coverage” show the number of active and inactive
molecules found exclusively in the support for at least one EP or exhibit at least one of the Derek Nexus alerts. The columns
headed“shared coverage”show the number of active and inactive
molecules found in both the support for at least one EP and exhibit at least one Derek Nexus alert, i.e. the intersect between
the EPs’and Derek Nexus’s support. Over 70% of the actives are
covered by both the EP method and Derek Nexus. However, approximately 16% of the actives are exclusively covered by EPs, thus representing the chemical space from which EP mining may yield new alert substructures from this data set. 239 actives and 1417 inactives are not found in the support for any EP or exhibit any of the Derek Nexus alerts; altering the EP mining parameters
or choosing different descriptors may permit EP mining that
covers this uncharacterized region of chemical space. The performance of the Derek Nexus system is the result of years of accumulated toxicological knowledge, obtained by manual curation and inspection of relevant literature and data sets. A comparison of the results of EP mining with the Derek Nexus predictions provides a means to rapidly generate new knowledge to improve the performance of the expert system, as described further below.
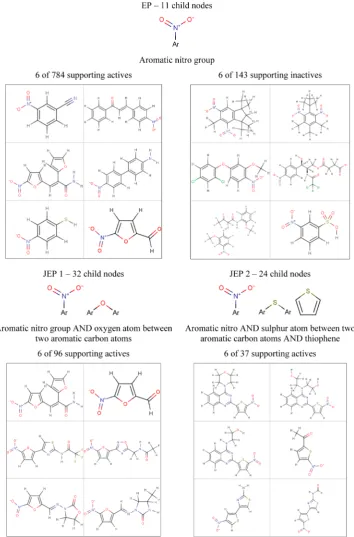
[image:8.625.139.485.61.278.2]Figure 7 shows the root nodes of three trees, one generated by EP mining and two by JEP mining, all of which represent structural variations of aromatic nitro compounds: examples of the molecules that support each pattern are shown together with the fragment(s) that comprise them. The EP is composed of a single fragment that describes a nitro group bonded to an aromatic carbon atom: a well-known activating substructure for
Figure 6.Number of supporting active and inactive compounds for each EP and their resulting growth rate.
Table 4. Number of Alerts Found in the Actives in the Mutagenicity Data Seta
coverage of actives
coverage of inactives
found alerts count % count %
Derek Nexus 73 2632 76.69% 659 22.68%
aThe columns headed “coverage of actives” give the number and
percentage of active compounds that exhibit at least one of the alerts. The columns headed “coverage of inactives” give the number and percentage of inactive compounds that exhibit at least one of the alerts.
Table 5. Comparison of the Coverage of EPs and Derek Nexusa
exclusive coverage shared coverage
actives inactives actives inactives
EP 561 830 2398 581
Derek Nexus 234 78
aThe columns headed“exclusive coverage”give the number of active
in vitromutagenicity. The EP is supported by all the aromatic nitro compounds in the data set (784), including 143
compounds classified as inactive. The EP hierarchy contains 11
child nodes below the root shown. JEPs, on the other hand, are
restricted to patterns that occuronlyin active compounds, and so
numerous JEPs are formed that describe variations in the structural features surrounding the nitro group in the active molecules that are not present in the inactives. JEP 1 is a combination of the aromatic nitro group fragment and a
[image:9.625.137.492.67.605.2]subfragment of a furan ring that includes two aromatic carbon atoms and an aromatic oxygen atom. JEP 1 is supported by only 96 of the actives, and the JEP 1 hierarchy contains 32 child nodes. JEP 2 is a combination of the aromatic nitro group fragment, a thiophene ring, and a subfragment of thiophene that includes an aromatic sulfur atom and two aromatic carbon atoms. JEP 2 is supported by 37 actives, and the JEP 2 hierarchy contains 24 child nodes. The structural features represented by JEP 1 and JEP 2 are also found among the 11 nodes below the root node in the
EP hierarchy; despite the smaller number of patterns and hierarchies, these two potentially activating structural features have still been identified.
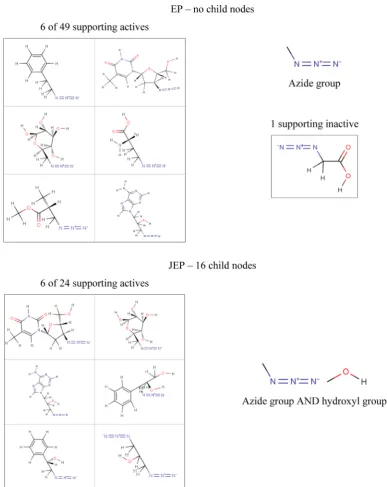
Figure 8 shows the root nodes of an EP and JEP tree that represent variations of azide compounds: examples of the molecules that support each pattern are shown together with the fragment(s) the pattern is composed of. The EP is composed of a single fragment that describes an azide group bonded to an aliphatic carbon atom: another well-known mutagenic sub-structure. The EP hierarchy includes only the EP shown, which is supported by all aliphatic azides in the data set including a single
compound classified as inactive. This single inactive azide is
responsible for there being no single JEP that can represent all azides in the data set. Thus, JEPs are formed that describe
variations in the structural features surrounding the azide group in the active molecules that are not present in the inactives. The
JEP shown in the figure is a combination of the azide group
fragment and a hydroxyl group. The JEP is supported by 24 actives, and the JEP hierarchy contains 16 further nodes.
For the mutagenicity data set, both EP and JEP mining have been successful in producing clusters of compounds that are
representative of known activating substructures for in vitro
mutagenicity. However, significantly fewer patterns and
[image:10.625.121.307.86.307.2]hierarchies are produced by the EP method, and the hierarchies typically contain fewer nodes. Browsing of the results of EP mining to identify potentially activating features is, therefore, far easier than is the case for JEP mining. Moreover, the patterns produced by EP mining are typically more representative of
known mutagenic substructures.30The presence of the activating substructures in the inactives results in longer JEPs that include additional, sometimes unrelated structural features. This
addi-tional detail is often difficult to interpret making it hard to
identify combinations of features that represent variations of the activating substructures that genuinely increase activity.
Alert Substructure Development.A number of the EPs
mined from the in vitro mutagenicity data set represent good
candidates for forming the basis of new alert substructures and for refining existing alerts. New alerts would result in an increase in the coverage of actives and thus an increase in the sensitivity of
an expert system, and refining of existing alerts to reduce the
coverage of inactives would improve the specificity of an expert
system. A subset of the EPs that represent potential gaps within the Derek Nexus knowledge base was selected for detailed analysis. These are EPs that are supported by a proportionally high number of compounds that Derek Nexus incorrectly predicted as negative (false negatives) and a proportionally low number of compounds correctly predicted to be negative (true
negatives). This subset was evaluated by one of Lhasa Limited’s
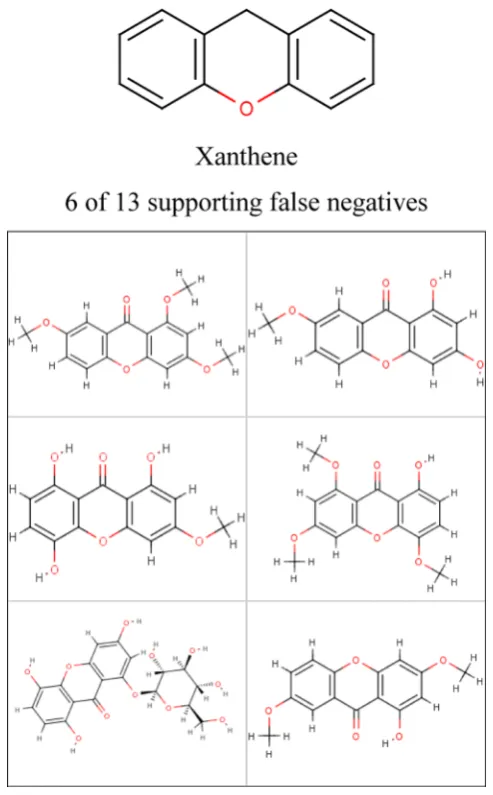
knowledge base developers by analyzing relevant literature and validated using in-house data sets. One such EP and the fragment it represents is shown in Figure 9 together with example molecules that support the pattern and a confusion matrix,
shown in Table 6, that compares the true activity classifications
with the Derek Nexus predictions for the compounds supported by the pattern. The EP is composed of a single fragment that describes a xanthene ring system and is supported by a range of
xanthene derivatives, which have been used to define two new
alerts for the Derek Nexus knowledge base.
hERG Channel Inhibition.EPs were mined from the hERG
channel inhibition data using both types of fingerprint and a
minimum threshold for support in actives of 0.02, i.e., 2% the active class or at least 5 molecules. The parameter for support in inactives was 0.001. The hERG data set is strongly biased toward inactives (252 actives and 1708 inactives). The support values were chosen to ensure that EPs occur in more actives than inactives as an absolute number. This resulted in a very limited
support space from which tofind EPs and necessitated a noise
tolerance parameter of 1.0 and a linear frontier; increasing the noise tolerance parameter above 1.0 would have limited the support space even further and may have precluded the
identification of any EPs. The minimum growth rate and
gradient of the emerging frontier was therefore 20.0. Unlike for mutagenicity, the EP mining heuristics were applied such that branches that produced an EP were not immediately pruned, so that a branch may produce multiple EPs. The numbers of unique EPs generated using each set of descriptors are shown in Table 7.
The columns headed“coverage of actives”show the number and
percentage of the active class found considering all EPs. A much
smaller number of EPs were produced than for in vitro
mutagenicity and the coverage of the active class was very low; however, the EPs have very high growth rates and are therefore very strongly emerging.
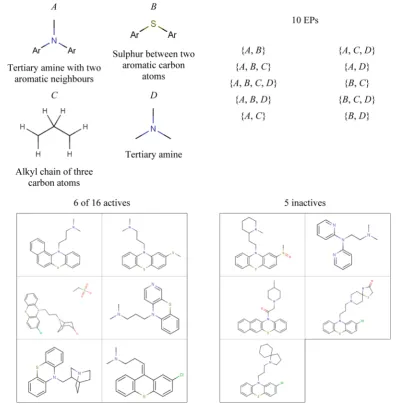
Detailed inspection of the 12 EPs generated using the fragment descriptors indicated that they may represent only three distinct classes of hERG channel inhibitors: one class is represented by 10 of the 12 EPs. Figure 10 shows the 10 EPs that have been combined to represent a single class: examples of the molecules in the class are shown together with the fragment(s) that the EPs are composed of and the observed combinations of those fragments. If interpreted as a single pattern, the combined EPs loosely describe a tertiary amine with aliphatic neighbors and
[image:11.625.321.568.65.463.2]two aromatic rings that are often joined by another tertiary amine: key components of known pharmacophores for hERG
Figure 9.Pattern and support for the root node of one hierarchy that describe xanthenes that resulted in poor Derek Nexus performance. The fragment that the pattern comprises is shown with examples of supporting active compounds that Derek Nexus incorrectly predicted to be inactive−see text for further details.
Table 6. Confusion Matrix of the Predictions Made by Derek Nexus for Xanthene Derivatives Supporting an EP
true activity
positive negative
predicted activity positive 10 6
negative 13 2
Table 7. Number of EPs Mined from the hERG Channel Inhibition Data Set Using Different Descriptorsa
coverage of actives coverage of inactives
descriptors EPs count % count %
fragments 12 26 10.32% 5 0.29%
pharmacophores 2 21 8.33% 7 0.41%
aThe columns headed “coverage of actives” give the number and
channel inhibition.31,32The pattern also gives an indication of the distance from the twin aromatic system to the aliphatic tertiary amine; there is often a chain of three aliphatic carbon atoms present, which inspection of the supporting compounds shows is frequently between the aromatic system and the tertiary amine. This distance is in accordance with known pharmacophores for hERG channel inhibition.
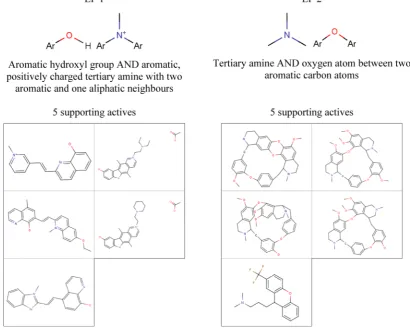
Figure 11 shows the two remaining EPs from the set of 12: examples of the molecules that support each pattern are shown together with the fragments that compose them. Both EPs are in fact JEPs, as they are only supported by the actives shown. EP 1 describes a hydroxyl group bonded to an aromatic carbon atom and a positively charged nitrogen atom that forms part of an aromatic system with one aliphatic neighbor. Inspection of the compounds supporting EP 1 shows that three do not include the aliphatic tertiary amine that is commonly associated with hERG channel inhibition but do have a common quinolinol group that
may be of significance. The remaining two supporting
compounds do contain an aliphatic tertiary amine and clearly conform to known pharmacophores. EP 2 describes an aliphatic tertiary amine and an oxygen atom between two aromatic carbon atoms. The EP is supported by four complex ring molecules and a
structurally simpler compound that clearly conforms to known pharmacophores for hERG channel inhibition.
[image:12.625.113.510.66.471.2]Figure 12 shows the two EPs mined from the hERG inhibition data using pharmacophore pairs: examples of the molecules that support each pattern are shown together with the pharmaco-phore pairs that compose them and a supporting example in both its reduced graph and molecular form. EP 1 is composed of four pharmacophore pairs describing the following: an aromatic system two bonds away from another aromatic system; an aromatic system two bonds from an aliphatic chain; an aromatic system two bonds from a hydrogen bond acceptor; and an aromatic system three bonds from a hydrogen bond acceptor. These sets of features correspond to a known pharmacophore comprising two aromatic groups, at least one chain of two atoms or greater, suggesting a distance of at least three bonds, and at least one hydrogen bond acceptor. EP 2 is composed of three pharmacophore pairs describing the following: an aromatic system neighboring a hydrogen bond acceptor; an aromatic system seven bonds from a hydrogen bond acceptor; and an aliphatic chain six bonds from a hydrogen bond acceptor. These features correspond to a pharmacophore comprising a single aromatic group and a more distant hydrogen bond acceptor; inspection of the compounds supporting EP 2 suggests the
distance between the hydrogen bond acceptor and the aromatic system is more varied but typically further than observed in the support for EP 1.
Mining EPs from hERG channel inhibition data using both types of descriptors has resulted in quite well-defined clusters of compounds. This has demonstrated the capability of the CP-tree mining method and the EP selection heuristics to tolerate highly biased data sets. However, the fragment descriptors are too
specific to describe the various structural features capable of
interacting with the hERG channel and are thus poorly suited to this toxicity end point. The pharmacophore pairs are more generalized; mining EPs using this type of descriptor has resulted in the formation of two descriptions of structural features that closely resemble known pharmacophores for hERG channel inhibition. A direct comparison between EPs and JEPs has not been attempted for the hERG inhibition data set and these descriptors. In the next section we demonstrate that the JEP
mining method can be considerably less efficient than mining
EPs. Given the diverse nature of the compounds and the size of the data set, we would expect the time required to complete the JEP mining process and number of resulting JEPs to be prohibitive.
Performance.To demonstrate the improved efficiency and thus reduced run time of the EP mining method compared to JEP mining, EPs and JEPs were mined from data sets for three
different toxicity end points using three different types of
descriptors. For EP and JEP mining, the minimum threshold value for support in actives was 0.05, i.e. 5% the active class. For EP mining, the parameter for support in inactives was also 0.05,
resulting in an initial gradient of the curved growth frontier of 1.0.
The curve of the frontier was defined by a noise tolerance
parameter of 1.5: quite a strict definition of EPs.
EPs and JEPs were mined from the in vitro mutagenicity,
hERG channel inhibition, and oestrogenicity data sets described in detail in our previous publication. In brief, the mutagenicity data set consists of 195 Ames active compounds (comprising
alkylating agents; α,β-unsaturated aldehydes; epoxides; and
aromatic nitro compounds) and 424 inactive compounds extracted from the Lhasa Limited Vitic 4 database. The hERG inhibition data set was also extracted from the same version of Vitic and consists of 148 compounds (114 active and 34 inactive classified using an IC50threshold of 20μM). The oestrogenicity data set was obtained from the Distributed Structure-Searchable
Toxicity (DSSTox) network, hosted by the US EPA,33and is
composed of 232 compounds with 131 classed as active (ER_RBA+) and 101 classed as inactive (ER_RBA-) based on
estrogen receptor binding affinity data, obtained through in vitro
assay experiments. The following descriptors were generated
using a KNIME workflow including an RDKit19fingerprinting
node: atom-pairs, again described in our previous work;
Morgan34circularfingerprints; and Morgan-featurefingerprints,
which encode pharmacophoric features as pseudo atoms. Two ranges of lengths were used for each type of descriptor. For atom-pairs, length represents the number of bonds between the
encoded atoms, while for Morgan circularfingerprints length is
the radius, in bonds, from a central atom. The length ranges for
atom-pairs were 1−4 bonds and 1−8 bonds. The length ranges
[image:13.625.105.516.74.404.2]for the Morganfingerprints were 1−2 bonds and 1−4 bonds:
equivalent to Extended-Connectivity Fingerprints35 (ECFP)
with diameters of 2−4 and 2−8. The run times observed when
mining EPs and JEPs from the three data sets using the different
descriptors and length ranges is shown in Table 8. The columns
headed“run time (min)”show the number of minutes required
to complete the EP and JEP mining process;“N/A”indicates that
the process did notfinish within 8640 min, i.e. six days. Both
forms of Morganfingerprints were hashed such that a consistent
fingerprint length of 1024 bits was obtained. The atom-pair
fingerprints are not hashed, with each bit corresponding to a
particular atom-pair; the column headed “descriptor count”
shows the number of atom-pair descriptors, and therefore length
of the atom-pairfingerprints, generated from each data set and
descriptor length range.
The run times observed when mining EPs are consistently below 1 min with the variation between the shortest and longest time only 30 s. Conversely, the JEP mining run times varied greatly from between approximately 6 s to 6 days. The longest run times were observed when mining JEPs using atom-pairs with a broader length range and thus more descriptors. In such cases the JEP method failed to complete the mining process in two of three experiments, while the EP mining method completed the process within 1 min. EP mining is therefore
scalable to a wider range of fingerprint types, lengths, and
densities, making it a more broadly applicable and reliable knowledge discovery technique.
■
CONCLUSIONSWe have developed an emerging pattern mining method that can assist knowledge base developers in compiling structural alerts to improve the performance of expert systems for toxicity
prediction. Emerging patterns have the significant advantage
over the jumping emerging patterns described in our earlier work of being tolerant to noise in the data. This is achieved through allowing some inactives to be covered by an emerging pattern
which can compensate for misclassified data. This characteristic
typically leads to a much smaller number of patterns being generated which makes the output more manageable for browsing by knowledge developers. Furthermore, the time required to generate emerging patterns for the data sets described here was consistently less than 1 min for a variety of descriptor types, whereas the corresponding times for jumping emerging pattern mining were much more variable, and, in some cases, the jumping emerging pattern mining was still running after 6 days. Our implementation of emerging pattern mining is based on the CP-tree algorithm which uses various heuristics to restrict the patterns to those that are most likely to be of interest.
The method is not intended to generate definitive toxicological
alerts wholly automatically but to provide a tool for experts to enable them to explore data in order to develop alerts. We have validated the approach on data sets in which features giving rise
to toxic effects are well understood and demonstrated its
tolerance of biased data sets for more complex end points. The method has also been applied to identify toxicophores and incorporate the resulting alerts into an existing expert system. The practical application of the emerging pattern mining to develop alerts will be described in greater detail in a forthcoming paper.
■
ASSOCIATED CONTENT*
S Supporting InformationOur curated version of the Hansen mutagenicity data set with Derek Nexus prediction and the hERG channel inhibition data set extracted from PubChem. This material is available free of charge via the Internet at http://pubs.acs.org.
■
AUTHOR INFORMATIONCorresponding Author
*E-mail: v.gillet@sheffield.ac.uk. Phone:+44-1142-222652. Fax:
+44-1142-780300.
Present Address
∥Vernalis R&D Ltd., Granta Park, Great Abington, Cambridge
CB21 6GB, UK.
Notes
The authors declare no competingfinancial interest.
■
REFERENCES(1) Cronin, M. T. D.; Madden, J. C.In Silico Toxicology: Principles and Applications; Royal Society of Chemistry: Cambridge, UK, 2010.
(2) Dearden, J. C.In SilicoPrediction of Drug Toxicity.J. Comput.-Aided Mol. Des.2003,17, 119−127.
(3) Marchant, C. A. Computational Toxicology: A Tool for All Industries.WIREs Comput. Mol. Sci.2012,2, 424−434.
(4) Smithing, M. P.; Darvas, F. Hazardexpert - an Expert System for Predicting Chemical Toxicity.ACS Symp. Ser.1992,484, 191−200.
(5) Saiakhov, R.; Chakravarti, S.; Klopman, G. Effectiveness of Case Ultra Expert System in Evaluating Adverse Effects of Drugs.Mol. Inf. 2013,32, 87−97.
[image:15.625.60.301.154.437.2](6) Nicolaou, C. A.; Tamura, S. Y.; Kelley, B. P.; Bassett, S. I.; Nutt, R. F. Analysis of Large Screening Data Sets Via Adaptively Grown
Table 8. Run Times Observed When Mining EPs and JEPs Using Different Descriptorsa
run time (min)
end point descriptor
length (bonds)
descriptor
count EPs JEPs
mutagenicity atom-pair 1−4 1058 0.5 81.5
atom-pair 1−8 1956 0.7 N/A
Morgan 1−2 0.3 0.1
Morgan 1−4 0.3 0.2
Feature-morgan
1−2 0.2 0.2
feature-Morgan
1−4 0.3 0.8
hERG inhibition
atom-pair 1−4 663 0.2 4.6
atom-pair 1−8 1426 0.5 N/A
Morgan 1−2 0.2 0.1
Morgan 1−4 0.3 0.2
feature-Morgan
1−2 0.2 0.1
feature-Morgan
1−4 0.2 0.5
oestrogenicity atom-pair 1−4 337 0.3 76.4
atom-pair 1−8 658 0.4 8595.0
Morgan 1−2 0.3 1.1
Morgan 1−4 0.4 0.2
feature-Morgan
1−2 0.3 0.1
feature-Morgan
1−4 0.3 5.0
aThe columns headed “run time (minutes)” show the number of
Phylogenetic-Like Trees.J. Chem. Inf. Comput. Sci. 2002,42, 1069− 1079.
(7) Harper, G.; Bravi, G. S.; Pickett, S. D.; Hussain, J.; Green, D. V. S. The Reduced Graph Descriptor in Virtual Screening and Data-Driven Clustering of High-Throughput Screening Data.J. Chem. Inf. Comput. Sci.2004,44, 2145−2156.
(8) Takigawa, I.; Mamitsuka, H. Graph Mining: Procedure, Application to Drug Discovery and Recent Advances.Drug Discovery Today2013,18, 50−57.
(9) Kazius, J.; Nijssen, S.; Kok, J.; Bäck, T.; Ijzerman, A. P. Substructure Mining Using Elaborate Chemical Representation.J. Chem. Inf. Model. 2006,46, 597−605.
(10) Lozano, S.; Poezevara, G.; Halm-Lemeille, M. P.; Lescot-Fontaine, E.; Lepailleur, A.; Bissell-Siders, R.; Cremilleux, B.; Rault, S.;́ Cuissart, B.; Bureau, R. Introduction of Jumping Fragments in Combination with QSARs for the Assessment of Classification in Ecotoxicology.J. Chem. Inf. Model.2010,50, 1330−1339.
(11) Poezevara, G.; Cuissart, B.; Crémilleux, B. Extracting and Summarizing the Frequent Emerging Graph Patterns from a Dataset of Graphs.J. Intell. Inf. Syst.2011,37, 333−353.
(12) Ferrari, T.; Cattaneo, D.; Gini, G.; Bakhtyari, N. G.; Manganaro, A.; Benfenati, E. Automatic Knowledge Extraction from Chemical Structures: The Case of Mutagenicity Prediction.SAR QSAR Environ. Res.2013,24, 631−649.
(13) Jullian, N.; Afshar, M. Novel Rule-Based Method for Multi-Parametric Multi-Objective Decision Support in Lead Optimization Using Kem.Curr. Comput.-Aided Drug Des.2008,4, 35−45.
(14) Wolff, K. E. InA First Course in Formal Concept Analysis - How to Understand Line Diagrams, The 7th Conference on the Scientific Use of Statistical Software, Heidelberg, Germany, 1993; Gustav Fischer Verlag: Heidelberg, Germany, 1993; pp 429−438.
(15) Carpineto, C.; Romano, G. In Galois: An Order-Theoretic Approach to Conceptual Clustering, Tenth International Conference on Machine Learning, Amherst, MA, USA, 1993; Morgan Kaufmann: Amherst, MA, USA, 1993; pp 33−40.
(16) Sherhod, R.; Gillet, V. J.; Judson, P. N.; Vessey, J. D. Automating Knowledge Discovery for Toxicity Prediction Using Jumping Emerging Pattern Mining.J. Chem. Inf. Model.2012,52, 3074−3087.
(17) Dong, G.; Li, J. Efficient Mining of Emerging Patterns: Discovering Trends and Differences. In The Fifth International Conference on Knowledge Discovery and Data Mining; Chaudhuri, S., Fayyad, U., Madigan, D., Eds.; Association for Computing Machinery Press: San Diego, CA, USA, 1999; pp 43−52.
(18) Auer, J.; Bajorath, J. Emerging Chemical Patterns: A New Methodology for Molecular Classification and Compound Selection.J. Chem. Inf. Model.2006,46, 2502−2514.
(19) Namasivayam, V.; Hu, Y.; Balfer, J.; Bajorath, J. Classification of Compounds with Distinct or Overlapping Multi-Target Activities and Diverse Molecular Mechanisms Using Emerging Chemical Patterns.J. Chem. Inf. Model.2013,53, 1272−1281.
(20) Garcia-Borroto, M.; Francisco Martinez-Trinidad, J.; Ariel Carrasco-Ochoa, J. A New Emerging Pattern Mining Algorithm and Its Application in Supervised Classification. InAdvances in Knowledge Discovery and Data Mining, Pt I, Proceedings; Zaki, M. J., Yu, J. X., Ravindran, B., Pudi, V., Eds.; 2010; Vol.6118, pp 150−157.
(21) Fan, H.; Ramamohanarao, K. Fast Discovery and the General-ization of Strong Jumping Emerging Patterns for Building Compact and Accurate Classifiers.IEEE Trans. Knowl. Data Eng.2006,18, 721−737. (22) Hansen, K.; Mika, S.; Schroeter, T.; Sutter, A.; ter Laak, A.; Steger-Hartmann, T.; Heinrich, N.; Mueller, K.-R. Benchmark Data Set for in Silico Prediction of Ames Mutagenicity.J. Chem. Inf. Model.2009,49, 2077−2081.
(23) PubChem. http://pubchem.ncbi.nlm.nih.gov/assay/assay.cgi?q= r&version=1.2&reqid=2831879572223393786 (accessed May 21, 2014).
(24)ChemAxon Kf tMáramaros köz 3/a, Budapest, 1037 Hungary. (25) Berthold, M. R.; Cebron, N.; Dill, F.; Gabriel, T. R.; Kotter, T.; Meinl, T.; Ohl, P.; Sieb, C.; Thiel, K.; Wiswedel, B. Knime: The
Konstanz Information Miner. Data Analysis, Machine Learning and Applications2008, 319−326.
(26) Lhasa Limited Vitic Nexus 2013, 23 Blenheim Terrace, Woodhouse Lane, Leeds LS2 9HD, UK.
(27) Carhart, R. E.; Smith, D. H.; Venkataraghavan, R. Atom Pairs as Molecular Features in Structure-Activity Studies: Definition and Applications.J. Chem. Inf. Comput. Sci.1985,25, 64−73.
(28)DaylightDaylight Chemical Information Systems, Inc., 120 Vantis - Suite 550, Aliso Viejo, CA 92656, USA. www.daylight.com at http:// www.daylight.com (accessed May 21, 2014).
(29) Gillet, V. J.; Willett, P.; Bradshaw, J. Similarity Searching Using Reduced Graphs.J. Chem. Inf. Comput. Sci.2003,43, 338−345.
(30) Benigni, R. The Benigni/Bossa Rulebase for Mutagenicity and Carcinogenicity−a Module of Toxtree; European Commission Report EUR, 23241: 2008.
(31) Aronov, A. M. Predictive in Silico Modeling for Herg Channel Blockers.Drug Discovery Today2005,10, 149−155.
(32) Mitcheson, J. S.; Chen, J.; Lin, M.; Culberson, C.; Sanguinetti, M. C. A Structural Basis for Drug-Induced Long Qt Syndrome.Proc. Natl. Acad. Sci. U. S. A.2000,97, 12329−12333.
(33) United States Environmental Protection Agency: Dsstox. http:// www.epa.gov/ncct/dsstox/index.html (accessed May 29, 2014).
(34) Morgan, H. L. The Generation of a Unique Machine Description for Chemical Structures-a Technique Developed at Chemical Abstracts Service.J. Chem. Doc.1965,5, 107−113.