City, University of London Institutional Repository
Citation
:
Turkay, C., Kaya, E., Balcisoy, S. and Hauser, H. (2017). Designing Progressive
and Interactive Analytics Processes for High-Dimensional Data Analysis. IEEE Transactions
on Visualization and Computer Graphics, 23(1), pp. 131-140. doi:
10.1109/TVCG.2016.2598470
This is the accepted version of the paper.
This version of the publication may differ from the final published
version.
Permanent repository link: http://openaccess.city.ac.uk/15205/
Link to published version
:
http://dx.doi.org/10.1109/TVCG.2016.2598470
Copyright and reuse:
City Research Online aims to make research
outputs of City, University of London available to a wider audience.
Copyright and Moral Rights remain with the author(s) and/or copyright
holders. URLs from City Research Online may be freely distributed and
linked to.
Designing Progressive and Interactive Analytics Processes for
High-Dimensional Data Analysis
Cagatay Turkay, Erdem Kaya, Selim Balcisoy, Helwig Hauser
a
b
c
[image:2.612.81.542.131.301.2]d
Fig. 1. Iteratively refining a credit card transaction segment (details in Section 4.1) using progressive computations that are real-ized through a prototype built according to our design recommendations for temporally optimreal-ized analytical processes. Transaction segments are generated either through clustering (a) or through selections on a plot showing principal component analysis (PCA) results (b). Both the clustering and PCA computations are done “online” and the visualizations continuously update (according to the
three levels of operation) either until the user changes the conditions to re-initiate the computations or until all the data is consumed. Subsegments are further refined through accompanying views (c, middle views), and the difference view (d) describing the segment.
Abstract—In interactive data analysis processes, the dialogue between the human and the computer is the enabling mechanism that can lead to actionable observations about the phenomena being investigated. It is of paramount importance that this dialogue is not interrupted by slow computational mechanisms that do not consider any known temporal human-computer interaction characteristics that prioritize the perceptual and cognitive capabilities of the users. In cases where the analysis involves an integrated computational method, for instance to reduce the dimensionality of the data or to perform clustering, such non-optimal processes are often likely. To remedy this, progressive computations, where results are iteratively improved, are getting increasing interest in visual analytics. In this paper, we present techniques and design considerations to incorporate progressive methods within interactive analysis processes that involve high-dimensional data. We define methodologies to facilitate processes that adhere to the perceptual characteristics of users and describe how online algorithms can be incorporated within these. A set of design recommendations and according methods to support analysts in accomplishing high-dimensional data analysis tasks are then presented. Our arguments and decisions here are informed by observations gathered over a series of analysis sessions with analysts from finance. We document observations and recommendations from this study and present evidence on how our approach contribute to the efficiency and productivity of interactive visual analysis sessions involving high-dimensional data.
Index Terms—Progressive analytics, high dimensional data, iterative refinement, visual analytics.
1 INTRODUCTION
Visual analytics (VA) can be considered as an interactive and iterative dialogue between the human and the computer where the interactive analysis process is a sequence of actions by the user and responses by the computer motivated by an analytical question [25, 18, 21]. In the case of visual analytics methodologies, the input from the user is often
• Cagatay Turkay is with City University London, UK. E-mail: [email protected]
• Erdem Kaya and Selim Balcisoy are with Sabanci University, Turkey. E-mail:{erdemkaya|balcisoy}@sabanciuniv.edu
• Helwig Hauser is with University of Bergen, Norway. E-mail: [email protected]
Manuscript received xx xxx. 201x; accepted xx xxx. 201x. Date of Publication xx xxx. 201x; date of current version xx xxx. 201x. For information on obtaining reprints of this article, please send e-mail to: [email protected]. Digital Object Identifier: xx.xxxx/TVCG.201x.xxxxxxx
an interactive modification either to trigger a change in the state of a visualization, or to change the conditions of how a particular compu-tation is carried out, e.g., changing the set of features that goes into a clustering algorithm. The response from the computer to such “input” is then through a re-computation (as needed) followed by an update in the visual representations to communicate the changes. In typical use of visual analytics, these steps take place several times with varying inputs from the user and according responses from the computer. It is this iterative discourse that serves as the fundamental mechanism through which analysts make observations and derive useful informa-tion to help them understand the phenomena being investigated [33].
study, it is possible to argue that the success of iterative analytical pro-cesses largely depends on whether the discourse happens within these boundaries, and whether the user is continuously engaged in this di-alogue to interpret the responses from the computer without interrup-tion. With data getting larger and more complex (i.e., more features, several sources), and the integration of “costly” computational meth-ods to derive information from them is becoming more commonplace, ensuring such temporal “qualities” of analytical processes is proving challenging. This is in particular a significant issue for methodolo-gies developed for high-dimensional data analysis where the incorpo-ration of computational methods is often desirable [43, 27]. More-over, the involvement of the user within high-dimensional data analy-sis is paramount since it significantly improves the reliability and inter-pretability of the results [43] — calling for the kinds of visual analytics methods we consider in this work.
In this paper, we focus on such high-dimensional data analysis sit-uations and present approaches, techniques, and recommendations to design effective interactive visual analysis processes. We do this by considering human time constants as the underlying theoretical frame-work to describethree levels of operationthat govern the pace of the interactive dialogues that take place in our approach. In essence, our solution, instead of forcing the user to wait for an interactive com-putation to finish, aims to present a best possible result within an ac-ceptable time frame. Depending on the interpretation of these first approximate results, the user has the chance to either wait for more accurate results or continue to explore the data by updating his/her in-teractive inputs. This approach is illustrated by Figure 2 where a visual analysis session that involves the interactive use of a computational method (principal component analysis [24] to reduce dimensionality of the data in this case) can be “optimized” using an approach that is capable of presenting anas-good-as-possibleresponse to the user in bounded-time. This thinking is inline with the suggestion by Card et al. [9] that reads“. . . When the cycle time becomes too high, co-operating rendering processes reduce the quality of rendering . . . ”. There are already a number of frameworks, techniques, and design studies that are motivated by similar objectives in visualization do-main [12, 26, 37, 34, 14]. Stolper et al. [37] use the term progres-sive analyticsand present a design study where progressive analytics has shown value in the domain of medicine. They provide a set of high-level design considerations that deem important in the context of progressive analytics. Considering this work and the other literature cited, specialized methods and design approaches to enhance high-dimensional analysis processes through temporally controlled progres-sive methods still remains a mostly unexplored area.
The successful realization of such processes involves a number of elements that need to work in coordination: i) a computational frame-work to incorporate progressive algorithms, ii) methods to facilitate the interaction with these algorithms, iii) visualizations designed to inform users on the progress and the uncertainty of the computational results, and above all, iv) an underlying temporal mechanism to co-ordinate how these building blocks operate. This paper enhances vi-sual analysis processes by focusing on these different perspectives and present a series of approaches, techniques and design recommenda-tions to develop such methods. More specifically, we present how human time constants [9] are instrumental in setting the pace of inter-action, how online algorithms [3] can be incorporated to support di-mension reduction and clustering with an adaptive sampling strategy, how interaction methods can be geared towards supporting progressive analysis, and how visualization techniques such as animation, multiple resolution techniques can be designed to better inform analysts.
While developing and improving our methodology and the design of our solutions, we are significantly informed by a series of analy-ses that we have carried out with a group of financial analysts with analytical needs that provide valid tasks for evaluating a progressive visual analysis framework such as ours. The analysts stated that they typicallyvalidate their models far long after they specified the rel-evant parametersdue to computational limitations, and as a result, they had tospend additional time to get accustomed to the environ-ment of the“ongoing” analysis. Such observations during the sessions
not only validated our motivation for developing progressive analy-sis methodologies but also provided continuous feedback to refine our designs and methodologies.
Our contributions in this work can be summarized as:
• Methods to facilitate analytical processes that adhere to the percep-tual characteristics of users through progressive computations.
• Design considerations for visualization and interaction techniques for progressive high-dimensional data analysis.
• A thorough evaluation of our methods through a case study, a use-case, and a numerical investigation on progressive computations.
• Observations from a two-month-long case study on the utilization of progressive methods in a real-life setting.
2 DESIGNING INTERACTIVE PROGRESSIVE ANALYSIS PRO
-CESSES
Here we present the fundamental building blocks to facilitate inter-active and progressive analytics processes within the context of high-dimensional data analysis. We discuss the design of such processes from four different perspectives to address four key questions: Q1: how to configure analytical processes such thatthe temporal capabil-itiesof analysts are respected?Q2:how to integrateunderlying com-putational mechanismsthat are capable of performing progressively? Q3:how to devise suitableinteraction methodsto facilitate processes that embrace progressiveness? Q4: how to inform analysts on the various aspects of progressive computations through appropriate visu-alizations? In the following, we consider these questions and present a set of techniques and methods to address these. Where appropriate, we externalize the justification for our methodological decisions in the form of design recommendations (DRs). These recommendations are informed both by the two-month-long case study we carried out and by our earlier work in high-dimensional data analysis [41, 43].
Wherever appropriate, we relate to the recent literature on theoret-ical and techntheoret-ical frameworks [12, 26, 37, 34, 14, 2, 15] and design studies on progressive analytics [37]. Schulz et al.’s [34] framework comes the closest to our work where the authors provide a theoreti-cal framework and a data/computation model to facilitate incremental visualizations. Their approach, although, not giving specifics on vi-sualization and/or interaction design, provides valuable pointers to the different aspects to consider such as selecting metrics and determining a quality/quantity trade-off.
2.1 Respecting the human time constraints
Based on their investigation of psychology literature, Card et al. [9] present three human time constants that characterize the temporal characteristics of related human capabilities. These constants are re-ported to be highly important to achieve an optimal communication be-tween the user and the computer. The first constant relates to the per-ceptual processinglevel at which humans are able to perceive changes in consecutive images as visually continuous animation. To achieve a visually smooth animation, the images need to be updated at least 10 times per second. The second constant addresses theimmediate responselevel at which the parts in a communication are exchanging, forming a dialogue. The communication is interrupted if there is no response from the other party within about one second. The third time constant is theunit taskconstant which determines the limits for an elementary task to be completed during such a dialogue. This constant is reported to be more flexible and defined in an interval between 10 to 30 seconds. With the guidance of the human time constants, we aim to improve the dialogue between the human and the computer during visual analysis sessions. We achieve this by adjusting the system to operate at three levels (at three time scales of interaction). Briefly, we consider aunit task in visual analytics as a sequence of actions and reactions where the reactions can be given by animated visualiza-tionsand the three levels of operation moderate how such a task can be carried out at an optimized fashion by respecting the human time constants. Our first design recommendation emphasizes this role of human time constants:
Compute PCA in several seconds
Update selection
Make a selection
Animate in 1 sec. Compute as-good-as-possible-PCA
in 1 second
PC1 PC2
PC’1 PC’2
[image:4.612.107.511.49.200.2]H
C
H
C
H
H C H C
Fig. 2. An example for optimizing an analytical process against the three human time constants [9]. In a conventional setup (left), the user first requests a (re-)computation of PCA results (with a selection of variables), then she waits a certain time. This waiting could potentially interrupt the dialogue between the user and the computer (let’s check my Inbox!). In order to address this, our suggested optimization (right) computes PCA resultsas good as possiblewithin one sec. in response to a selection by the user and the visualizations animate in one sec. to display the new results. The shown H–C–H–. . . - abstraction indicates the pattern of interaction (the lengths indicate the time spent and H: Human, C: Computer).
Level 3: Unit task completion –This level determines the temporal range in which an analytical unit task is completed. Such an analyti-cal task is performed to answer a specific question related to the data. Such a task involves a sequence of inputs from the user and corre-sponding responses from the computer. Our consideration of analyti-cal tasks here is more high-level and pragmatic than those suggested in the literature [4, 48] and can be likened to data analysis related ones [42], such as finding groups, investigating relations, etc., how-ever, we also allow for simpler tasks such as “changing a selection of items in one view (in order to explore inter-dimensional relations) and observing how the according focus+context visualization in a linked view changes”. We facilitate this level mainly through thekeyframed brushing(Sec. 2.3.2) where the tasks are bounded with fixed comple-tion times, i.e., 10 sec., 20 sec., or 30 seconds.
Level 2: Human-computer dialogue – This level is mainly respon-sible to maintain the dialogue nature of the visual analysis process. It ensures that the communication between the user and the computer is not interrupted. Specifically, this level focuses on maintaining a guar-anteed response time (1 sec.) when integrated computational tools are utilized. This mechanism realizes an uninterrupted dialogue by mak-ing sure that the immediate response capability of the user is exploited. Maintaining the one-second response time is not straightforward when the computations are complex and the data is large. Our solution to approach this problem is to compromise the quality of the results by computing the best possible result within the limited time frame. In order to achieve this, we make use of online algorithms together with an adaptive sampling strategy (more in Section 2.2).
Level 1: Visualization update –Animated transitions have proven to be helpful when the displacements of data elements are of impor-tance [22] and they can help avoidchange blindness[30]. Therefore, we make use of animated transitions between the different computa-tional results that are generated as a result of the dialogue occurring at the second level of operation. The visualization update level moderates the update rate of animated visualizations and secures the perceptual processing of the animations in the visualization. In order to create animations that are smooth in the eye, the lower bound for the update rate should be 10 Hz [9].
2.2 Incorporating Progressive Algorithms
Here we describe how computational methods can be integrated within interactive analysis systems and provide the details of how we seam-lessly integrate different algorithms. We also present an adaptive batch sampling strategy.
2.2.1 Online Algorithms
In order to maintain the temporal limitations set forth by the human time constants, we develop a mechanism where the computational tool
guarantees to respond within a fixed period of time (i.e. one second). To achieve this, we make use ofonline algorithms, algorithms that are capable of processing the data piece-by-piece, sequentially [3]. These algorithms do not need the whole data to operate and can update the re-sults as new data becomes available. In the machine learning literature, there are online versions of computational tools that are frequently used in visual analytics, such as principal component analysis [32] or clustering [35]. One common method to use online algorithms is to pass the data in small batches to have a lower memory footprint [3]. To be able to utilize this incremental computing nature of online algo-rithms, we use them in combination with a random sampling method that adaptively adjust the batch size to ensure efficiency in the iterative computations (see Algorithm 1).
This approach assures that the computations are finished and the as-sociated visualizations are updated within the temporal limits. How-ever, due to the fact that the results are computed on a limited sam-ple, the results are usually not as accurate as one would achieve if the whole dataset was used. Therefore the algorithm continues to run (in a separate background thread) after the first response is given and con-sumes more and more of the data every second. This implies that the results are getting more and more accurate as the user observes the re-sult without being disengaged from the communication. In the context of this work, we incorporated the online versions of two popular com-putational tools, PCA and clustering (a version with similar principles as the k-means algorithm). In Algorithm 1, these tools correspond to the moduleO. It is also important to mention that these algorithms should be able to run on user-selected subsets of both the items and the dimensions of the data. We make the following recommendation that relates to the underlying technical framework.
DR2:Employ online learning algorithms that are capable of handling data in sub-batches to perform computational tasks.
Online PCA:Online PCA algorithms make use of an incremental
updating of the singular value decomposition (SVD) of the data ma-trix [32]1. In this paper, we refer to online PCA and incremental PCA interchangeably. Here, we use the incremental methodology described by Ross et al. [32]. At each iteration, the SVD is updated with the in-coming data and the principal component loadings are updated accord-ingly. However,despite the PCs modeled on only the seen data, i.e., partially fitted, the final projections are applied to the whole dataset. The results are then visualized through scatterplots where the axes are the first two principal components (e.g., see Figure 2).
Online Clustering: Similarly for clustering, we use an online clus-tering algorithm that can operate on sub-batches of data incrementally defined by Sculley [35]2. This algorithm takes a parameterkas an
1Incremental PCA is utilized from http://scikit-learn.org/.
Algorithm 1Online computation with random batch sampling
1: procedureCOMPUTEINFIXEDTIME 2: O: Online computation module
3: D: Data,size: n×p
4: Q: Random sampling queue,size:n
5: tlim: human time constant .Fixed to 1 sec. 6: t0: currentTime()
7: timeLe f t: tlim
8: b:batchSize .A conservative size, e.g., b = 100
9: whileQ.notempty()do .Until all samples are used
10: whiletimeLe f t>0do
11: i←Q.pop(b) .i is a vector of size b
12: x←D[i] .x is a matrix of sizeb×p
13: ∆←O.update(x) .∆= computation time
14: b←adaptBatchSize(b,∆,tlim) 15: timeLe f t: tlim−(currentTime()−t0)
16: end while
17: O.returnResults() .Visualization is updated
18: end while
19: end procedure
upper bound on the number of clusters. At each iteration it includes a new batch and appropriately merges/splits the clusters. Notice that in clustering, at each iteration of Algorithm 1, only a subset of the items is “added” to the clustering model to revise the cluster centres. This is followed by a step where all the “seen” points are associated to these revised cluster centres. The results are then presented on a small multiple visualization where each cluster is represented by a multiple and a distinct color (taken from ColorBrewer [20], see Figure 1-a). The non-clustered (those not yet processed) are displayed within the first multiple. As computations iterate, the non-clustered items are distributed over to the other clusters.
Online Statistical Computations:In addition to these algorithms that often operate on the dimensions, there are also computational methods to estimate statistics from the data. For instance, our prototype has a view that dynamically computes difference statistics (Cohen’s D [44]) between the selected and not-selected items (see Figure 1-c). Although we do not incorporate a progressive version of these calculations and the visualization (partly due to the lower computational costs), we in-clude them under this section for the sake of completeness.
2.2.2 Adaptive Sampling
Ensuring the temporal constraints within our approach is of key im-portance and sampling is the key mechanism to ensure a good qual-ity / efficiency trade-off. In order to ensure efficiency in the computa-tions while still maintaining the temporal constraints, we developed an adaptive sampling strategy to improve convergence times by adjusting batch sizes (i.e., the amount of data that is handled within an iteration) adaptively. The functionadaptBatchSize(b,∆,tlim)(Algorithm 1, line
14) is where we perform this iterative revision. In this function, we start by finding a multiplierm=tlim/∆and if∆<tlimwe increase the
batch sizebwithb=b∗√mand if∆>tlimwe reduce the batch size
byb=b/m2. This ensures that the sampling method finds an optimal batch size that can be computed under the time limits while ensuring reduced overall completion time. Note that we have chosen conserva-tive multiplicator factors (√m,m2) to account for the non-linear nature of computational complexity. The performance of such adaptive sam-pling strategies can even be improved further through techniques such as predictive caching [11] or binning [26].
DR3: Employ an adaptive sampling mechanism that estimates suit-able sample sizes for computations to ensure efficiency in convergence while still respecting the temporal constraints.
2.3 Interaction Mechanisms
The above mentioned online computation methods are used in inte-gration with the conventional linking & brushing and the keyframed
brushing mechanism. In the following, we present different ap-proaches to enable the interaction within such systems.
2.3.1 Immediate response & progression granularity
Our online computation mechanism immediately responds to user in-put such as a new selection of a set of dimensions (similar to Figure 2). The interactive input triggers our algorithm which returns the first, ap-proximate result within one second.
DR4:Facilitate the immediate initiation of computations in response to user interactions that limit the domain of the algorithms.
Fine-grained progression may not be always desirable. In particular circumstances, frequent updates on the analytical model can generate additional cognitive load on the users, thus leading to frustration. Re-fer to Section 4.1.3 for an example situation that arose in our case study.
DR5: Provide users with interaction mechanisms enabling manage-ment (pause, step size, re-run) of the progression.
Visual analytic solutions with multiple progressive views may lead to a problem which we callfluctuation, a case where views process the data at different rates, and reach to their final states at different moments. We observed that such cases frequently led the analysts to confusion (Section 4.1).
DR6:During the interaction design of visual analytic solutions, con-sider the effects of possible fluctuations due to unaligned progression in multiple progressive views.
2.3.2 Keyframed brushing
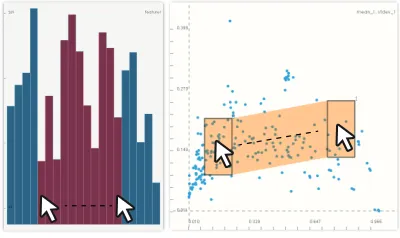
Thekeyframed brushingmechanism is intended to reshape (a certain subset of) analytical tasks as a dialogue while keeping the user en-gaged. This methodology has been shown to generate dynamic vi-sual summaries [44] and structured selection sequences [29] and we employ this technique here. The user defines two or more brushes (according to his/her analytical goal), similar to defining key frames in computer-assisted animation [10]. Using thesekey brushes, a se-quence of in-betweenbrushes is generated automatically. After the brush sequence is computed, the system starts traversing through this sequence without the need for further input by the user. Depending on the user’s preference, the complete sequence is traversed in 10 sec., 20 sec., or 30 sec., and moving from one brush to the next takes 1 second. Here, traversing the whole sequence can be considered asa task oper-ating at Level 3andmoving from one brush to the next as operating at Level 2as defined above. Keyframed brushing enables the user to fo-cus on the linked views that display the results of the animation rather than paying attention to moving the brush in a particular fashion. Refer to Section 4.2 for a demonstration of cases where keyframed brushing proves to be helpful in cases that are hard to investigate with manually modified brushes. This mechanism has a utilization both as an auto-mated linking & brushing operation and as a method to interact with the computational tools. In order to construct brushing-based anima-tions, we enable the specification of key brushes through conventional visualizations, such as scatter plots and histograms. In Figure 3, the interface to define a brush sequence can be seen. We draw overlays to abstract the range of the final brush sequence. The use of such inter-active mechanisms led to the following recommendation:
DR7:Provide interaction mechanisms to define structured investiga-tion sequences for systematic generainvestiga-tion and comparisons of compu-tational results.
2.4 Design Considerations for visual representations Here we discuss the decisions made whilst designing visual represen-tations for progressive analytics. We focus on how to effectively in-corporate animation and communicate progress and uncertainty.
2.4.1 Animated Transitions
Fig. 3. Keyframed brushing can be performed in a histogram or in a scat-terplot. Interactively determined start and end selections (“key brushes”) are accompanied with computed “in-between” brushes.
has also been disputed [31], there are several good examples where animations proved to be useful, both as transitions between different graphics [22] and between different projections of high-dimensional datasets [13, 6, 23].
Each computational result can be thought of as a key frame in an animation and the in-betweened frames are computed by the anima-tion module. Animated transianima-tions are controlled by the first level of operation and are done at 10 Hz or faster. A single animation sequence takes one second. For the sake of simplicity, we focus on animations that display PCA results and we start with a viewV that shows the PCA projection of the data based on all the dimensions
Immediate response animations – In this setting, the visualization responds immediately after one second and in order to maintain the human-computer dialogue also in this case, the visualizationV is fed with new, more accurate computation results every second. As a re-sult, the points inVstart animating to their new positions in the newly available PCA projection. However, if there is no apparently interest-ing structure in the first results, or at any instance, the user can update the selection. In this case, the current animation is stopped immedi-ately and the view animates to the new computation results, instead. The animation ends when all the items are processed.
Keyframed brushing animations – Stolper et al. [37] articulates the challenge of progressive visualization as keeping a balance between showing most up-to-date information and keeping the analyst from being distracted by continuous updates. Accordingly in our case study (Section 4.1), the analysts reported that the continuous updates might not be desirable at certain instances and needs to be controlled. In order to accommodate this, we offer an alternative animation modality. These animations are triggered when the user performs a keyframed brush operation. A typical use is as follows: Firstly, the user makes a keyframed brush sequence that selects different subsets of dimensions then observe the differences between the PCA computations that are done for each of these selections in the sequence. The system waits for one second before animating to the next result to give the user enough time to observe the results.
DR8:Support the interpretation of the evolution of the results through suitable visualization techniques.
2.4.2 Improving Animated Transitions
In the following, we present selected improvements to animated tran-sitions. The first improvement is related to maintaining the coherence between two key frames (two computational results) of an animation. Such an improvement is important in order to preserve the mental map of the user [5] and similar challenges have been studied in other do-mains, e.g., graph drawing [16]. In the case of PCA, the resulting principal components (PCs) are known to have arbitrary rotations and signs due to the nature of PCA [24]. Due to this fact, although the structure of the point distribution does not change, i.e., item neighbor-hoods stay the same, the PCs can come out flipped and/or mirrored. This makes it hard to follow the animations and creates arbitrary ro-tations. We solve this by checking the correlations ρ (using Pear-son’s correlation measure) of the axes between the first,x1, y1, and
PC2
PC1
PC2
PC1
[image:6.612.79.279.50.169.2]a) b)
Fig. 4. Coloring to enhance the communication of change between an-imation frames. A 2D color map from the CIELUV color space using a fixed lightness value is used (corners of the 2D map are shown). Points are colored according to their position at the beginning of the animation sequence (a) and this color stays the same for the whole animation (b).
the second PCsx2,y2. Ifρ(x2,y1)>ρ(x2,x1), we flip the axes, and
ifρ(x1,x2)<0 (negatively correlated) we mirror the axis (mirroring
check is done also fory). Similarly, in the case of cluster computa-tions, the resulting cluster labels are in principle arbitrary. In order to make coherent transitions between key frames (two clustering re-sults), we find a mapping between two consecutive labellings. We use a metric called Jaccard coefficient [38], which measures the overlap between two sets. For each clusterciin the current result, we compute
the Jaccard values with all the clusters in the next framec0and find the corresponding clusterc0jwith the highestJaccard(ci,c0j)to update the
mapping accordingly.
Coloring is also used to support the tracking of changes in the ani-mations in scatter plots. We map the color of each point based on their x,ycoordinates in the beginning of an animation sequence (Figure 4-a) and the coloring stays constant for all points through the animation. The corners of the 2D color map and the resulting colors can be seen in Figure 4. The color map is constructed using an isoluminant slice of the CIELUV color space [47]. With this approach, we utilize a mixture of dynamic and static techniques in the visualization of change.
2.4.3 Communicating Progress & Uncertainty
The communication of progress and the uncertainty (or error) in the computational results are key aspects when using approaches that present approximate results such as ours. Both Stolper et al. [37] and Schulz et al. [34] refer to this as an important element of progressive systems. We offer a number of channels to support the users in anal-ysis sequences. Firstly, whenever online computation results are visu-alized, we display a simple progress bar to inform on what percentage of the data has been consumed (see Fig. 5, the blue bar on top).
DR9:Inform analysts on the progress of computations and indications of time-to-completion.
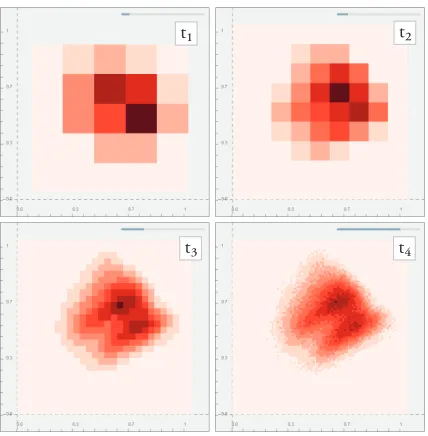
Secondly, we suggest alternative visual representations that are both communicating the inherent uncertainty in the computations and also making it harder to make micro readings (i.e., at observation level) when the presented results are more uncertain. In this visualization option (Fig. 5), we switch from a scatter plot to a binned representa-tion where the bin size is adaptively adjusted according to the percent of the data seen in the result – the bin sizes are larger when the sam-ple percentage is low, i.e., coarser grid att1, and gets smaller as the
computations progress to the finer resolution grid att4.
One aspect we do not present here is a quality metric as also sug-gested by Schulz et al. [34]. Any of these views are better supported if domain specific metrics to inform users with quantified measures of success are included. One possibility could be to also incorporate both visualization and data level metrics [7] as alternative heuristics of change towards a “good” solution. One alternative here is to use the neighborhood preservation ratio[46] as a measure of change between consecutive results (see Section 4.3 on how this is used for evaluation).
t1 t2
[image:7.612.64.278.46.264.2]t3 t4
Fig. 5. An alternative representation to communicate the uncertainty in PCA computation results. Here we inform users on the converge of the computations (thus the inherent uncertainty) through two channels: i) the progress bar to indicate the amount of data consumed – gray bar on top of all four ii) a density estimate representation of the points with a varying kernel size that makes micro readings from the plot harder where results are more uncertain, e.g., fromt1tot4.
3 INTERACTIVE PROGRESSIVE ANALYSIS SYSTEM PROTO
-TYPE
We realized our approaches and techniques within the context of a linked view system where several selections on multiple visual rep-resentations can be combined using Boolean operations. In order to have the variables as our main visual entities in some of the graphics, we employ a technique called dual-analysis [41]. From here onwards, we refer to this prototype asDimXplorerand we used this tool to vi-sually explore the credit card transaction data and locate credit card expense segmentation (Figure 1) during our case study. The tool in-corporates a map view on which the transaction data is geographically plotted, a difference view that displays the difference (using Cohen’s D ) between the selected and not-selected items (which can be likened to the deviation view as presented in Turkay et al. [41]) which also enables the interactive selection of features. As detailed earlier, a pro-gressive PCA View visualizes PCA results (projected to the first two components) through animation and a progressive cluster view visual-izes the clustering results where each cluster is represented as a small multiple also to enable the selection of distinct clusters.
4 EVALUATINGPROGRESSIVEANALYTICSMETHODS
We evaluate our approach from different perspectives using a num-ber of methodologies: i) To evaluate how our progressive analysis ap-proach influences the way experts carry out analyses, we performed four analysis sessions over a two-month-long period and gathered ob-servations, ii) To demonstrate how some of the interactive elements are utilized to deal with high-dimensional data, we present a use case with an openly available data source, iii) To numerically evaluate how online algorithms compare to their non-streaming counterparts, we ran a systematic study on the effects of sampling over a set of data sources.
4.1 Financial Analysis Case Study
To inform the development and to evaluate the validity of our resulting solutions, we conducted a two-month-long case study during which we observed a group of analysts of a national bank from the EMEA (Europe, the Middle East, and Africa) region performing credit card expenditure segmentation analysis.
At the beginning of the study, we conductedfly-on-the-wall obser-vations [8] and semi-structured interviews withfour analysts to gain
insight on the problem domain and their approaches to the problem. We were provided with an anonymized credit card transaction dataset collected between July 2014 and June 2015. We carried out four anal-ysis sessions in the work environment of the domain experts. We intro-duced DimXplorer during the first session and the rest of the sessions were on credit card expenditure segmentation analysis. The last ses-sion, however, was devoted to analysis activity withnon-progressive visual analytics to observe for differences.
Our methodology follows the insight-based evaluation methodol-ogy suggested by North [28] where we try to identify insight types and partially adopted an approach similar to Guo et al.’s work [19] that suggests the use of interaction logs together with insight-related investigations. We recorded all the session and transcribed the infer-ences made and questions asked during the analyses, and described the relationship between the design recommendations and the relevant actions taken during the course of data exploration.
4.1.1 Credit Card Expenditure Segmentation Problem
Credit card transaction segmentation is the problem of grouping credit card transactions based on the similar demographics and financial met-rics of customers. Location, amount, and frequency of the credit card transactions, demographics and financial well-being of the customers are important factors that can be used to form expenditure profiles. Crucial to the decision-making and long-term strategy-making, the typical outcome of such an analysis is a list of customers or expendi-ture profiles with subcategories representing customer groups having similar spending behaviors and demographics.
Segmentation analysis takes many aspects of financial metrics and demographics as input, providing a practically inexhaustible hypoth-esis space. The analysts reported that they form the questions as a starting point for their analysis by carrying out brainstorming sessions or consulting to the experience of senior analysts. Transaction and customer profile segmentation tasks typically involve clustering and classifying operations on large, high dimensional datasets. Such an en-deavor strives to locate interesting patterns, and derive research ques-tions and hypotheses from a large selection of underlying phenomena. We argue that the application of progressive analytics in this context can enable quick hypothesis generation and iterative fact mining. Credit Card Transaction Data: The data analyzed during the case study involved more than 300,000 credit card transactions of more than 5,000 customers. Each transaction included location, amount, demographic information (e.g. job type, marital and education status, income, age), and financial metrics (e.g. mean transfer and deposit, risk and response score, number of credit cards, entropy of transfers) of the customers. See the supplementary document for the full list. Analysis Tasks: During theprecondition phase[36] of our study, we considered the obvious opportunity for exploratory visual analy-sis of the data where they could form data-driven research questions and hypotheses for further analysis. To facilitate the exploratory anal-ysis environment, we considered the generation of credit card transac-tionsubsegmentsboth automatically and manually so that the analysts could form a consolidated segment from those subsegments — an ef-fective approach enabling human intervention. With these ideas in mind, we identified the tasks for transaction data exploration as fol-lows and provide mappings from our tasks to the previously published task taxonomies by Yi et al. [48] in the supplementary document.
T1: Automatic Feature-based Subsegment (AFS) Generation. Au-tomation of subsegment generation based on selected features helps to identify underlying groupings in a dataset. We facilitate this through the online clustering algorithm (Section 2.2.1) and users can select the elements of the cluster by simply highlighting one of the small multi-ples (Figure 6-b). To support the characterization of the selected subset of items, users refer to thedifference view(Figure 6-g).
Inference Moment Explanation & Quote
Quote (Qu-1)
Session 2-1 (7:01)
A1:“Let’s try some other demographic features as this selection seems like not going to bring new patterns. We can generate so many new hypotheses in a very short time without waiting for the whole calculation to end.”A1: “...visualization is quite engaging as we don’t have to wait for even a moment to get some initial results.” Quote
(Qu-3)
Session 2-2 (13:35)
A1:“It seems like the clustering will not change. Almost all of the data has been calculated, let’s switch to some other set.”
Quote (Qu-7)
Session 3-1 (3:10)
The team tried a new feature set and immediately observed agoodseparation of data points. However, after only 15-20 seconds, the separation dramatically changed. A2:“Well, I think waiting for a while might be a good thing.”
Quote (Qu-9)
Session 3-1 (51:03)
During the analysis, A3:“I’ve just seen a high response score for the selected cluster, but it has just gone away.”As the clustering algorithm continued to its calculations, the data points moved to other clusters changing the pattern A3 previously discovered:“Wouldn’t it be nice to have a button that pauses the progressive visualization?”
Insight (I-3)
Session 2-2 (24:45)
A1:“The customers working with other banks seem to be more profitable ones as their financial metrics draws a better picture.”(higher transfers, EFT, higher response score, etc.).
Testing (Te-1)
Session 2-3 (00:47)
Hypothesis (insight) I-3 has been rejected. A2:“Customers with 2 or 3 credit cards and low credit card limits seem to represent low financial profile.”
Table 1. A selection of inferences made during and quotes taken away from the case study. AbbreviationsAandR stands forAnalyst and
Researcher, respectively. A comprehensive list of all inferences, quotes, questions, and hypotheses can be found in the supplementary document.
T3: Segment Composition. Composed segments could be formed through combination (e.g. union or intersection) and refinement of subsegments (Figure 6-d).
T4:Segment Fine-tuning.Interactive brushing enables further modifi-cations on the combined segment. Such selections could be performed at any level of data granularity from single transactions to a set points forming a cluster (Figure 6-e).
T5:Composed Segment Description.Composed segments can be de-scribed through difference view where the composition can be com-pared with the rest of the data.
4.1.2 Exploratory Analysis Workflow
An example workflow (from one of our sessions) with the aforemen-tioned tasks is shown in Figure 6. In this particular instance, a pro-gressive cluster small multiples view for AFS generation (T1), a pro-gressive PCA view for UDS definition (T2) were utilized. Here we start the analysis with a manually determined subset of the features (Fig. 6-a – EFT features, mean transfer, and acceptance rate) to trigger PCA and clustering computations (Fig. 6-b,c). After a few iterations, analysts were able to view the first approximate clusters and PCA re-sults. As these views were progressively being updated at each step, analysts made numerous subsegment combinations through selection. In response to such subsegment selections (i.e. clusters or selections on PCA plot), DimXplorer seamlessly composes (T3) (Fig. 6-d) and presents the combined segment (Fig. 6-f) and the segment description (Fig. 6-g) (T5). At a particular moment, analysts noticed that the com-bination of two clusters presented a particular customer segment with customers working with very few other banks (i.e., low EFT entropy) and had low credit card limits. Those customers were also interested in offers and campaigns as their acceptance rates were significantly higher than the rest of the customers (Fig. 6-g). Analysts further no-ticed that the transactions belonging to the segment were also plotted mainly as outliers (Fig. 6-c). In order to base the model to a larger set of transactions, they formed two additional subsegments by selecting all the outliers on the PCA view. New selections slightly moderated the EFT entropy and credit card limits resulting in a less clear com-posite segment picture. After a number of fine-tuning operations (T4), they discovered that adding the transactions made around the airport (Fig. 6-e) clarified the description of the segment considerably dif-ferent from rest of the data. The updated version of the composite segment (Fig. 6-f) was including the customers that were not only dif-ferent with respect to acceptance rate, but also associated with a low profile in the mobile banking service usage — making them good can-didates for further credit card offers.
4.1.3 Observations and Discussions
The case study was designed with the aim of validating the progressive design guidelines rather than the capability of the tool in segmentation. Hence, more emphasis was put on the behavioral observations in
re-lation to the design recommendations (DR) discussed in Section 2. A selection of relevant observations and quotes are listed in Table 1 and the text refers to them accordingly (e.g. Qu-1).
Human time Constants: Here we report the relevant state-ments on how the human time constants (DR1) as an underlying tem-poral control mechanism were received. Analyst-1 stated that they can “generate so many new hypotheses in a very short time without waiting for the whole calculation to end,” and further stated that the “ visual-ization is quite engaging as we don’t have to wait for even a moment to get some initial results” (Qu-1). As listed in Table 3 in the Appendix, we observed an overall increase in the number of insights made and questions asked per session during progressive analysis sessions com-pared to the non-progressive one (i.e., the final session).
Update on Demand: The update rate of the analytic model and visualization is an important parameter that needs to be adjusted ac-cording to the requirements of the application. Analyst-3 stated that ever-changing cluster view frequently interrupted his ongoing expla-nations about the findings during the course of the analysis (Qu-9). Particularly, fluctuations that occasionally happened during the calcu-lations caused confusion and hesitation, which led them to offer a new feature to DimXplorer (Qu-11) so that they were able to modify the size of the data chunks processed at each step. This was mainly due to the fact that they found it quite cumbersome to discuss on a non-steady visualization (Qu-12). Clearly, we were experiencing the trade-off be-tweenquality-andquantity-first strategies[34].
Progression: We observed that the availability of the progress made during the calculations impacts the renounce decisions of ana-lysts. During the second analysis session, Analyst-3 warned his col-leagues that the progressive clustering algorithm was about to con-sume all the data while they were arguing about a spending pattern of a customer segment (Qu-3). He suggested starting a new round of analysis with a new set of attributes as he was quite confident that the result of the ongoing calculation would not significantly change upon the consumption of the whole data (DR8). During the second and third sessions, we observed that the analysts tried 14 different feature com-binations for clustering, and 13 of the times they did not wait until to the end of the calculations (Table 2).
The use of data completion rate as an indicator of the progres-sion occaprogres-sionally caused confuprogres-sion while making renounce deciprogres-sions (DR9). Not surprisingly, while deciding to give up on a feature set, the analysts relied mostly on the stabilization of the progressive views (i.e.
Data Contributed %0-25 %26-50 %51-75 %76-100
Renounce Counts 6 5 2 1
Enriched Transaction Data
Feature Selection
Progressive Clustering
Progressive PCA
Composite Segment Fine-tuning
Composite Segment
Auxiliary Views
Segment Description
a
T1
T2
UDS0
Subsegments
UDS1 AFS4 AFS5
FT0
FT2 FT1
Subsegments Subsegments
Composition Logic
T3 T4
T5 c
b
d
e
f
[image:9.612.101.504.53.232.2]g
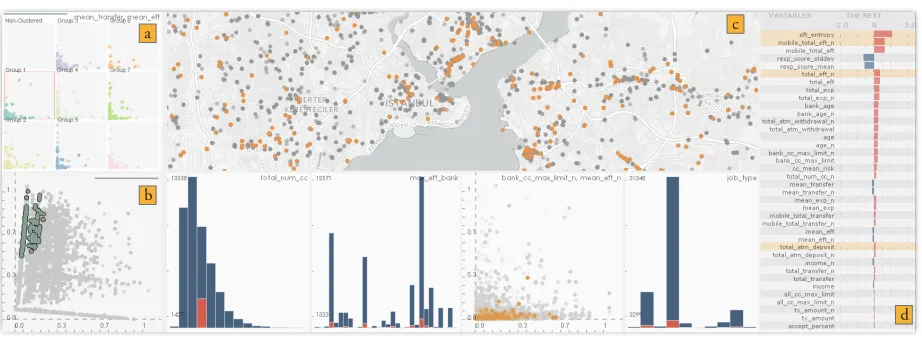
Fig. 6. An example analysis workflow. In response to a selection of features (a), theClustering Small Multiples View(b) and thePCA View (c) progressively visualize the results at each iteration of the calculations while users can renounce any ongoing calculation by selecting a new feature set from the difference view (a). During this process, subsegments are generated in automatic feature-based (AFS) or user-defined (UDS) manner (e.g.AFS4,AFS5,UDS0, andAFS1). Subsegments are combined (d) based on the composition logic defined by the analysts. Further refinements
are applied to the combined segment by brushing on auxiliary views (e) (e.g., exclude the smaller transactions). The resulting segment can be viewed over a map (f), and the data subset corresponding to the composite segment is compared with the whole dataset in the difference view (g).
clustering and PCA). Early and temporary stabilization could also be another problem as it can beguile the analysts into making premature judgments. We observed that analysts made early decisions about the patterns in the data and behaved more conservative in making judg-ments towards the end of the case study (Qu-7 and Qu-9). Occasion-ally, they suggested each other to wait until the computations“settle down”to some extent. Another interesting observation relates to the cases where there are multiple active progressive views. In certain cases, it is likely that different views reach stability at different pro-gression levels, which made the analysts hesitant at early convergence levels. Such visual and computational fluctuations can lead to loss of trust, however, showing the likelihood of error or a quality metric could mitigate the effects of such fluctuations.
Time vs. Uncertainty: The level of the confidence with the cur-rentunfinishedresult depends partially on analysts’ judgments, since the current progress indication is purely data based. Moreover, mo-mentary state of the analytic process and the sampled data (e.g. the discrimination capability of the selected feature set) seem to be ad-ditional factors on decision of when to renounce an ongoing analytic process. This was inline with our observation that analysts gave up on feature sets at various moments of the progression. Even with the same selected feature set, the analysts halted the ongoing calculations at dif-ferent data completion levels. Table 2 shows the renounce counts with respect to the moments they abandoned the continuing calculations.
During the analysis sessions we observed that analystsmade use of every moment of the progression by discussing and reasoning, instead of waiting idly. There have been cases where analysts made claims, and, during the same course of calculation, rejected them. For exam-ple, Analyst-3 pointed to a relationship between the total number of credit cards of the customers and the EFT entropy after roughly 30% of the data had been consumed by the clustering algorithm (I-3). How-ever, after a period, he rejected his own claim due to the new shape of the clustering calculated with more than 60% of the data (Te-1).
Interactions Supporting Progressiveness: We observed that there seems to be several design decisions to better support pro-gressive visual analysis. Most of the interaction issues we observed seem to be due to the longstanding interaction habits acquired from traditional non-progressive tools, e.g., the typical linking & brushing behavior. Analysts frequently asked whether changing an aspect in one of the views will affect the calculations (i.e., restart or continue). We postulate that visualization systems need to incorporate effective affordances for guiding the users in complex use scenarios such as the
ones described here. Interaction design decisions seem to be of great importance while orchestrating the progressions of multiple views, and while providing intuitive usability to guarantee progression abstraction from various tasks such as selection and filtering (DR6).
4.2 Use Case: Determine dimensions with structure
We analyze a dataset on protein homologies that was made available in the 2004 KDD Contest [1]. The dataset consist of 10498 rows and 77 columns, i.e.,n×p=10498×77. The analytical unit task here is to investigate the set of dimensions to determine those with an under-lying structure. Here, we make use of PCA calculations on different subsets of the dimensions and observe the changes to spot interesting structures. We start with a visualization of the dimensions over two statistics: Skewness and kurtosis (Figure 7-left). We observe that most of the dimensions have similar kurtosis values but varying skewness. To investigate the dimensions over their skewness values, we build a keyframed animation that starts with dimensions that are left-skewed animating towards those that are right-skewed. When we observe the resulting animation with the key frames shown in Figure 7-right, we see that there are structures appearing between frame 7 and 8. Further inspection reveals that there is a categorical dimension leading to these structures. Here, the enhanced interactions and coupled progressive calculations enabled us to quickly identify “interesting” projections.
4.3 Numerical Evaluation of Online Computations
We evaluate the quality of the results that are produced by the incre-mental PCA module and observe how quickly the computations con-verge to stable results in comparison to an offline algorithm. We first compute PCA using an offline approach and project the data items to the first two principal components, denoted asρ. We then compute the PCA projections in 10 iterations having the sampling size grow by 10% at each step. At the end of each iteration, all the data items are projected to the first two principal componentsρ0and we compareρ0 toρ. The comparison is done by a similarity metric called neighbor-hood preservation ratio(NPR) [46]. Ifρ0toρ are the same, theNPR score is 1 and approaches 0 as two projections differ from each other.
t
1t
2t
3t
4t
5t
6t
7t
8t
9t
10t
8skewness
kur
tosis
[image:10.612.57.565.52.102.2]Progressive PCA
Fig. 7. An analysis of the 77 dimensional protein homology dataset. The aim is to find dimensions that carry structured information. A keyframed brush is generated through askewnessvs.kurtosisplot (the dimensions have similar kurtosis but varying skewness). The resulting brush sequence traverses from the left-skewed dimensions to the right-skewed ones. When the resulting animation of PCA results is observed (only the key frames here), a strong structure is spotted at key framet8. On close inspection, the structures are found to be due to a categorical dimension.
within the temporal limitations, hence extra care needs to be taken to communicate the progress appropriately in such cases.
5 DISCUSSIONS ANDLIMITATIONS
Due to the conflicting reports on the successful utilization of ani-mations [45, 31], we carefully consider our design choice related to the use of animated transitions. In our visualization approach, PCA projection results carry spatial characteristics, i.e., have a meaningful mapping to thexandycoordinates and all the changes between dif-ferent projections happen within this spatial mapping — meeting the congruenceprinciple [45]. Also through functionalities such as paus-ing or looppaus-ing we aim to satisfy theapprehensionprinciple [45].
Although online learning approaches demonstrate time and mem-ory efficiency when dealing with large datasets, compared to offline versions, i.e., algorithms that process the whole data in a complete batch, online algorithms can lead to inaccurate results and might suf-fer from overfitting to the data that has been processed. Such problems can be tackled via error-bounded methods [2] and, as touched upon in several parts of the text, through more effective sampling strategies. In our current approach, we employ a random sampling strategy with a focus on maintaining the pace of interaction. This approach can poten-tially lead to further fluctuations (which are observed to be disruptive for analysts) in the computations since the underlying structure of the data is not considered. Our numerical evaluation also revealed that for datasets with strong structures tend to consolidate with larger portions of the data, further supporting this issue. Such limitations can be ad-dressed by incorporating sampling methods that are not “blind” to the structures in the underlying data. Related literature from data mining and machine learning domains offer advanced alternatives [17, 40]. One promising future work to mention here is investigating the im-pacts of such sampling methods on progressive analysis sessions.
Depending on the task and the computational tool that needs to be employed, there are incremental versions of different algorithms in literature, e.g., classification, regression [17]. However, there exists tasks that are not compatible with online algorithms.In such cases, it is advisable for visualization designers to focus on improving the perfor-mance of the system, using methods such as pre-computing or caching, to maintain interactivity within the limits of human time constants as also evidenced in recent work focused on such capability [11, 26].
During the case study sessions, we observed that when different on-line computational methods are incorporated concurrently, it is likely that these methods have variations in their progression. This was, at times, confusing for the analysts. Our current prototype had no mech-anism to check and correct for that. However, we consider this ob-servation as a pointer for future work and a sign that there are several aspects to investigate in the use of these tools.
At the end of the case study, analysts reported that they had expe-rienced higher level of engagement during the analysis compared to their existing working setup. With the leverage of progressiveness, high engagement with, and escalated throughput of the analytical pro-cesses seem to require new ways of thinking about the usability of the exploratory analysis tools. High number of insights and interest-ing clues extracted from the data might be lost durinterest-ing the analysis sessions – calling for advanced provenance capabilities. One of our interesting observations involved an inference and rejection of an in-sight that was done in almost 20 minutes (I-3 and Te-1). Due to the lack of provenance features, they were not able to regenerate the case. One important limitation in progressive analysis sessions is to
de-termine when to renounce and pave the analysis to a new direction. The observations that analysts can occasionally draw insights and re-ject them later on signals a drawback: The time saved by the applica-tion of progressive analytics could be lost while trying to amend the consequences of incorrect inferences. This risk could be mitigated by employing more appropriate data sampling mechanisms and progres-sion indicators. However, the renounce deciprogres-sion still requires human intervention, which is likely to require the development of domain-specific heuristics to support more effective decision making. One additional perspective to mention is the need for appropriate training and familiarity with progressive methods. Although we observed that fluctuations in the results can lead to confusions, the analysts can learn to interpret those as pointers to underlying structures, which, however, might necessitate the prolonged use of such tools.
6 CONCLUSION
In this paper we discuss how an established cognitive model of human-computer interaction [9] can be placed as the underlying mechanism to determine the pace of interaction in approaches where the analy-sis happens through the successful facilitation of the dialogue between the analyst and the computer, in particular those that involve high-dimensional data sets. We present how suitable computational meth-ods that can perform “progressively” can be integrated to operate at the temporal frame set by these underlying constraints. To better fa-cilitate the dialogue with these computational methods, we suggest a series of interaction and visualization techniques and externalize our reasoning in a series of design recommendations.
In order to understand and evaluate how our approach facilitates better analysis, we carried out a series of analyses with a group of fi-nancial data analysts. Upon working on our progressive visual analyt-ics approach through a prototype, analysts reported increased levels of engagement during the analysis sessions, thus leading to a higher num-ber of observations made and hypotheses tested. As inline with the findings of our case study, progressiveness facilitates early acceptance or rejections of hypotheses, and makes the testing of several compu-tational models feasible which would otherwise take long time and effort. We observed that progressive analytics has shown to be a pow-erful facilitator of engagement within the exploratory analysis of high-dimensional data. However, we further observed that progressiveness could be misleading under particular circumstances and should be uti-lized carefully. Adoption of domain specific metrics and the design of visualizations to better inform analysts on the progress has the po-tential to address these limitations calling for further research through targeted design studies involving progressive methods.
With our approach, instead of forcing the user to adjust to the tem-poral and cognitive capabilities of visual analysis solutions, we ori-ent the technical solutions at the communication characteristics of the users. With this, we take a step to realize one of the recommenda-tions inIlluminating the Pathby Thomas and Cook [39], that reads “. . . identify and develop interaction techniques that address the ra-tional human timeframe.”. Given the positive responses we observed, progressive analytics carry the potential to play a key role in interactive analysis systems dealing with high-dimensional large data sets. ACKNOWLEDGMENTS
REFERENCES
[1] ACM. KDD Cup 2004. http://www.sigkdd.org/kddcup/,
2004.
[2] S. Agarwal, B. Mozafari, A. Panda, H. Milner, S. Madden, and I. Stoica. Blinkdb: queries with bounded errors and bounded response times on
very large data. InProceedings of the 8th ACM European Conference on
Computer Systems, pages 29–42. ACM, 2013.
[3] S. Albers. Online algorithms: a survey. Mathematical Programming,
97(1):3–26, 2003.
[4] R. Amar, J. Eagan, and J. Stasko. Low-level components of analytic
activity in information visualization. InInformation Visualization, 2005.
INFOVIS 2005. IEEE Symposium on, pages 111–117. IEEE, 2005. [5] D. Archambault, H. Purchase, and B. Pinaud. Animation, small
multi-ples, and the effect of mental map preservation in dynamic graphs.
Visu-alization and Computer Graphics, IEEE Transactions on, 17(4):539–552, 2011.
[6] C. Bentley and M. Ward. Animating multidimensional scaling to
visu-alize n-dimensional data sets. InInformation Visualization, Proceedings
IEEE Symposium on, pages 72–73, 126, 1996.
[7] E. Bertini, A. Tatu, and D. Keim. Quality metrics in high-dimensional
data visualization: An overview and systematization. Visualization and
Computer Graphics, IEEE Transactions on, 17(12):2203–2212, 2011. [8] J. Blomberg, J. Giacomi, A. Mosher, and P. Swenton-Wall. Ethnographic
field methods and their relation to design.Participatory design:
Princi-ples and practices, pages 123–155, 1993.
[9] S. K. Card, G. G. Robertson, and J. D. Mackinlay. The information
visu-alizer, an information workspace. InProceedings of the SIGCHI
Confer-ence on Human Factors in Computing Systems, CHI ’91, pages 181–186, New York, NY, USA, 1991. ACM.
[10] E. Catmull. The problems of computer-assisted animation. SIGGRAPH
Comp. Graph., 12(3):348–353, 1978.
[11] S. Chan, L. Xiao, J. Gerth, and P. Hanrahan. Maintaining interactivity
while exploring massive time series. InVisual Analytics Science and
Technology. IEEE Symposium on, pages 59–66. IEEE, 2008.
[12] J. Choo and H. Park. Customizing computational methods for visual
analytics with big data. Computer Graphics and Applications, IEEE,
33(4):22–28, 2013.
[13] N. Elmqvist, P. Dragicevic, and J. Fekete. Rolling the dice:
Multidimen-sional visual exploration using scatterplot matrix navigation.
Visualiza-tion and Computer Graphics, IEEE TransacVisualiza-tions on, 14(6):1539–1148, 2008.
[14] J.-D. Fekete. Progressivis: a toolkit for steerable progressive analytics
and visualization. In1st Workshop on Data Systems for Interactive
Anal-ysis, page 5, 2015.
[15] D. Fisher, I. Popov, S. Drucker, et al. Trust me, i’m partially right:
in-cremental visualization lets analysts explore large datasets faster. In
Pro-ceedings of the 2012 ACM annual conference on Human Factors in Com-puting Systems, pages 1673–1682. ACM, 2012.
[16] Y. Frishman and A. Tal. Online dynamic graph drawing. Visualization
and Computer Graphics, IEEE Transactions on, 14(4):727–740, 2008. [17] M. M. Gaber, A. Zaslavsky, and S. Krishnaswamy. Mining data streams:
a review.ACM Sigmod Record, 34(2):18–26, 2005.
[18] T. Green, W. Ribarsky, and B. Fisher. Visual analytics for complex
con-cepts using a human cognition model. InVisual Analytics Science and
Technology. IEEE Symposium on, pages 91–98. IEEE, 2008.
[19] H. Guo, S. R. Gomez, C. Ziemkiewicz, and D. H. Laidlaw. A case study using visualization interaction logs and insight metrics to understand how
analysts arrive at insights. Visualization and Computer Graphics, IEEE
Transactions on, 22(1):51–60, 2016.
[20] M. Harrower and C. Brewer. Colorbrewer. org: an online tool for
select-ing colour schemes for maps. Cartographic Journal, The, 40(1):27–37,
2003.
[21] H. Hauser. The iterative process of interactive visual analysis. Keynote talk at the EuroVA 2012 workshop, 2012.
[22] J. Heer and G. Robertson. Animated transitions in statistical data
graphics. Visualization and Computer Graphics, IEEE Transactions on,
13(6):1240–1247, 2007.
[23] D. Jeong, C. Ziemkiewicz, B. Fisher, W. Ribarsky, and R. Chang. ipca:
An interactive system for pca-based visual analytics.Computer Graphics
Forum, 28(3):767–774, 2009.
[24] R. Johnson and D. Wichern. Applied multivariate statistical analysis,
volume 6. Prentice Hall, 2007.
[25] D. Keim, F. Mansmann, J. Schneidewind, J. Thomas, and H. Ziegler.
Vi-sual analytics: Scope and challenges.Visual Data Mining, pages 76–90,
2008.
[26] Z. Liu, B. Jiang, and J. Heer. immens: Real-time visual querying of big
data. InComputer Graphics Forum, volume 32, pages 421–430. Wiley
Online Library, 2013.
[27] T. Muhlbacher and H. Piringer. A partition-based framework for building
and validating regression models.Visualization and Computer Graphics,
IEEE Transactions on, 19(12):1962–1971, 2013.
[28] C. North. Toward measuring visualization insight. Computer Graphics
and Applications, IEEE, 26(3):6–9, 2006.
[29] S. Rado, R. Splechtna, K. Matkovic, M. Duras, E. Grller, and H. Hauser. Towards Quantitative Visual Analytics with Structured Brushing and
Linked Statistics.Computer Graphics Forum, 2016.
[30] R. Rensink, J. O’Regan, and J. Clark. To see or not to see: The need for
attention to perceive changes in scenes.Psychological Science, 8(5):368–
373, 1997.
[31] G. Robertson, R. Fernandez, D. Fisher, B. Lee, and J. Stasko.
Effec-tiveness of animation in trend visualization.Visualization and Computer
Graphics, IEEE Transactions on, 14(6):1325 –1332, nov.-dec. 2008. [32] D. A. Ross, J. Lim, R.-S. Lin, and M.-H. Yang. Incremental learning for
robust visual tracking. International Journal of Computer Vision,
77(1-3):125–141, 2008.
[33] D. Sacha, A. Stoffel, F. Stoffel, B. C. Kwon, G. Ellis, and D. A. Keim.
Knowledge generation model for visual analytics. Visualization and
Computer Graphics, IEEE Transactions on, 20(12):1604–1613, 2014. [34] H. J. Schulz, M. Angelini, G. Santucci, and H. Schumann. An enhanced
visualization process model for incremental visualization. IEEE
Trans-actions on Visualization and Computer Graphics, 22(7):1830–1842, July 2016.
[35] D. Sculley. Web-scale k-means clustering. InProceedings of the 19th
international conference on World wide web, pages 1177–1178. ACM, 2010.
[36] M. Sedlmair, M. Meyer, and T. Munzner. Design study methodology:
Reflections from the trenches and the stacks.Visualization and Computer
Graphics, IEEE Transactions on, 18(12):2431–2440, 2012.
[37] C. D. Stolper, A. Perer, and D. Gotz. Progressive visual analytics:
User-driven visual exploration of in-progress analytics.Visualization and
Com-puter Graphics, IEEE Transactions on, 20(12):1653–1662, 2014.
[38] P. Tan and K. V. Steinbach M. Introduction to data mining.
Addison-Wesley, 2005.
[39] J. J. Thomas and K. A. Cook. Illuminating the Path: The Research and
Development Agenda for Visual Analytics. National Visualization and Analytics Ctr, 2005.
[40] Y. Till´e.Sampling algorithms. Springer, 2011.
[41] C. Turkay, P. Filzmoser, and H. Hauser. Brushing dimensions – a dual
visual analysis model for high-dimensional data.Visualization and
Com-puter Graphics, IEEE Transactions on, 17(12):2591 –2599, dec. 2011.
[42] C. Turkay, F. Jeanquartier, A. Holzinger, and H. Hauser. On
computationally-enhanced visual analysis of heterogeneous data and its
application in biomedical informatics. InInteractive Knowledge
Dis-covery and Data Mining in Biomedical Informatics, pages 117–140. Springer, 2014.
[43] C. Turkay, A. Lundervold, A. Lundervold, and H. Hauser. Representative factor generation for the interactive visual analysis of high-dimensional
data. Visualization and Computer Graphics, IEEE Transactions on,
18(12):2621–2630, 2012.
[44] C. Turkay, A. Slingsby, H. Hauser, J. Wood, and J. Dykes. Attribute sig-natures: Dynamic visual summaries for analyzing multivariate
geograph-ical data.Visualization and Computer Graphics, IEEE Transactions on,
20(12):2033–2042, 2014.
[45] B. Tversky, J. B. Morrison, and M. Betrancourt. Animation: can it
facil-itate? International journal of human-computer studies, 57(4):247–262,
2002.
[46] L. Van der Maaten and G. Hinton. Visualizing non-metric similarities in
multiple maps.Machine learning, 87(1):33–55, 2012.
[47] M. Wijffelaars, R. Vliegen, J. Van Wijk, and E. Van Der Linden.
Generat-ing color palettes usGenerat-ing intuitive parameters.Computer Graphics Forum,
27(3):743–750, 2008.
[48] J. Yi, Y. ah Kang, J. Stasko, and J. Jacko. Toward a deeper understanding
of the role of interaction in information visualization.Visualization and
![Fig. 2. An example for optimizing an analytical process against the three human time constants [9]](https://thumb-us.123doks.com/thumbv2/123dok_us/1433643.95888/4.612.107.511.49.200/fig-example-optimizing-analytical-process-human-time-constants.webp)